
An official website of the United States government
An official website of the United States government
The .gov means it's official.
Federal government websites often end in .gov or .mil. Before sharing sensitive information,
make sure you're on a federal government site.
The site is secure.
The
https:// ensures that you are connecting to the official website and that any
information you provide is encrypted and transmitted securely.
Use verbatim methods and equipment to capture, store, retrieve, and transcribe pretrial and trial proceedings or other information. Includes stenocaptioners who operate computerized stenographic captioning equipment to provide captions of live or prerecorded broadcasts for hearing-impaired viewers.
Employment estimate and mean wage estimates for Court Reporters and Simultaneous Captioners:
| Employment (1) | Employment RSE (3) |
Mean hourly wage |
Mean annual wage (2) |
Wage RSE (3) |
|---|---|---|---|---|
| 12,300 | 3.5 % | $ 31.36 | $ 65,240 | 1.6 % |
Percentile wage estimates for Court Reporters and Simultaneous Captioners:
| Percentile | 10% | 25% | 50% (Median) |
75% | 90% |
|---|---|---|---|---|---|
| Hourly Wage | $ 16.51 | $ 22.35 | $ 29.03 | $ 38.40 | $ 49.65 |
| Annual Wage (2) | $ 34,340 | $ 46,480 | $ 60,380 | $ 79,860 | $ 103,270 |
Industries with the highest published employment and wages for Court Reporters and Simultaneous Captioners are provided. For a list of all industries with employment in Court Reporters and Simultaneous Captioners, see the Create Customized Tables function.
Industries with the highest levels of employment in Court Reporters and Simultaneous Captioners:
| Industry | Employment (1) | Percent of industry employment | Hourly mean wage | Annual mean wage (2) |
|---|---|---|---|---|
| Local Government, excluding schools and hospitals (OEWS Designation) | 4,120 | 0.08 | $ 32.63 | $ 67,880 |
| State Government, excluding schools and hospitals (OEWS Designation) | 4,020 | 0.18 | $ 36.69 | $ 76,320 |
| Business Support Services | 3,600 | 0.44 | $ 24.78 | $ 51,540 |
| Colleges, Universities, and Professional Schools | 110 | 0.00 | $ 41.67 | $ 86,680 |
| Federal Executive Branch (OEWS Designation) | 40 | 0.00 | $ 31.09 | $ 64,680 |
Industries with the highest concentration of employment in Court Reporters and Simultaneous Captioners:
| Industry | Employment (1) | Percent of industry employment | Hourly mean wage | Annual mean wage (2) |
|---|---|---|---|---|
| Business Support Services | 3,600 | 0.44 | $ 24.78 | $ 51,540 |
| State Government, excluding schools and hospitals (OEWS Designation) | 4,020 | 0.18 | $ 36.69 | $ 76,320 |
| Local Government, excluding schools and hospitals (OEWS Designation) | 4,120 | 0.08 | $ 32.63 | $ 67,880 |
| Colleges, Universities, and Professional Schools | 110 | 0.00 | $ 41.67 | $ 86,680 |
| Federal Executive Branch (OEWS Designation) | 40 | 0.00 | $ 31.09 | $ 64,680 |
Top paying industries for Court Reporters and Simultaneous Captioners:
| Industry | Employment (1) | Percent of industry employment | Hourly mean wage | Annual mean wage (2) |
|---|---|---|---|---|
| Colleges, Universities, and Professional Schools | 110 | (7) | $ 41.67 | $ 86,680 |
| State Government, excluding schools and hospitals (OEWS Designation) | 4,020 | 0.18 | $ 36.69 | $ 76,320 |
| Local Government, excluding schools and hospitals (OEWS Designation) | 4,120 | 0.08 | $ 32.63 | $ 67,880 |
| Federal Executive Branch (OEWS Designation) | 40 | (7) | $ 31.09 | $ 64,680 |
| Business Support Services | 3,600 | 0.44 | $ 24.78 | $ 51,540 |
States and areas with the highest published employment, location quotients, and wages for Court Reporters and Simultaneous Captioners are provided. For a list of all areas with employment in Court Reporters and Simultaneous Captioners, see the Create Customized Tables function.
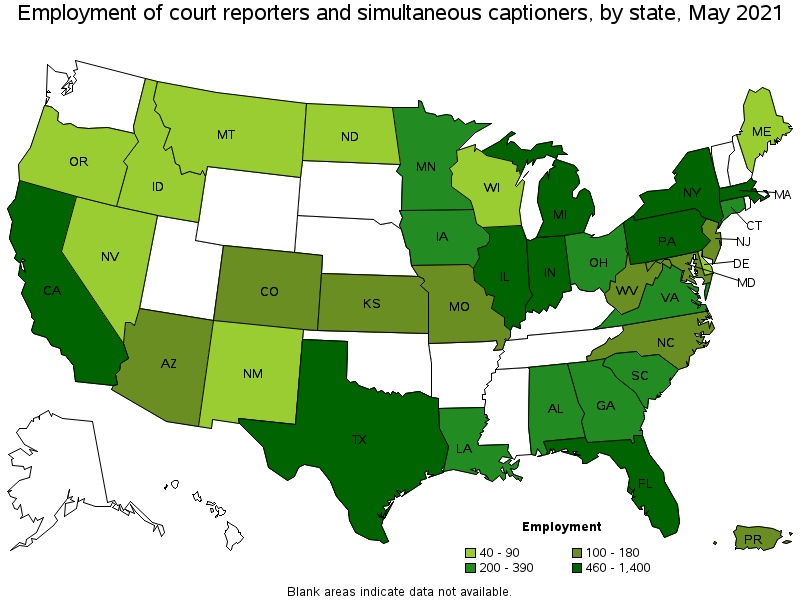
States with the highest employment level in Court Reporters and Simultaneous Captioners:
| State | Employment (1) | Employment per thousand jobs | Location quotient (9) | Hourly mean wage | Annual mean wage (2) |
|---|---|---|---|---|---|
| California | 1,400 | 0.08 | 0.97 | $ 40.25 | $ 83,720 |
| New York | 1,250 | 0.14 | 1.64 | $ 48.21 | $ 100,270 |
| Michigan | 990 | 0.24 | 2.79 | $ 24.47 | $ 50,900 |
| Florida | 810 | 0.09 | 1.08 | $ 21.39 | $ 44,480 |
| Indiana | 790 | 0.27 | 3.05 | $ 21.29 | $ 44,290 |
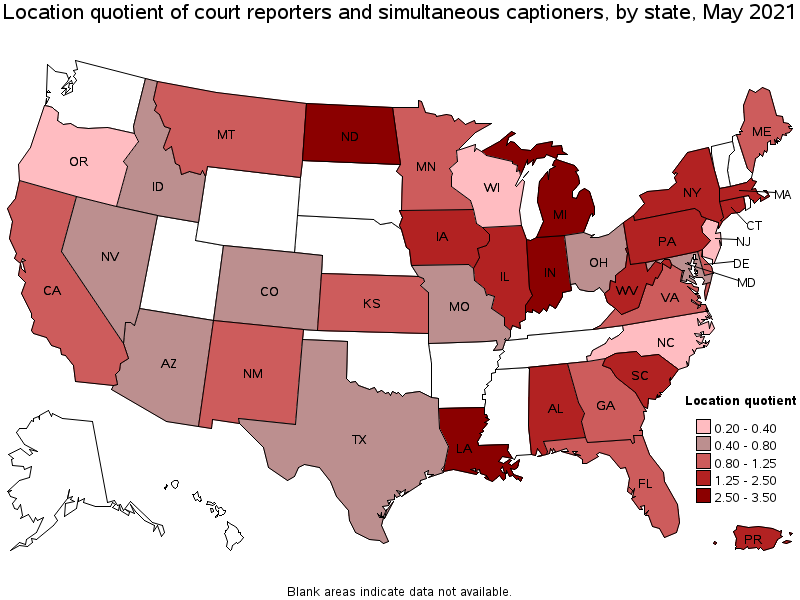
States with the highest concentration of jobs and location quotients in Court Reporters and Simultaneous Captioners:
| State | Employment (1) | Employment per thousand jobs | Location quotient (9) | Hourly mean wage | Annual mean wage (2) |
|---|---|---|---|---|---|
| Indiana | 790 | 0.27 | 3.05 | $ 21.29 | $ 44,290 |
| Michigan | 990 | 0.24 | 2.79 | $ 24.47 | $ 50,900 |
| North Dakota | 90 | 0.22 | 2.52 | $ 26.07 | $ 54,220 |
| Louisiana | 390 | 0.22 | 2.51 | $ 21.09 | $ 43,870 |
| Iowa | 220 | 0.15 | 1.69 | $ 37.06 | $ 77,090 |
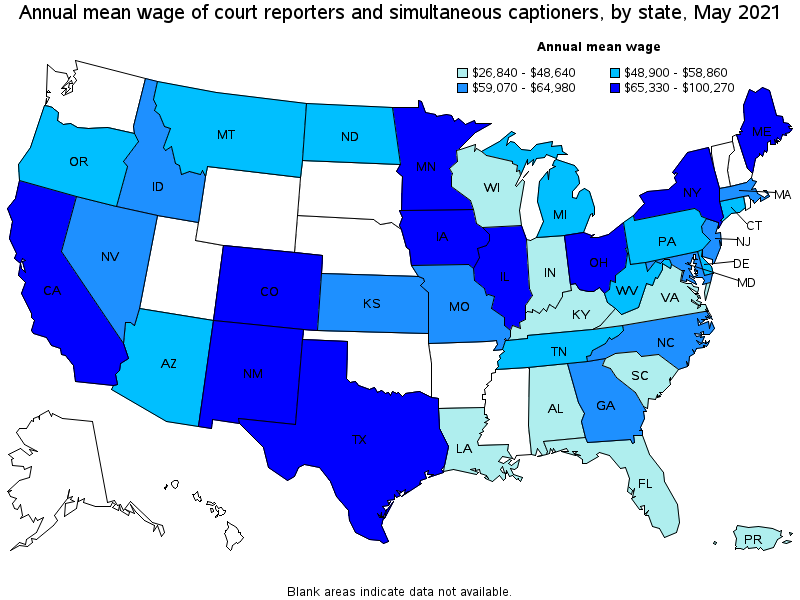
Top paying states for Court Reporters and Simultaneous Captioners:
| State | Employment (1) | Employment per thousand jobs | Location quotient (9) | Hourly mean wage | Annual mean wage (2) |
|---|---|---|---|---|---|
| New York | 1,250 | 0.14 | 1.64 | $ 48.21 | $ 100,270 |
| California | 1,400 | 0.08 | 0.97 | $ 40.25 | $ 83,720 |
| Texas | 620 | 0.05 | 0.58 | $ 39.16 | $ 81,460 |
| Iowa | 220 | 0.15 | 1.69 | $ 37.06 | $ 77,090 |
| Colorado | 120 | 0.04 | 0.50 | $ 36.74 | $ 76,410 |
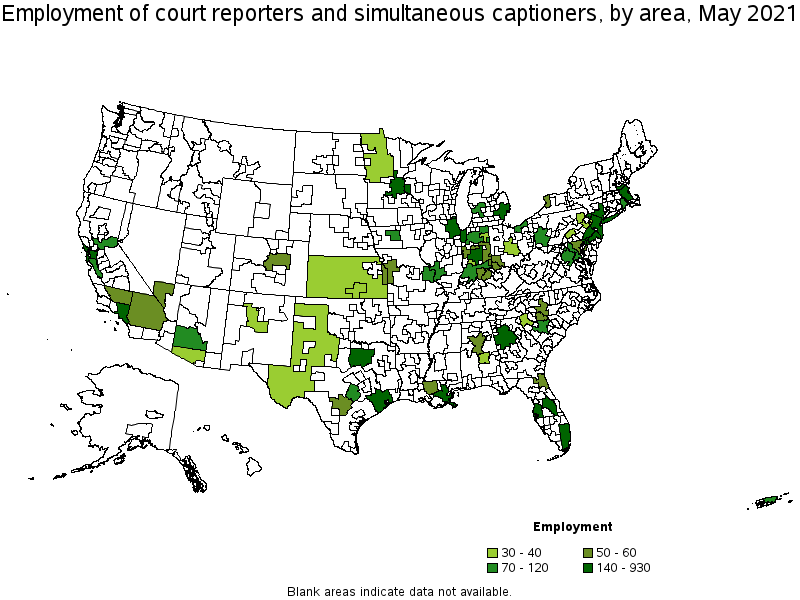
Metropolitan areas with the highest employment level in Court Reporters and Simultaneous Captioners:
| Metropolitan area | Employment (1) | Employment per thousand jobs | Location quotient (9) | Hourly mean wage | Annual mean wage (2) |
|---|---|---|---|---|---|
| New York-Newark-Jersey City, NY-NJ-PA | 930 | 0.11 | 1.23 | $ 46.33 | $ 96,370 |
| Chicago-Naperville-Elgin, IL-IN-WI | 470 | 0.11 | 1.27 | $ 33.07 | $ 68,780 |
| Detroit-Warren-Dearborn, MI | 430 | 0.24 | 2.74 | $ 26.33 | $ 54,760 |
| Los Angeles-Long Beach-Anaheim, CA | 430 | 0.07 | 0.86 | $ 32.09 | $ 66,740 |
| Boston-Cambridge-Nashua, MA-NH | 350 | 0.14 | 1.57 | $ 31.42 | $ 65,350 |
| San Francisco-Oakland-Hayward, CA | 320 | 0.14 | 1.63 | $ 52.84 | $ 109,910 |
| Philadelphia-Camden-Wilmington, PA-NJ-DE-MD | 250 | 0.09 | 1.06 | $ 28.86 | $ 60,020 |
| Miami-Fort Lauderdale-West Palm Beach, FL | 200 | 0.08 | 0.95 | $ 21.14 | $ 43,970 |
| Atlanta-Sandy Springs-Roswell, GA | 190 | 0.07 | 0.86 | $ 31.10 | $ 64,680 |
| New Orleans-Metairie, LA | 190 | 0.37 | 4.29 | $ 21.83 | $ 45,400 |
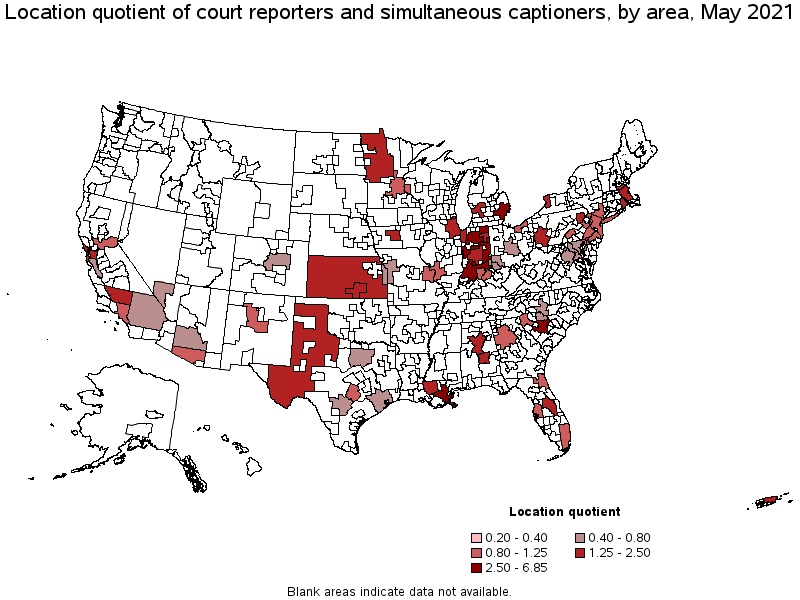
Metropolitan areas with the highest concentration of jobs and location quotients in Court Reporters and Simultaneous Captioners:
| Metropolitan area | Employment (1) | Employment per thousand jobs | Location quotient (9) | Hourly mean wage | Annual mean wage (2) |
|---|---|---|---|---|---|
| Bloomington, IN | 40 | 0.60 | 6.85 | $ 18.48 | $ 38,440 |
| New Orleans-Metairie, LA | 190 | 0.37 | 4.29 | $ 21.83 | $ 45,400 |
| Detroit-Warren-Dearborn, MI | 430 | 0.24 | 2.74 | $ 26.33 | $ 54,760 |
| Columbia, SC | 80 | 0.23 | 2.59 | $ 23.13 | $ 48,110 |
| Montgomery, AL | 30 | 0.21 | 2.42 | $ 19.89 | $ 41,380 |
| Grand Rapids-Wyoming, MI | 100 | 0.20 | 2.26 | $ 24.09 | $ 50,100 |
| Des Moines-West Des Moines, IA | 70 | 0.19 | 2.23 | $ 36.91 | $ 76,770 |
| Indianapolis-Carmel-Anderson, IN | 190 | 0.19 | 2.15 | $ 21.04 | $ 43,750 |
| Scranton--Wilkes-Barre--Hazleton, PA | 40 | 0.18 | 2.06 | $ 28.53 | $ 59,340 |
| Baton Rouge, LA | 60 | 0.17 | 1.94 | $ 22.03 | $ 45,830 |
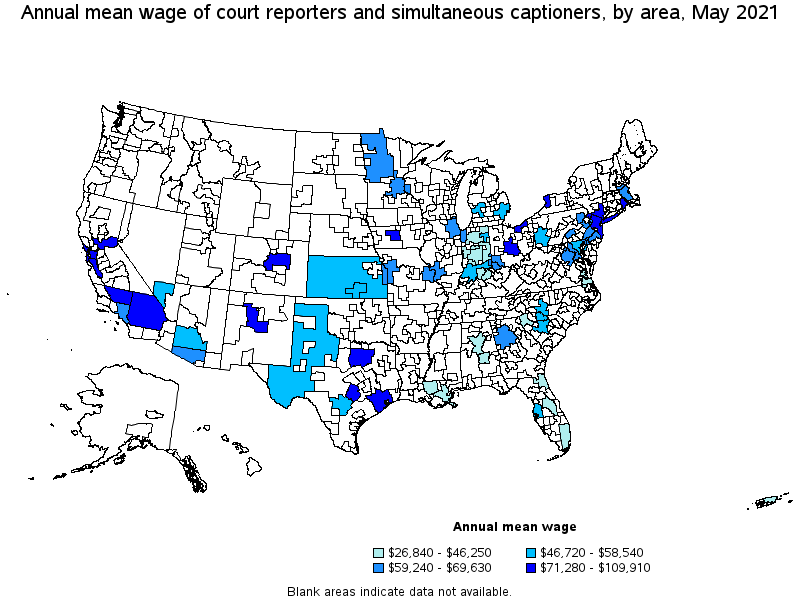
Top paying metropolitan areas for Court Reporters and Simultaneous Captioners:
| Metropolitan area | Employment (1) | Employment per thousand jobs | Location quotient (9) | Hourly mean wage | Annual mean wage (2) |
|---|---|---|---|---|---|
| San Francisco-Oakland-Hayward, CA | 320 | 0.14 | 1.63 | $ 52.84 | $ 109,910 |
| Houston-The Woodlands-Sugar Land, TX | 150 | 0.05 | 0.61 | $ 48.11 | $ 100,060 |
| San Jose-Sunnyvale-Santa Clara, CA | 70 | 0.06 | 0.73 | $ 47.66 | $ 99,120 |
| Dallas-Fort Worth-Arlington, TX | 160 | 0.05 | 0.53 | $ 46.63 | $ 96,990 |
| New York-Newark-Jersey City, NY-NJ-PA | 930 | 0.11 | 1.23 | $ 46.33 | $ 96,370 |
| Bakersfield, CA | 50 | 0.15 | 1.75 | $ 43.61 | $ 90,720 |
| Buffalo-Cheektowaga-Niagara Falls, NY | 50 | 0.11 | 1.25 | $ 38.47 | $ 80,020 |
| Providence-Warwick, RI-MA | 70 | 0.12 | 1.39 | $ 38.42 | $ 79,910 |
| Des Moines-West Des Moines, IA | 70 | 0.19 | 2.23 | $ 36.91 | $ 76,770 |
| Austin-Round Rock, TX | 80 | 0.08 | 0.91 | $ 36.66 | $ 76,240 |
Nonmetropolitan areas with the highest employment in Court Reporters and Simultaneous Captioners:
| Nonmetropolitan area | Employment (1) | Employment per thousand jobs | Location quotient (9) | Hourly mean wage | Annual mean wage (2) |
|---|---|---|---|---|---|
| Southern Indiana nonmetropolitan area | 80 | 0.41 | 4.74 | $ 22.81 | $ 47,440 |
| Northern Indiana nonmetropolitan area | 70 | 0.35 | 4.03 | $ 21.11 | $ 43,900 |
| Central Indiana nonmetropolitan area | 50 | 0.31 | 3.59 | $ 19.53 | $ 40,630 |
| Kansas nonmetropolitan area | 40 | 0.11 | 1.32 | $ 26.03 | $ 54,150 |
| Northwest Minnesota nonmetropolitan area | 30 | 0.18 | 2.01 | $ 33.48 | $ 69,630 |
Nonmetropolitan areas with the highest concentration of jobs and location quotients in Court Reporters and Simultaneous Captioners:
| Nonmetropolitan area | Employment (1) | Employment per thousand jobs | Location quotient (9) | Hourly mean wage | Annual mean wage (2) |
|---|---|---|---|---|---|
| Southern Indiana nonmetropolitan area | 80 | 0.41 | 4.74 | $ 22.81 | $ 47,440 |
| Northern Indiana nonmetropolitan area | 70 | 0.35 | 4.03 | $ 21.11 | $ 43,900 |
| Central Indiana nonmetropolitan area | 50 | 0.31 | 3.59 | $ 19.53 | $ 40,630 |
| Northwest Minnesota nonmetropolitan area | 30 | 0.18 | 2.01 | $ 33.48 | $ 69,630 |
| West Texas Region of Texas nonmetropolitan area | 30 | 0.16 | 1.87 | $ 24.18 | $ 50,300 |
Top paying nonmetropolitan areas for Court Reporters and Simultaneous Captioners:
| Nonmetropolitan area | Employment (1) | Employment per thousand jobs | Location quotient (9) | Hourly mean wage | Annual mean wage (2) |
|---|---|---|---|---|---|
| Northwest Minnesota nonmetropolitan area | 30 | 0.18 | 2.01 | $ 33.48 | $ 69,630 |
| Kansas nonmetropolitan area | 40 | 0.11 | 1.32 | $ 26.03 | $ 54,150 |
| West Texas Region of Texas nonmetropolitan area | 30 | 0.16 | 1.87 | $ 24.18 | $ 50,300 |
| Southern Indiana nonmetropolitan area | 80 | 0.41 | 4.74 | $ 22.81 | $ 47,440 |
| Northern Indiana nonmetropolitan area | 70 | 0.35 | 4.03 | $ 21.11 | $ 43,900 |
These estimates are calculated with data collected from employers in all industry sectors, all metropolitan and nonmetropolitan areas, and all states and the District of Columbia. The top employment and wage figures are provided above. The complete list is available in the downloadable XLS files.
The percentile wage estimate is the value of a wage below which a certain percent of workers fall. The median wage is the 50th percentile wage estimate—50 percent of workers earn less than the median and 50 percent of workers earn more than the median. More about percentile wages.
(1) Estimates for detailed occupations do not sum to the totals because the totals include occupations not shown separately. Estimates do not include self-employed workers.
(2) Annual wages have been calculated by multiplying the hourly mean wage by a "year-round, full-time" hours figure of 2,080 hours; for those occupations where there is not an hourly wage published, the annual wage has been directly calculated from the reported survey data.
(3) The relative standard error (RSE) is a measure of the reliability of a survey statistic. The smaller the relative standard error, the more precise the estimate.
(7) The value is less than .005 percent of industry employment.
(9) The location quotient is the ratio of the area concentration of occupational employment to the national average concentration. A location quotient greater than one indicates the occupation has a higher share of employment than average, and a location quotient less than one indicates the occupation is less prevalent in the area than average.
Other OEWS estimates and related information:
May 2021 National Occupational Employment and Wage Estimates
May 2021 State Occupational Employment and Wage Estimates
May 2021 Metropolitan and Nonmetropolitan Area Occupational Employment and Wage Estimates
May 2021 National Industry-Specific Occupational Employment and Wage Estimates
Last Modified Date: March 31, 2022