
An official website of the United States government
An official website of the United States government
The .gov means it's official.
Federal government websites often end in .gov or .mil. Before sharing sensitive information,
make sure you're on a federal government site.
The site is secure.
The
https:// ensures that you are connecting to the official website and that any
information you provide is encrypted and transmitted securely.
Assess, plan, or implement fitness programs that include exercise or physical activities such as those designed to improve cardiorespiratory function, body composition, muscular strength, muscular endurance, or flexibility. Excludes �Physical Therapists� (29-1123), �Athletic Trainers� (29-9091), and �Exercise Trainers and Group Fitness Instructors� (39-9031).
Employment estimate and mean wage estimates for Exercise Physiologists:
| Employment (1) | Employment RSE (3) |
Mean hourly wage |
Mean annual wage (2) |
Wage RSE (3) |
|---|---|---|---|---|
| 6,860 | 3.1 % | $ 25.98 | $ 54,030 | 1.1 % |
Percentile wage estimates for Exercise Physiologists:
| Percentile | 10% | 25% | 50% (Median) |
75% | 90% |
|---|---|---|---|---|---|
| Hourly Wage | $ 17.76 | $ 22.17 | $ 23.05 | $ 29.22 | $ 37.00 |
| Annual Wage (2) | $ 36,930 | $ 46,120 | $ 47,940 | $ 60,780 | $ 76,950 |
Industries with the highest published employment and wages for Exercise Physiologists are provided. For a list of all industries with employment in Exercise Physiologists, see the Create Customized Tables function.
Industries with the highest levels of employment in Exercise Physiologists:
| Industry | Employment (1) | Percent of industry employment | Hourly mean wage | Annual mean wage (2) |
|---|---|---|---|---|
| General Medical and Surgical Hospitals | 4,290 | 0.08 | $ 25.58 | $ 53,200 |
| Offices of Other Health Practitioners | 750 | 0.08 | $ 25.80 | $ 53,670 |
| Offices of Physicians | 430 | 0.02 | $ 24.12 | $ 50,180 |
| Federal Executive Branch (OEWS Designation) | 300 | 0.01 | $ 38.76 | $ 80,630 |
| Other Ambulatory Health Care Services | 190 | 0.06 | $ 19.31 | $ 40,160 |
Industries with the highest concentration of employment in Exercise Physiologists:
| Industry | Employment (1) | Percent of industry employment | Hourly mean wage | Annual mean wage (2) |
|---|---|---|---|---|
| Offices of Other Health Practitioners | 750 | 0.08 | $ 25.80 | $ 53,670 |
| General Medical and Surgical Hospitals | 4,290 | 0.08 | $ 25.58 | $ 53,200 |
| Other Ambulatory Health Care Services | 190 | 0.06 | $ 19.31 | $ 40,160 |
| Specialty (except Psychiatric and Substance Abuse) Hospitals | 140 | 0.05 | $ 26.06 | $ 54,210 |
| Offices of Physicians | 430 | 0.02 | $ 24.12 | $ 50,180 |
Top paying industries for Exercise Physiologists:
| Industry | Employment (1) | Percent of industry employment | Hourly mean wage | Annual mean wage (2) |
|---|---|---|---|---|
| Federal Executive Branch (OEWS Designation) | 300 | 0.01 | $ 38.76 | $ 80,630 |
| Colleges, Universities, and Professional Schools | 100 | (7) | $ 32.49 | $ 67,580 |
| Management of Companies and Enterprises | 30 | (7) | $ 27.56 | $ 57,330 |
| Outpatient Care Centers | 70 | 0.01 | $ 26.68 | $ 55,500 |
| Specialty (except Psychiatric and Substance Abuse) Hospitals | 140 | 0.05 | $ 26.06 | $ 54,210 |
States and areas with the highest published employment, location quotients, and wages for Exercise Physiologists are provided. For a list of all areas with employment in Exercise Physiologists, see the Create Customized Tables function.
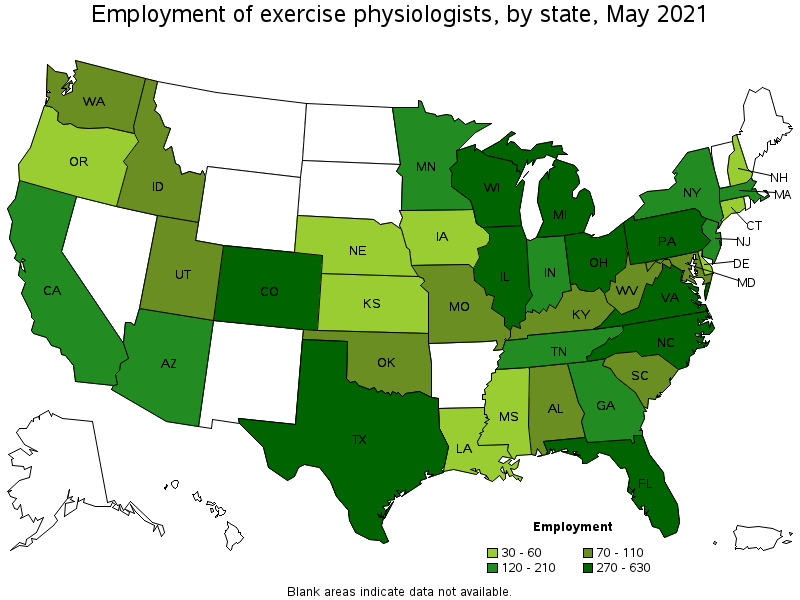
States with the highest employment level in Exercise Physiologists:
| State | Employment (1) | Employment per thousand jobs | Location quotient (9) | Hourly mean wage | Annual mean wage (2) |
|---|---|---|---|---|---|
| Texas | 630 | 0.05 | 1.07 | $ 24.37 | $ 50,690 |
| Michigan | 510 | 0.13 | 2.57 | $ 23.96 | $ 49,840 |
| Florida | 400 | 0.05 | 0.96 | $ 25.27 | $ 52,570 |
| Illinois | 370 | 0.07 | 1.36 | $ 26.72 | $ 55,580 |
| Colorado | 360 | 0.14 | 2.83 | (8) | (8) |
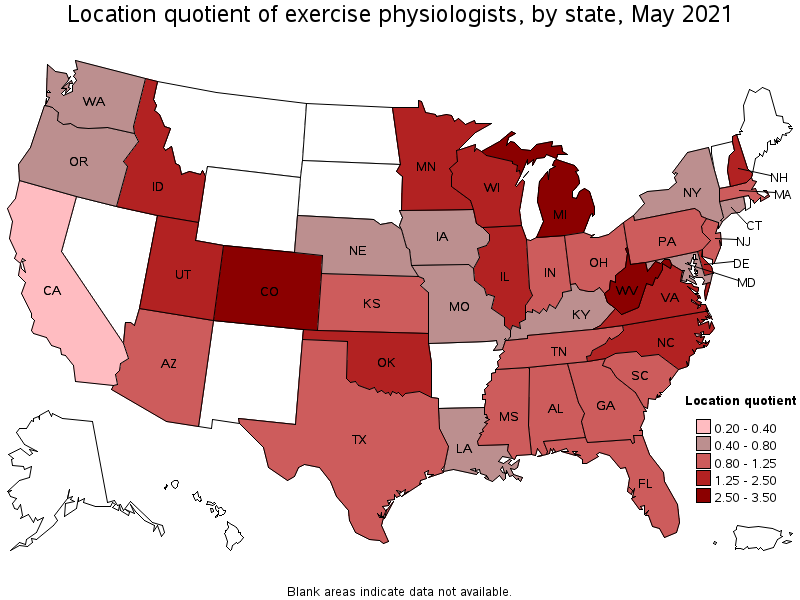
States with the highest concentration of jobs and location quotients in Exercise Physiologists:
| State | Employment (1) | Employment per thousand jobs | Location quotient (9) | Hourly mean wage | Annual mean wage (2) |
|---|---|---|---|---|---|
| Colorado | 360 | 0.14 | 2.83 | (8) | (8) |
| West Virginia | 80 | 0.13 | 2.65 | $ 25.57 | $ 53,190 |
| Michigan | 510 | 0.13 | 2.57 | $ 23.96 | $ 49,840 |
| Idaho | 80 | 0.11 | 2.28 | (8) | (8) |
| Wisconsin | 300 | 0.11 | 2.23 | $ 26.91 | $ 55,980 |
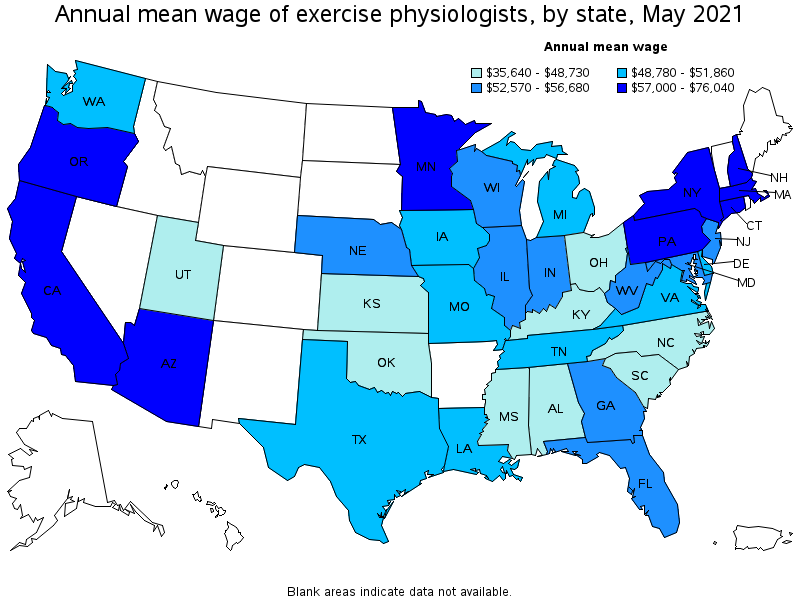
Top paying states for Exercise Physiologists:
| State | Employment (1) | Employment per thousand jobs | Location quotient (9) | Hourly mean wage | Annual mean wage (2) |
|---|---|---|---|---|---|
| California | 180 | 0.01 | 0.23 | $ 36.56 | $ 76,040 |
| New York | 180 | 0.02 | 0.42 | $ 31.46 | $ 65,450 |
| Connecticut | 60 | 0.04 | 0.77 | $ 30.66 | $ 63,770 |
| Minnesota | 180 | 0.06 | 1.32 | $ 29.98 | $ 62,350 |
| Massachusetts | 130 | 0.04 | 0.82 | $ 29.92 | $ 62,230 |
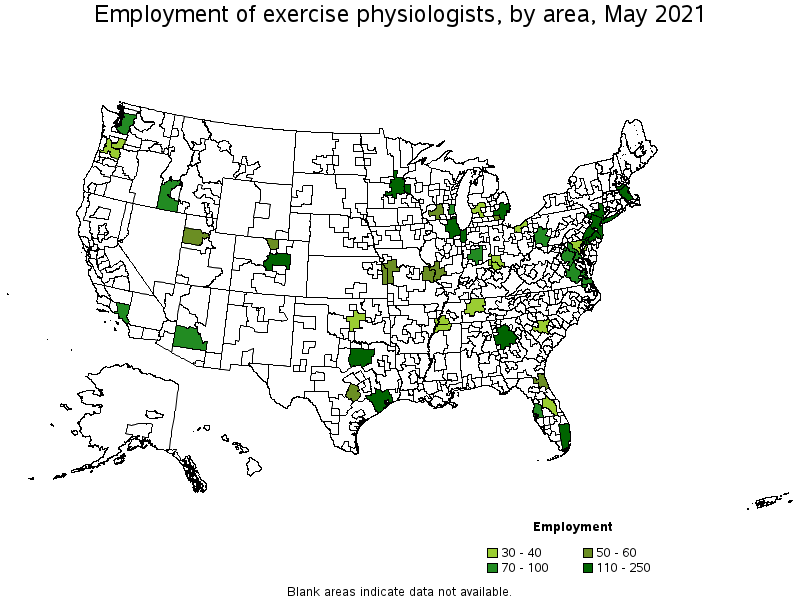
Metropolitan areas with the highest employment level in Exercise Physiologists:
| Metropolitan area | Employment (1) | Employment per thousand jobs | Location quotient (9) | Hourly mean wage | Annual mean wage (2) |
|---|---|---|---|---|---|
| Chicago-Naperville-Elgin, IL-IN-WI | 250 | 0.06 | 1.19 | $ 28.53 | $ 59,330 |
| Detroit-Warren-Dearborn, MI | 240 | 0.14 | 2.79 | $ 23.64 | $ 49,180 |
| New York-Newark-Jersey City, NY-NJ-PA | 240 | 0.03 | 0.57 | $ 31.23 | $ 64,960 |
| Dallas-Fort Worth-Arlington, TX | 210 | 0.06 | 1.17 | $ 24.26 | $ 50,460 |
| Philadelphia-Camden-Wilmington, PA-NJ-DE-MD | 180 | 0.07 | 1.43 | $ 29.49 | $ 61,340 |
| Atlanta-Sandy Springs-Roswell, GA | 140 | 0.05 | 1.10 | $ 26.30 | $ 54,700 |
| Houston-The Woodlands-Sugar Land, TX | 140 | 0.05 | 0.97 | $ 26.69 | $ 55,510 |
| Boston-Cambridge-Nashua, MA-NH | 120 | 0.05 | 0.94 | $ 30.03 | $ 62,460 |
| Denver-Aurora-Lakewood, CO | 120 | 0.08 | 1.62 | $ 26.41 | $ 54,930 |
| Miami-Fort Lauderdale-West Palm Beach, FL | 120 | 0.05 | 0.96 | $ 25.40 | $ 52,820 |
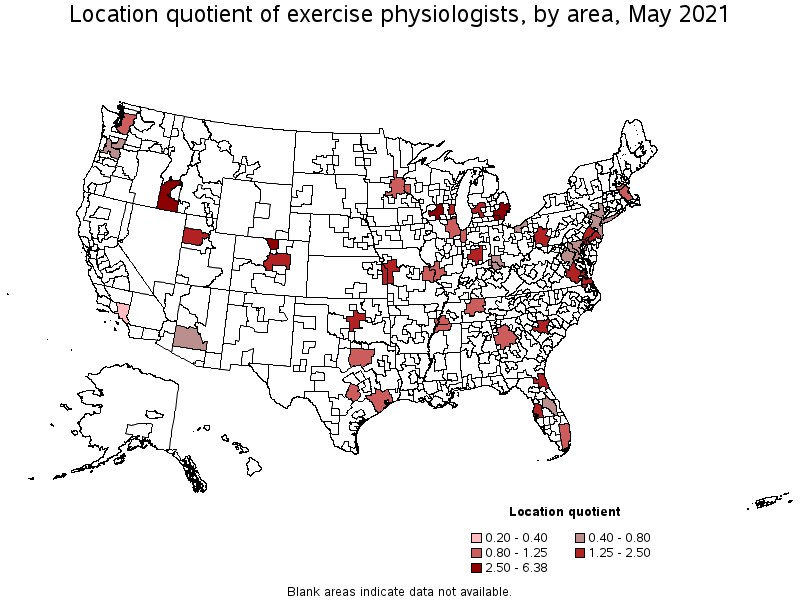
Metropolitan areas with the highest concentration of jobs and location quotients in Exercise Physiologists:
| Metropolitan area | Employment (1) | Employment per thousand jobs | Location quotient (9) | Hourly mean wage | Annual mean wage (2) |
|---|---|---|---|---|---|
| Fort Collins, CO | 50 | 0.31 | 6.38 | $ 28.57 | $ 59,430 |
| Ann Arbor, MI | 60 | 0.28 | 5.77 | $ 25.13 | $ 52,260 |
| Boise City, ID | 70 | 0.19 | 3.99 | (8) | (8) |
| Detroit-Warren-Dearborn, MI | 240 | 0.14 | 2.79 | $ 23.64 | $ 49,180 |
| Madison, WI | 50 | 0.13 | 2.64 | $ 27.87 | $ 57,960 |
| Virginia Beach-Norfolk-Newport News, VA-NC | 80 | 0.12 | 2.37 | $ 23.52 | $ 48,930 |
| Milwaukee-Waukesha-West Allis, WI | 90 | 0.11 | 2.27 | $ 26.32 | $ 54,750 |
| Columbia, SC | 40 | 0.11 | 2.27 | $ 23.48 | $ 48,830 |
| Richmond, VA | 70 | 0.11 | 2.20 | $ 28.03 | $ 58,300 |
| Jacksonville, FL | 60 | 0.08 | 1.73 | $ 23.01 | $ 47,850 |
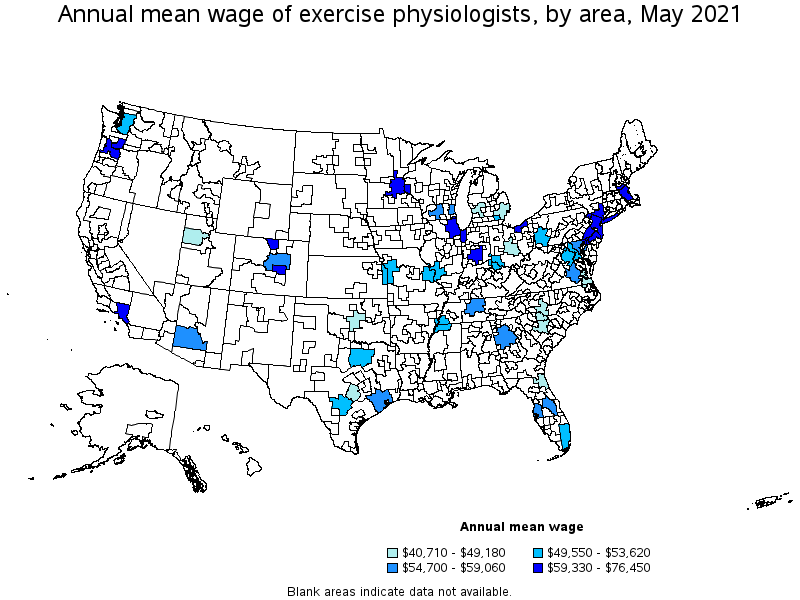
Top paying metropolitan areas for Exercise Physiologists:
| Metropolitan area | Employment (1) | Employment per thousand jobs | Location quotient (9) | Hourly mean wage | Annual mean wage (2) |
|---|---|---|---|---|---|
| Los Angeles-Long Beach-Anaheim, CA | 80 | 0.01 | 0.29 | $ 36.76 | $ 76,450 |
| New York-Newark-Jersey City, NY-NJ-PA | 240 | 0.03 | 0.57 | $ 31.23 | $ 64,960 |
| Colorado Springs, CO | (8) | (8) | (8) | $ 30.53 | $ 63,500 |
| Minneapolis-St. Paul-Bloomington, MN-WI | 110 | 0.06 | 1.20 | $ 30.50 | $ 63,440 |
| Boston-Cambridge-Nashua, MA-NH | 120 | 0.05 | 0.94 | $ 30.03 | $ 62,460 |
| Indianapolis-Carmel-Anderson, IN | 70 | 0.07 | 1.35 | $ 29.84 | $ 62,060 |
| Philadelphia-Camden-Wilmington, PA-NJ-DE-MD | 180 | 0.07 | 1.43 | $ 29.49 | $ 61,340 |
| Portland-Vancouver-Hillsboro, OR-WA | 40 | 0.04 | 0.73 | $ 29.34 | $ 61,020 |
| Cleveland-Elyria, OH | 40 | 0.04 | 0.79 | $ 28.94 | $ 60,200 |
| Fort Collins, CO | 50 | 0.31 | 6.38 | $ 28.57 | $ 59,430 |
These estimates are calculated with data collected from employers in all industry sectors, all metropolitan and nonmetropolitan areas, and all states and the District of Columbia. The top employment and wage figures are provided above. The complete list is available in the downloadable XLS files.
The percentile wage estimate is the value of a wage below which a certain percent of workers fall. The median wage is the 50th percentile wage estimate—50 percent of workers earn less than the median and 50 percent of workers earn more than the median. More about percentile wages.
(1) Estimates for detailed occupations do not sum to the totals because the totals include occupations not shown separately. Estimates do not include self-employed workers.
(2) Annual wages have been calculated by multiplying the hourly mean wage by a "year-round, full-time" hours figure of 2,080 hours; for those occupations where there is not an hourly wage published, the annual wage has been directly calculated from the reported survey data.
(3) The relative standard error (RSE) is a measure of the reliability of a survey statistic. The smaller the relative standard error, the more precise the estimate.
(7) The value is less than .005 percent of industry employment.
(8) Estimate not released.
(9) The location quotient is the ratio of the area concentration of occupational employment to the national average concentration. A location quotient greater than one indicates the occupation has a higher share of employment than average, and a location quotient less than one indicates the occupation is less prevalent in the area than average.
Other OEWS estimates and related information:
May 2021 National Occupational Employment and Wage Estimates
May 2021 State Occupational Employment and Wage Estimates
May 2021 Metropolitan and Nonmetropolitan Area Occupational Employment and Wage Estimates
May 2021 National Industry-Specific Occupational Employment and Wage Estimates
Last Modified Date: March 31, 2022