
An official website of the United States government
An official website of the United States government
The .gov means it's official.
Federal government websites often end in .gov or .mil. Before sharing sensitive information,
make sure you're on a federal government site.
The site is secure.
The
https:// ensures that you are connecting to the official website and that any
information you provide is encrypted and transmitted securely.
Operate Magnetic Resonance Imaging (MRI) scanners. Monitor patient safety and comfort, and view images of area being scanned to ensure quality of pictures. May administer gadolinium contrast dosage intravenously. May interview patient, explain MRI procedures, and position patient on examining table. May enter into the computer data such as patient history, anatomical area to be scanned, orientation specified, and position of entry.
Employment estimate and mean wage estimates for Magnetic Resonance Imaging Technologists:
| Employment (1) | Employment RSE (3) |
Mean hourly wage |
Mean annual wage (2) |
Wage RSE (3) |
|---|---|---|---|---|
| 38,070 | 1.8 % | $ 37.41 | $ 77,820 | 0.4 % |
Percentile wage estimates for Magnetic Resonance Imaging Technologists:
| Percentile | 10% | 25% | 50% (Median) |
75% | 90% |
|---|---|---|---|---|---|
| Hourly Wage | $ 28.42 | $ 29.85 | $ 37.19 | $ 43.30 | $ 48.50 |
| Annual Wage (2) | $ 59,110 | $ 62,090 | $ 77,360 | $ 90,050 | $ 100,870 |
Industries with the highest published employment and wages for Magnetic Resonance Imaging Technologists are provided. For a list of all industries with employment in Magnetic Resonance Imaging Technologists, see the Create Customized Tables function.
Industries with the highest levels of employment in Magnetic Resonance Imaging Technologists:
| Industry | Employment (1) | Percent of industry employment | Hourly mean wage | Annual mean wage (2) |
|---|---|---|---|---|
| General Medical and Surgical Hospitals | 22,750 | 0.41 | $ 37.18 | $ 77,340 |
| Medical and Diagnostic Laboratories | 6,980 | 2.37 | $ 37.49 | $ 77,970 |
| Offices of Physicians | 5,750 | 0.21 | $ 35.60 | $ 74,040 |
| Outpatient Care Centers | 1,030 | 0.10 | $ 52.15 | $ 108,470 |
| Specialty (except Psychiatric and Substance Abuse) Hospitals | 510 | 0.19 | $ 42.33 | $ 88,050 |
Industries with the highest concentration of employment in Magnetic Resonance Imaging Technologists:
| Industry | Employment (1) | Percent of industry employment | Hourly mean wage | Annual mean wage (2) |
|---|---|---|---|---|
| Medical and Diagnostic Laboratories | 6,980 | 2.37 | $ 37.49 | $ 77,970 |
| General Medical and Surgical Hospitals | 22,750 | 0.41 | $ 37.18 | $ 77,340 |
| Offices of Physicians | 5,750 | 0.21 | $ 35.60 | $ 74,040 |
| Specialty (except Psychiatric and Substance Abuse) Hospitals | 510 | 0.19 | $ 42.33 | $ 88,050 |
| Outpatient Care Centers | 1,030 | 0.10 | $ 52.15 | $ 108,470 |
Top paying industries for Magnetic Resonance Imaging Technologists:
| Industry | Employment (1) | Percent of industry employment | Hourly mean wage | Annual mean wage (2) |
|---|---|---|---|---|
| Outpatient Care Centers | 1,030 | 0.10 | $ 52.15 | $ 108,470 |
| Colleges, Universities, and Professional Schools | 270 | 0.01 | $ 44.06 | $ 91,650 |
| Specialty (except Psychiatric and Substance Abuse) Hospitals | 510 | 0.19 | $ 42.33 | $ 88,050 |
| Office Administrative Services | (8) | (8) | $ 40.63 | $ 84,510 |
| Medical and Diagnostic Laboratories | 6,980 | 2.37 | $ 37.49 | $ 77,970 |
States and areas with the highest published employment, location quotients, and wages for Magnetic Resonance Imaging Technologists are provided. For a list of all areas with employment in Magnetic Resonance Imaging Technologists, see the Create Customized Tables function.
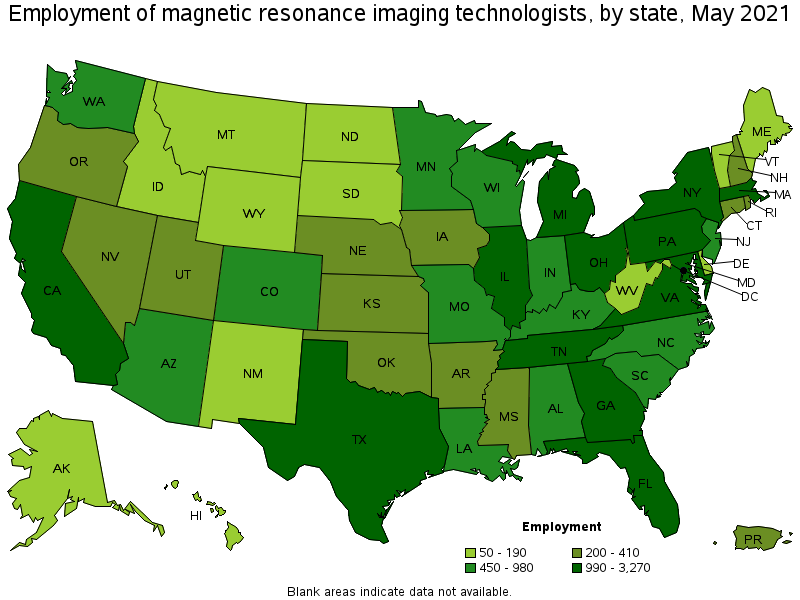
States with the highest employment level in Magnetic Resonance Imaging Technologists:
| State | Employment (1) | Employment per thousand jobs | Location quotient (9) | Hourly mean wage | Annual mean wage (2) |
|---|---|---|---|---|---|
| Florida | 3,270 | 0.38 | 1.41 | $ 32.50 | $ 67,590 |
| Texas | 2,690 | 0.22 | 0.81 | $ 37.68 | $ 78,380 |
| Illinois | 2,560 | 0.46 | 1.69 | $ 37.05 | $ 77,060 |
| California | 2,470 | 0.15 | 0.55 | $ 52.20 | $ 108,580 |
| New York | 2,230 | 0.26 | 0.95 | $ 42.84 | $ 89,110 |
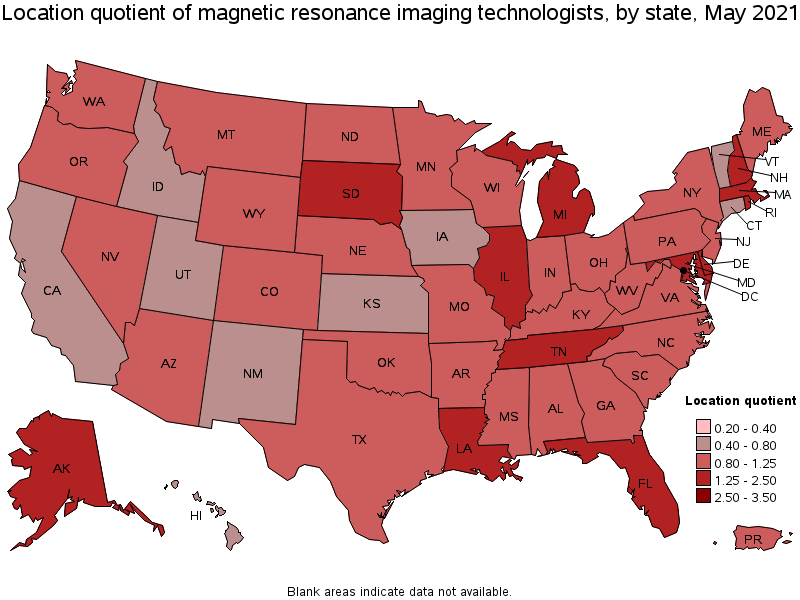
States with the highest concentration of jobs and location quotients in Magnetic Resonance Imaging Technologists:
| State | Employment (1) | Employment per thousand jobs | Location quotient (9) | Hourly mean wage | Annual mean wage (2) |
|---|---|---|---|---|---|
| Illinois | 2,560 | 0.46 | 1.69 | $ 37.05 | $ 77,060 |
| Rhode Island | 200 | 0.45 | 1.65 | $ 42.21 | $ 87,790 |
| Delaware | 190 | 0.43 | 1.58 | $ 37.05 | $ 77,070 |
| Louisiana | 760 | 0.42 | 1.56 | $ 28.72 | $ 59,740 |
| Massachusetts | 1,400 | 0.41 | 1.53 | $ 42.33 | $ 88,040 |
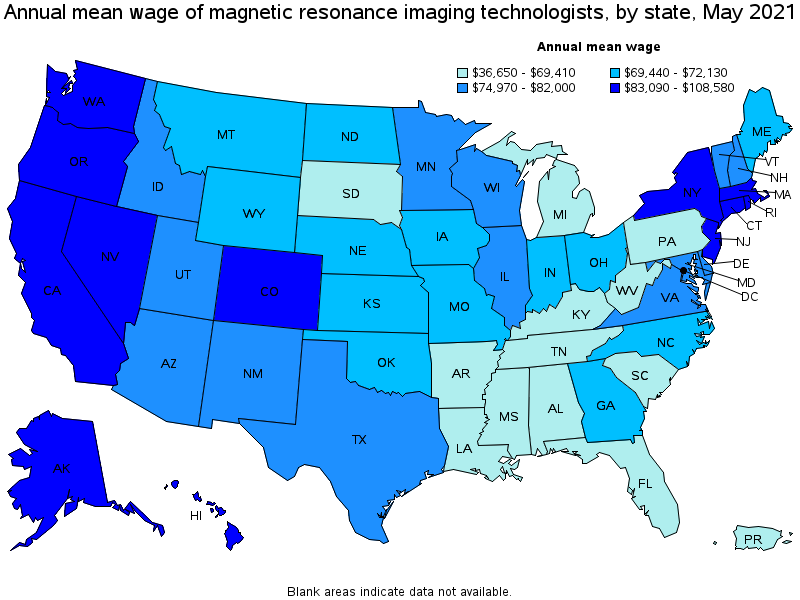
Top paying states for Magnetic Resonance Imaging Technologists:
| State | Employment (1) | Employment per thousand jobs | Location quotient (9) | Hourly mean wage | Annual mean wage (2) |
|---|---|---|---|---|---|
| California | 2,470 | 0.15 | 0.55 | $ 52.20 | $ 108,580 |
| Alaska | 110 | 0.36 | 1.34 | $ 50.02 | $ 104,040 |
| Hawaii | 100 | 0.19 | 0.70 | $ 48.90 | $ 101,700 |
| Washington | 700 | 0.22 | 0.81 | $ 45.75 | $ 95,160 |
| Oregon | 410 | 0.22 | 0.83 | $ 44.62 | $ 92,820 |
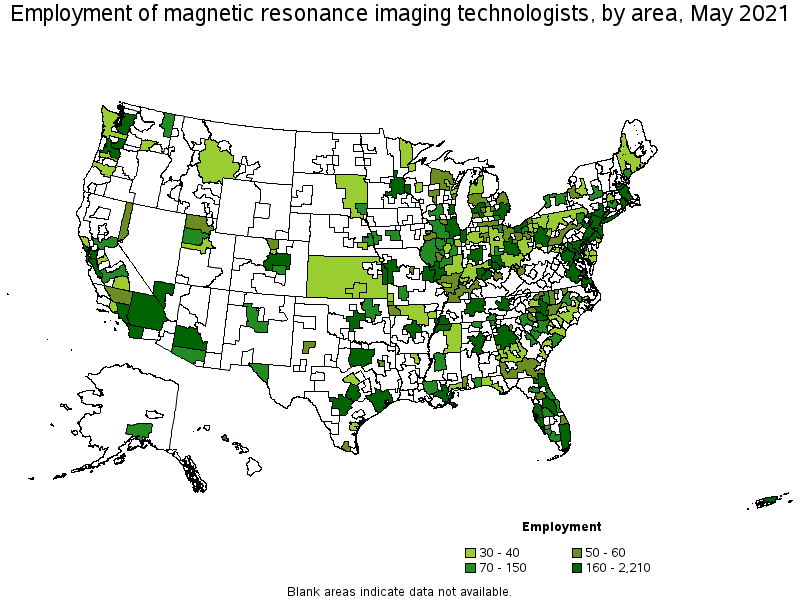
Metropolitan areas with the highest employment level in Magnetic Resonance Imaging Technologists:
| Metropolitan area | Employment (1) | Employment per thousand jobs | Location quotient (9) | Hourly mean wage | Annual mean wage (2) |
|---|---|---|---|---|---|
| New York-Newark-Jersey City, NY-NJ-PA | 2,210 | 0.26 | 0.94 | $ 44.79 | $ 93,150 |
| Chicago-Naperville-Elgin, IL-IN-WI | 1,870 | 0.44 | 1.63 | $ 38.63 | $ 80,350 |
| Boston-Cambridge-Nashua, MA-NH | 1,170 | 0.45 | 1.67 | $ 42.24 | $ 87,860 |
| Los Angeles-Long Beach-Anaheim, CA | 910 | 0.16 | 0.59 | $ 49.34 | $ 102,620 |
| Miami-Fort Lauderdale-West Palm Beach, FL | 910 | 0.37 | 1.37 | $ 34.47 | $ 71,710 |
| Atlanta-Sandy Springs-Roswell, GA | 900 | 0.35 | 1.28 | $ 36.39 | $ 75,680 |
| Washington-Arlington-Alexandria, DC-VA-MD-WV | 890 | 0.30 | 1.13 | $ 41.74 | $ 86,820 |
| Houston-The Woodlands-Sugar Land, TX | 840 | 0.29 | 1.07 | $ 38.51 | $ 80,090 |
| Philadelphia-Camden-Wilmington, PA-NJ-DE-MD | 840 | 0.32 | 1.17 | $ 37.29 | $ 77,550 |
| Dallas-Fort Worth-Arlington, TX | 790 | 0.22 | 0.81 | $ 40.12 | $ 83,450 |
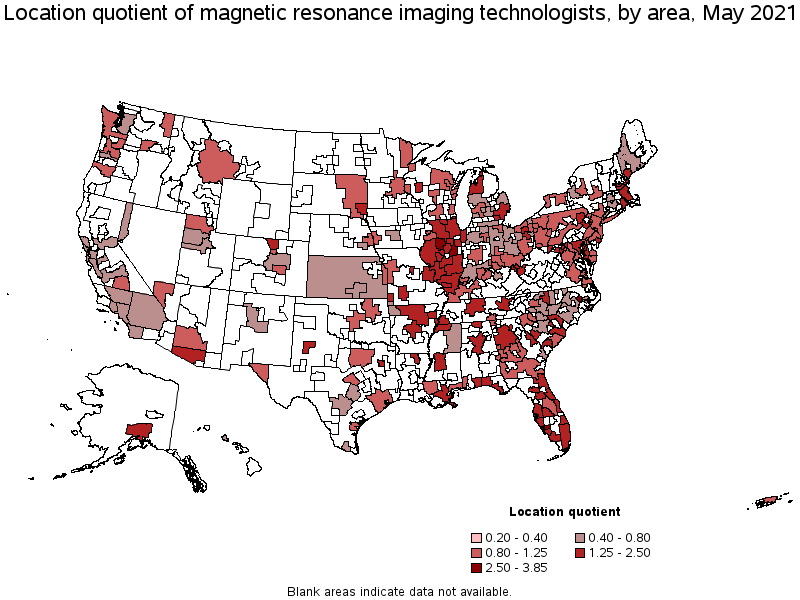
Metropolitan areas with the highest concentration of jobs and location quotients in Magnetic Resonance Imaging Technologists:
| Metropolitan area | Employment (1) | Employment per thousand jobs | Location quotient (9) | Hourly mean wage | Annual mean wage (2) |
|---|---|---|---|---|---|
| Punta Gorda, FL | 50 | 1.04 | 3.85 | $ 28.43 | $ 59,130 |
| Greenville, NC | 70 | 0.90 | 3.34 | $ 28.64 | $ 59,570 |
| Peoria, IL | 120 | 0.77 | 2.83 | $ 32.69 | $ 67,980 |
| Champaign-Urbana, IL | 70 | 0.72 | 2.68 | $ 36.02 | $ 74,920 |
| Ann Arbor, MI | 130 | 0.67 | 2.47 | $ 34.37 | $ 71,500 |
| New Orleans-Metairie, LA | 340 | 0.67 | 2.46 | $ 30.20 | $ 62,810 |
| Springfield, IL | 60 | 0.66 | 2.45 | $ 34.53 | $ 71,820 |
| Carbondale-Marion, IL | 30 | 0.64 | 2.39 | $ 29.62 | $ 61,610 |
| Manchester, NH | 70 | 0.64 | 2.37 | $ 40.97 | $ 85,210 |
| Sioux Falls, SD | 100 | 0.64 | 2.37 | $ 28.44 | $ 59,160 |
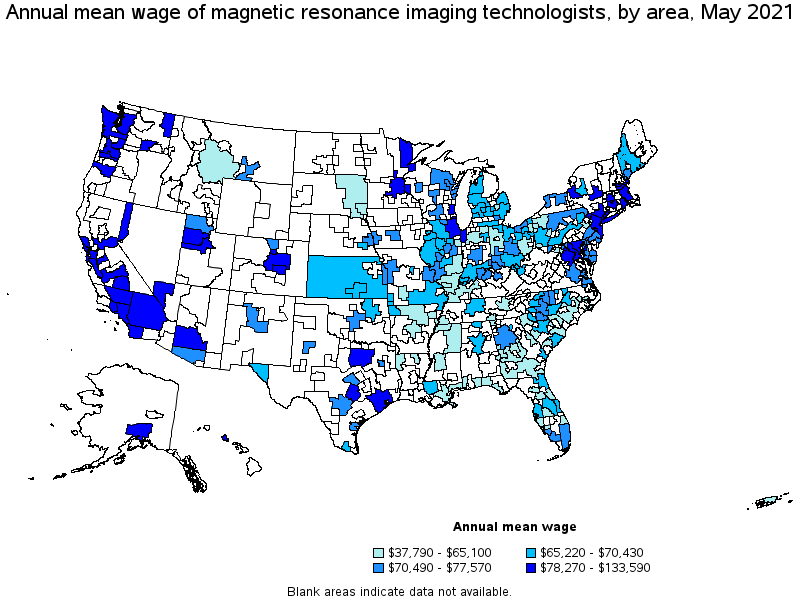
Top paying metropolitan areas for Magnetic Resonance Imaging Technologists:
| Metropolitan area | Employment (1) | Employment per thousand jobs | Location quotient (9) | Hourly mean wage | Annual mean wage (2) |
|---|---|---|---|---|---|
| San Jose-Sunnyvale-Santa Clara, CA | 160 | 0.15 | 0.56 | $ 64.23 | $ 133,590 |
| San Francisco-Oakland-Hayward, CA | 330 | 0.15 | 0.54 | $ 61.50 | $ 127,930 |
| Sacramento--Roseville--Arden-Arcade, CA | 140 | 0.14 | 0.53 | $ 57.96 | $ 120,550 |
| Santa Rosa, CA | 40 | 0.19 | 0.70 | $ 57.59 | $ 119,780 |
| San Diego-Carlsbad, CA | 210 | 0.15 | 0.55 | $ 52.18 | $ 108,540 |
| Modesto, CA | 30 | 0.19 | 0.70 | $ 50.75 | $ 105,550 |
| Seattle-Tacoma-Bellevue, WA | 310 | 0.16 | 0.61 | $ 50.50 | $ 105,040 |
| Anchorage, AK | 90 | 0.55 | 2.04 | $ 50.39 | $ 104,800 |
| Urban Honolulu, HI | 70 | 0.18 | 0.68 | $ 50.32 | $ 104,660 |
| Fresno, CA | 70 | 0.17 | 0.65 | $ 49.61 | $ 103,180 |
Nonmetropolitan areas with the highest employment in Magnetic Resonance Imaging Technologists:
| Nonmetropolitan area | Employment (1) | Employment per thousand jobs | Location quotient (9) | Hourly mean wage | Annual mean wage (2) |
|---|---|---|---|---|---|
| West Central Illinois nonmetropolitan area | 70 | 0.44 | 1.63 | $ 32.51 | $ 67,620 |
| Northwest Illinois nonmetropolitan area | 70 | 0.54 | 1.99 | $ 32.18 | $ 66,930 |
| Northeastern Wisconsin nonmetropolitan area | 60 | 0.33 | 1.23 | $ 35.32 | $ 73,470 |
| North Northeastern Ohio nonmetropolitan area (noncontiguous) | 60 | 0.19 | 0.69 | $ 32.11 | $ 66,780 |
| South Georgia nonmetropolitan area | 60 | 0.32 | 1.17 | $ 28.92 | $ 60,160 |
Nonmetropolitan areas with the highest concentration of jobs and location quotients in Magnetic Resonance Imaging Technologists:
| Nonmetropolitan area | Employment (1) | Employment per thousand jobs | Location quotient (9) | Hourly mean wage | Annual mean wage (2) |
|---|---|---|---|---|---|
| South Illinois nonmetropolitan area | 60 | 0.67 | 2.49 | $ 31.18 | $ 64,850 |
| Maryland nonmetropolitan area | 30 | 0.57 | 2.11 | $ 34.19 | $ 71,120 |
| Northwest Illinois nonmetropolitan area | 70 | 0.54 | 1.99 | $ 32.18 | $ 66,930 |
| West Central Illinois nonmetropolitan area | 70 | 0.44 | 1.63 | $ 32.51 | $ 67,620 |
| East Central Illinois nonmetropolitan area | 40 | 0.39 | 1.45 | $ 29.66 | $ 61,680 |
Top paying nonmetropolitan areas for Magnetic Resonance Imaging Technologists:
| Nonmetropolitan area | Employment (1) | Employment per thousand jobs | Location quotient (9) | Hourly mean wage | Annual mean wage (2) |
|---|---|---|---|---|---|
| Western Washington nonmetropolitan area | 30 | 0.26 | 0.98 | $ 43.18 | $ 89,810 |
| Northeastern Wisconsin nonmetropolitan area | 60 | 0.33 | 1.23 | $ 35.32 | $ 73,470 |
| Maryland nonmetropolitan area | 30 | 0.57 | 2.11 | $ 34.19 | $ 71,120 |
| Northern Pennsylvania nonmetropolitan area | 40 | 0.27 | 0.99 | $ 33.99 | $ 70,700 |
| Southwest Maine nonmetropolitan area | 40 | 0.21 | 0.79 | $ 33.72 | $ 70,140 |
These estimates are calculated with data collected from employers in all industry sectors, all metropolitan and nonmetropolitan areas, and all states and the District of Columbia. The top employment and wage figures are provided above. The complete list is available in the downloadable XLS files.
The percentile wage estimate is the value of a wage below which a certain percent of workers fall. The median wage is the 50th percentile wage estimate—50 percent of workers earn less than the median and 50 percent of workers earn more than the median. More about percentile wages.
(1) Estimates for detailed occupations do not sum to the totals because the totals include occupations not shown separately. Estimates do not include self-employed workers.
(2) Annual wages have been calculated by multiplying the hourly mean wage by a "year-round, full-time" hours figure of 2,080 hours; for those occupations where there is not an hourly wage published, the annual wage has been directly calculated from the reported survey data.
(3) The relative standard error (RSE) is a measure of the reliability of a survey statistic. The smaller the relative standard error, the more precise the estimate.
(8) Estimate not released.
(9) The location quotient is the ratio of the area concentration of occupational employment to the national average concentration. A location quotient greater than one indicates the occupation has a higher share of employment than average, and a location quotient less than one indicates the occupation is less prevalent in the area than average.
Other OEWS estimates and related information:
May 2021 National Occupational Employment and Wage Estimates
May 2021 State Occupational Employment and Wage Estimates
May 2021 Metropolitan and Nonmetropolitan Area Occupational Employment and Wage Estimates
May 2021 National Industry-Specific Occupational Employment and Wage Estimates
Last Modified Date: March 31, 2022