
An official website of the United States government
An official website of the United States government
The .gov means it's official.
Federal government websites often end in .gov or .mil. Before sharing sensitive information,
make sure you're on a federal government site.
The site is secure.
The
https:// ensures that you are connecting to the official website and that any
information you provide is encrypted and transmitted securely.
Assess injuries and illnesses and administer basic emergency medical care. May transport injured or sick persons to medical facilities. Excludes �Paramedics� (29-2043), �Firefighters� (33-2011), and �Ambulance Drivers and Attendants, Except Emergency Medical Technicians� (53-3011).
Employment estimate and mean wage estimates for Emergency Medical Technicians:
| Employment (1) | Employment RSE (3) |
Mean hourly wage |
Mean annual wage (2) |
Wage RSE (3) |
|---|---|---|---|---|
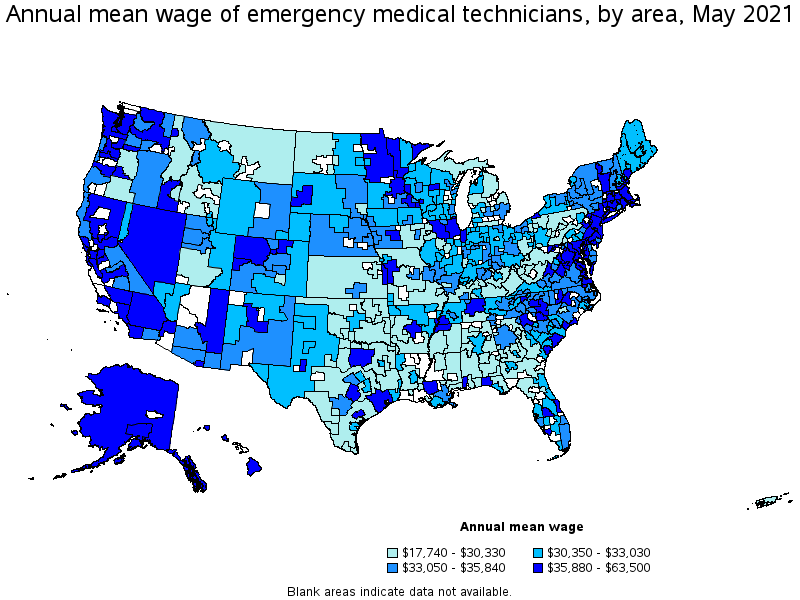
| 161,400 | 1.1 % | $ 17.64 | $ 36,690 | 0.4 % |
Percentile wage estimates for Emergency Medical Technicians:
| Percentile | 10% | 25% | 50% (Median) |
75% | 90% |
|---|---|---|---|---|---|
| Hourly Wage | $ 11.36 | $ 13.91 | $ 17.05 | $ 18.11 | $ 22.88 |
| Annual Wage (2) | $ 23,620 | $ 28,920 | $ 35,470 | $ 37,660 | $ 47,580 |
Industries with the highest published employment and wages for Emergency Medical Technicians are provided. For a list of all industries with employment in Emergency Medical Technicians, see the Create Customized Tables function.
Industries with the highest levels of employment in Emergency Medical Technicians:
| Industry | Employment (1) | Percent of industry employment | Hourly mean wage | Annual mean wage (2) |
|---|---|---|---|---|
| Other Ambulatory Health Care Services | 76,960 | 24.69 | $ 15.83 | $ 32,930 |
| Local Government, excluding schools and hospitals (OEWS Designation) | 39,650 | 0.74 | $ 19.95 | $ 41,500 |
| General Medical and Surgical Hospitals | 31,270 | 0.56 | $ 18.26 | $ 37,980 |
| Outpatient Care Centers | 3,250 | 0.33 | $ 23.95 | $ 49,820 |
| Other Support Services | 2,640 | 0.94 | $ 16.22 | $ 33,740 |
Industries with the highest concentration of employment in Emergency Medical Technicians:
| Industry | Employment (1) | Percent of industry employment | Hourly mean wage | Annual mean wage (2) |
|---|---|---|---|---|
| Other Ambulatory Health Care Services | 76,960 | 24.69 | $ 15.83 | $ 32,930 |
| Other Support Services | 2,640 | 0.94 | $ 16.22 | $ 33,740 |
| Local Government, excluding schools and hospitals (OEWS Designation) | 39,650 | 0.74 | $ 19.95 | $ 41,500 |
| General Medical and Surgical Hospitals | 31,270 | 0.56 | $ 18.26 | $ 37,980 |
| Other Transit and Ground Passenger Transportation | 380 | 0.45 | $ 15.51 | $ 32,250 |
Top paying industries for Emergency Medical Technicians:
| Industry | Employment (1) | Percent of industry employment | Hourly mean wage | Annual mean wage (2) |
|---|---|---|---|---|
| Scientific Research and Development Services | 30 | (7) | $ 37.60 | $ 78,200 |
| Medical and Diagnostic Laboratories | 170 | 0.06 | $ 27.98 | $ 58,200 |
| State Government, excluding schools and hospitals (OEWS Designation) | 250 | 0.01 | $ 26.01 | $ 54,090 |
| Outpatient Care Centers | 3,250 | 0.33 | $ 23.95 | $ 49,820 |
| Warehousing and Storage | 30 | (7) | $ 23.90 | $ 49,710 |
States and areas with the highest published employment, location quotients, and wages for Emergency Medical Technicians are provided. For a list of all areas with employment in Emergency Medical Technicians, see the Create Customized Tables function.
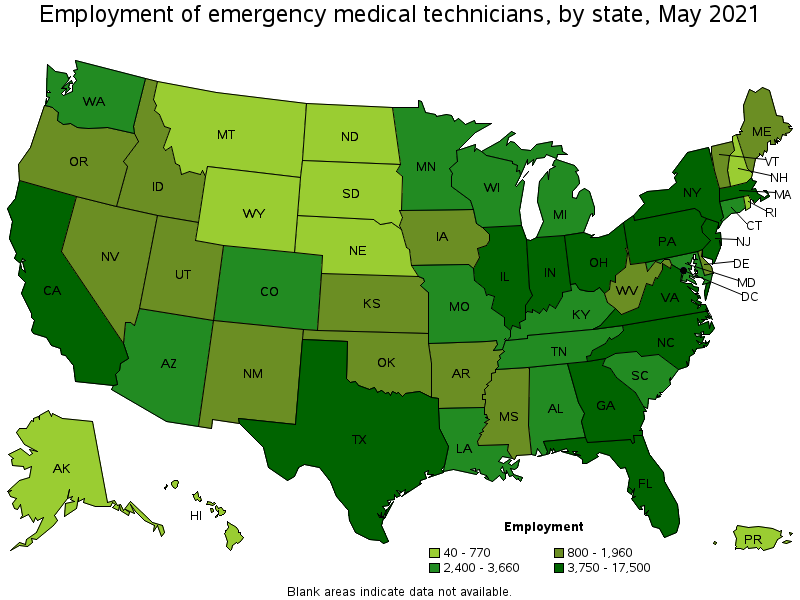
States with the highest employment level in Emergency Medical Technicians:
| State | Employment (1) | Employment per thousand jobs | Location quotient (9) | Hourly mean wage | Annual mean wage (2) |
|---|---|---|---|---|---|
| California | 17,500 | 1.06 | 0.92 | $ 20.40 | $ 42,420 |
| New York | 12,030 | 1.39 | 1.21 | $ 19.77 | $ 41,120 |
| Texas | 10,440 | 0.85 | 0.75 | $ 16.38 | $ 34,070 |
| Pennsylvania | 8,210 | 1.47 | 1.28 | $ 16.08 | $ 33,450 |
| Illinois | 8,000 | 1.42 | 1.24 | $ 21.37 | $ 44,460 |
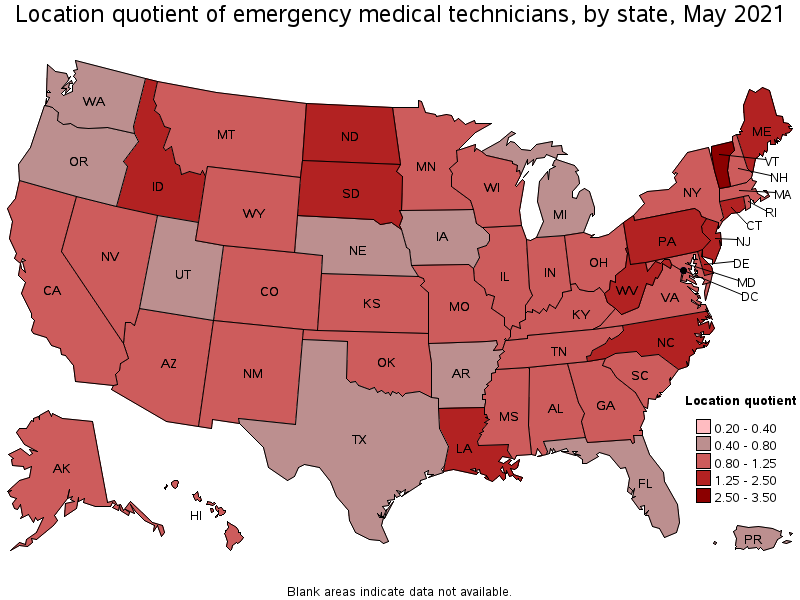
States with the highest concentration of jobs and location quotients in Emergency Medical Technicians:
| State | Employment (1) | Employment per thousand jobs | Location quotient (9) | Hourly mean wage | Annual mean wage (2) |
|---|---|---|---|---|---|
| Vermont | 900 | 3.18 | 2.78 | $ 17.34 | $ 36,070 |
| Delaware | 1,020 | 2.35 | 2.05 | $ 18.79 | $ 39,090 |
| West Virginia | 1,390 | 2.11 | 1.84 | $ 13.71 | $ 28,530 |
| Idaho | 1,270 | 1.68 | 1.46 | $ 15.90 | $ 33,080 |
| North Dakota | 640 | 1.61 | 1.40 | $ 16.42 | $ 34,150 |
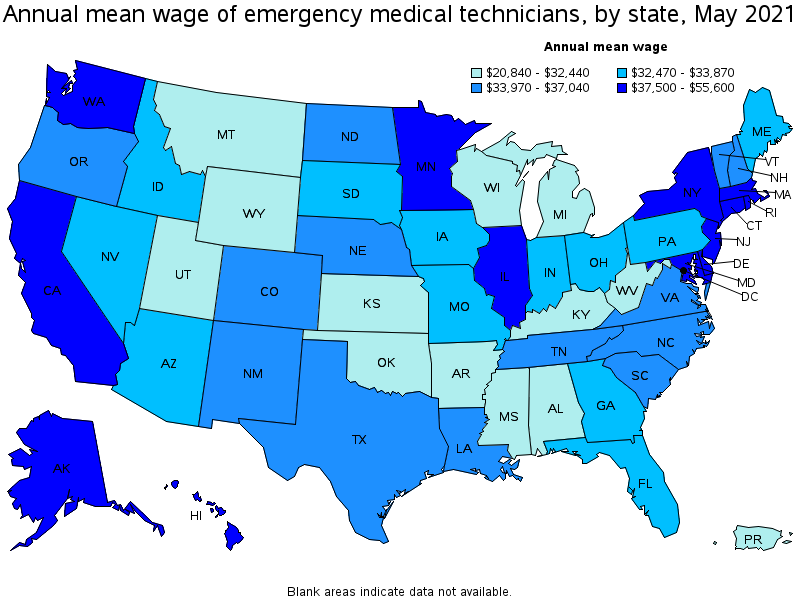
Top paying states for Emergency Medical Technicians:
| State | Employment (1) | Employment per thousand jobs | Location quotient (9) | Hourly mean wage | Annual mean wage (2) |
|---|---|---|---|---|---|
| Hawaii | 540 | 0.98 | 0.85 | $ 26.73 | $ 55,600 |
| Alaska | 380 | 1.28 | 1.12 | $ 24.68 | $ 51,330 |
| Maryland | 2,400 | 0.94 | 0.82 | $ 24.41 | $ 50,770 |
| District of Columbia | 420 | 0.63 | 0.55 | $ 23.32 | $ 48,500 |
| Illinois | 8,000 | 1.42 | 1.24 | $ 21.37 | $ 44,460 |
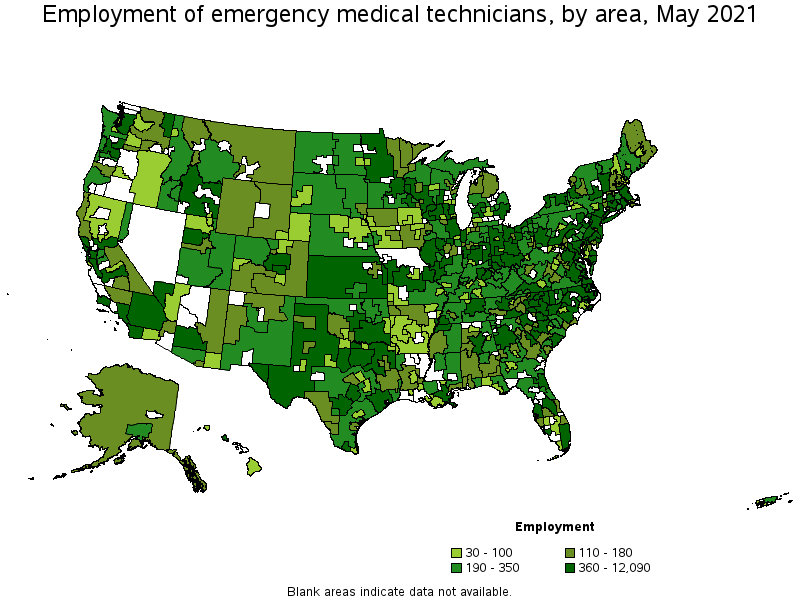
Metropolitan areas with the highest employment level in Emergency Medical Technicians:
| Metropolitan area | Employment (1) | Employment per thousand jobs | Location quotient (9) | Hourly mean wage | Annual mean wage (2) |
|---|---|---|---|---|---|
| New York-Newark-Jersey City, NY-NJ-PA | 12,090 | 1.39 | 1.22 | $ 20.82 | $ 43,310 |
| Chicago-Naperville-Elgin, IL-IN-WI | 5,400 | 1.28 | 1.11 | $ 24.43 | $ 50,820 |
| Los Angeles-Long Beach-Anaheim, CA | 5,350 | 0.94 | 0.82 | $ 19.20 | $ 39,930 |
| Philadelphia-Camden-Wilmington, PA-NJ-DE-MD | 3,790 | 1.43 | 1.25 | $ 18.79 | $ 39,070 |
| Atlanta-Sandy Springs-Roswell, GA | 2,950 | 1.14 | 1.00 | $ 16.56 | $ 34,440 |
| Boston-Cambridge-Nashua, MA-NH | 2,920 | 1.13 | 0.98 | $ 20.86 | $ 43,390 |
| San Francisco-Oakland-Hayward, CA | 2,850 | 1.27 | 1.11 | $ 26.74 | $ 55,620 |
| Houston-The Woodlands-Sugar Land, TX | 2,350 | 0.81 | 0.71 | $ 17.62 | $ 36,640 |
| Dallas-Fort Worth-Arlington, TX | 2,290 | 0.64 | 0.56 | $ 17.48 | $ 36,370 |
| Riverside-San Bernardino-Ontario, CA | 1,890 | 1.24 | 1.08 | $ 18.38 | $ 38,230 |
Metropolitan areas with the highest concentration of jobs and location quotients in Emergency Medical Technicians:
| Metropolitan area | Employment (1) | Employment per thousand jobs | Location quotient (9) | Hourly mean wage | Annual mean wage (2) |
|---|---|---|---|---|---|
| Johnstown, PA | 240 | 5.06 | 4.42 | $ 13.37 | $ 27,810 |
| Rochester, MN | 510 | 4.37 | 3.81 | $ 18.44 | $ 38,350 |
| Ocean City, NJ | 160 | 4.12 | 3.60 | $ 17.31 | $ 36,000 |
| Watertown-Fort Drum, NY | 140 | 3.63 | 3.17 | $ 15.19 | $ 31,600 |
| Mansfield, OH | 160 | 3.45 | 3.01 | $ 15.66 | $ 32,560 |
| Atlantic City-Hammonton, NJ | 390 | 3.32 | 2.90 | $ 16.96 | $ 35,280 |
| Santa Rosa, CA | 630 | 3.30 | 2.88 | $ 19.35 | $ 40,260 |
| Greenville, NC | 240 | 3.25 | 2.83 | $ 15.94 | $ 33,160 |
| Hickory-Lenoir-Morganton, NC | 440 | 3.04 | 2.65 | $ 17.25 | $ 35,890 |
| Terre Haute, IN | 190 | 2.98 | 2.60 | $ 14.39 | $ 29,930 |
Top paying metropolitan areas for Emergency Medical Technicians:
| Metropolitan area | Employment (1) | Employment per thousand jobs | Location quotient (9) | Hourly mean wage | Annual mean wage (2) |
|---|---|---|---|---|---|
| Durham-Chapel Hill, NC | 270 | 0.86 | 0.75 | $ 30.53 | $ 63,500 |
| Coeur d'Alene, ID | 70 | 1.02 | 0.89 | $ 28.37 | $ 59,020 |
| Urban Honolulu, HI | 450 | 1.13 | 0.99 | $ 28.26 | $ 58,770 |
| Washington-Arlington-Alexandria, DC-VA-MD-WV | 1,820 | 0.62 | 0.54 | $ 26.99 | $ 56,130 |
| San Francisco-Oakland-Hayward, CA | 2,850 | 1.27 | 1.11 | $ 26.74 | $ 55,620 |
| Chicago-Naperville-Elgin, IL-IN-WI | 5,400 | 1.28 | 1.11 | $ 24.43 | $ 50,820 |
| San Jose-Sunnyvale-Santa Clara, CA | 760 | 0.71 | 0.62 | $ 24.42 | $ 50,790 |
| Anchorage, AK | 190 | 1.17 | 1.02 | $ 23.37 | $ 48,620 |
| Barnstable Town, MA | 130 | 1.37 | 1.20 | $ 23.32 | $ 48,500 |
| Stockton-Lodi, CA | 270 | 1.07 | 0.93 | $ 21.65 | $ 45,040 |
Nonmetropolitan areas with the highest employment in Emergency Medical Technicians:
| Nonmetropolitan area | Employment (1) | Employment per thousand jobs | Location quotient (9) | Hourly mean wage | Annual mean wage (2) |
|---|---|---|---|---|---|
| Kansas nonmetropolitan area | 960 | 2.55 | 2.23 | $ 11.71 | $ 24,370 |
| Northeast Coastal North Carolina nonmetropolitan area | 690 | 7.66 | 6.69 | $ 15.90 | $ 33,070 |
| Southeast Coastal North Carolina nonmetropolitan area | 630 | 2.63 | 2.30 | $ 16.27 | $ 33,840 |
| Piedmont North Carolina nonmetropolitan area | 610 | 2.49 | 2.17 | $ 16.25 | $ 33,800 |
| Southern Ohio nonmetropolitan area | 600 | 3.92 | 3.42 | $ 14.82 | $ 30,820 |
Nonmetropolitan areas with the highest concentration of jobs and location quotients in Emergency Medical Technicians:
| Nonmetropolitan area | Employment (1) | Employment per thousand jobs | Location quotient (9) | Hourly mean wage | Annual mean wage (2) |
|---|---|---|---|---|---|
| Northeast Coastal North Carolina nonmetropolitan area | 690 | 7.66 | 6.69 | $ 15.90 | $ 33,070 |
| Southeast-Central Idaho nonmetropolitan area | 470 | 5.47 | 4.77 | $ 13.50 | $ 28,080 |
| West South Dakota nonmetropolitan area | 290 | 4.91 | 4.28 | $ 15.21 | $ 31,650 |
| Northern Vermont nonmetropolitan area | 300 | 4.55 | 3.97 | $ 17.15 | $ 35,670 |
| Northeast Virginia nonmetropolitan area | 220 | 4.52 | 3.95 | $ 18.88 | $ 39,270 |
Top paying nonmetropolitan areas for Emergency Medical Technicians:
| Nonmetropolitan area | Employment (1) | Employment per thousand jobs | Location quotient (9) | Hourly mean wage | Annual mean wage (2) |
|---|---|---|---|---|---|
| Alaska nonmetropolitan area | 150 | 1.57 | 1.37 | $ 26.21 | $ 54,530 |
| Massachusetts nonmetropolitan area | 160 | 2.77 | 2.42 | $ 25.23 | $ 52,470 |
| North Valley-Northern Mountains Region of California nonmetropolitan area | 100 | 1.05 | 0.92 | $ 21.24 | $ 44,170 |
| Northwest Colorado nonmetropolitan area | 220 | 1.89 | 1.65 | $ 20.31 | $ 42,240 |
| Northeast Virginia nonmetropolitan area | 220 | 4.52 | 3.95 | $ 18.88 | $ 39,270 |
These estimates are calculated with data collected from employers in all industry sectors, all metropolitan and nonmetropolitan areas, and all states and the District of Columbia. The top employment and wage figures are provided above. The complete list is available in the downloadable XLS files.
The percentile wage estimate is the value of a wage below which a certain percent of workers fall. The median wage is the 50th percentile wage estimate—50 percent of workers earn less than the median and 50 percent of workers earn more than the median. More about percentile wages.
(1) Estimates for detailed occupations do not sum to the totals because the totals include occupations not shown separately. Estimates do not include self-employed workers.
(2) Annual wages have been calculated by multiplying the hourly mean wage by a "year-round, full-time" hours figure of 2,080 hours; for those occupations where there is not an hourly wage published, the annual wage has been directly calculated from the reported survey data.
(3) The relative standard error (RSE) is a measure of the reliability of a survey statistic. The smaller the relative standard error, the more precise the estimate.
(7) The value is less than .005 percent of industry employment.
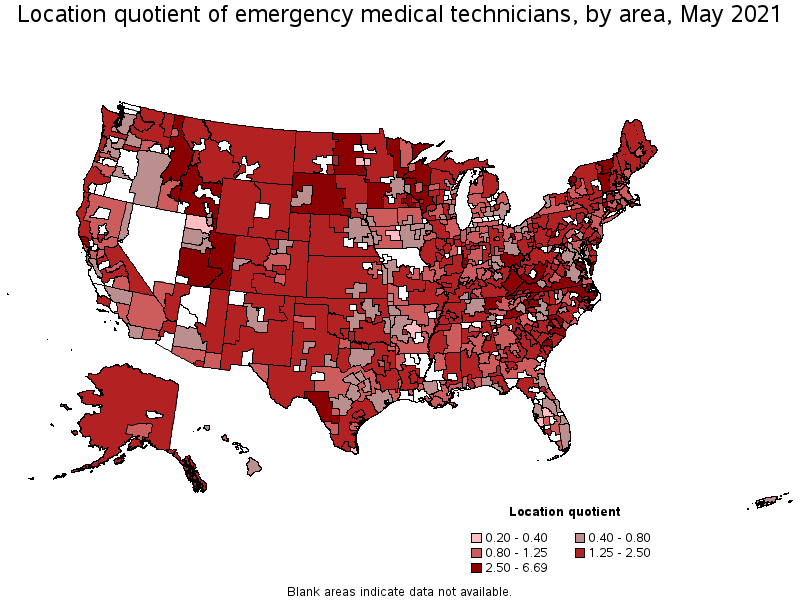
(9) The location quotient is the ratio of the area concentration of occupational employment to the national average concentration. A location quotient greater than one indicates the occupation has a higher share of employment than average, and a location quotient less than one indicates the occupation is less prevalent in the area than average.
Other OEWS estimates and related information:
May 2021 National Occupational Employment and Wage Estimates
May 2021 State Occupational Employment and Wage Estimates
May 2021 Metropolitan and Nonmetropolitan Area Occupational Employment and Wage Estimates
May 2021 National Industry-Specific Occupational Employment and Wage Estimates
Last Modified Date: March 31, 2022