
An official website of the United States government
An official website of the United States government
The .gov means it's official.
Federal government websites often end in .gov or .mil. Before sharing sensitive information,
make sure you're on a federal government site.
The site is secure.
The
https:// ensures that you are connecting to the official website and that any
information you provide is encrypted and transmitted securely.
Assist in operations, under the supervision of surgeons, registered nurses, or other surgical personnel. May help set up operating room, prepare and transport patients for surgery, adjust lights and equipment, pass instruments and other supplies to surgeons and surgeons� assistants, hold retractors, cut sutures, and help count sponges, needles, supplies, and instruments. Excludes �Surgical Assistants� (29-9093).
Employment estimate and mean wage estimates for Surgical Technologists:
| Employment (1) | Employment RSE (3) |
Mean hourly wage |
Mean annual wage (2) |
Wage RSE (3) |
|---|---|---|---|---|
| 109,060 | 1.1 % | $ 25.77 | $ 53,590 | 0.3 % |
Percentile wage estimates for Surgical Technologists:
| Percentile | 10% | 25% | 50% (Median) |
75% | 90% |
|---|---|---|---|---|---|
| Hourly Wage | $ 17.76 | $ 22.33 | $ 23.33 | $ 29.22 | $ 36.51 |
| Annual Wage (2) | $ 36,930 | $ 46,440 | $ 48,530 | $ 60,780 | $ 75,940 |
Industries with the highest published employment and wages for Surgical Technologists are provided. For a list of all industries with employment in Surgical Technologists, see the Create Customized Tables function.
Industries with the highest levels of employment in Surgical Technologists:
| Industry | Employment (1) | Percent of industry employment | Hourly mean wage | Annual mean wage (2) |
|---|---|---|---|---|
| General Medical and Surgical Hospitals | 77,450 | 1.38 | $ 25.63 | $ 53,300 |
| Offices of Physicians | 12,350 | 0.46 | $ 26.12 | $ 54,340 |
| Outpatient Care Centers | 12,080 | 1.22 | $ 26.77 | $ 55,680 |
| Offices of Dentists | 1,830 | 0.19 | $ 23.41 | $ 48,700 |
| Specialty (except Psychiatric and Substance Abuse) Hospitals | 1,530 | 0.57 | $ 28.45 | $ 59,180 |
Industries with the highest concentration of employment in Surgical Technologists:
| Industry | Employment (1) | Percent of industry employment | Hourly mean wage | Annual mean wage (2) |
|---|---|---|---|---|
| General Medical and Surgical Hospitals | 77,450 | 1.38 | $ 25.63 | $ 53,300 |
| Outpatient Care Centers | 12,080 | 1.22 | $ 26.77 | $ 55,680 |
| Specialty (except Psychiatric and Substance Abuse) Hospitals | 1,530 | 0.57 | $ 28.45 | $ 59,180 |
| Offices of Physicians | 12,350 | 0.46 | $ 26.12 | $ 54,340 |
| Offices of Dentists | 1,830 | 0.19 | $ 23.41 | $ 48,700 |
Top paying industries for Surgical Technologists:
| Industry | Employment (1) | Percent of industry employment | Hourly mean wage | Annual mean wage (2) |
|---|---|---|---|---|
| Specialty (except Psychiatric and Substance Abuse) Hospitals | 1,530 | 0.57 | $ 28.45 | $ 59,180 |
| Colleges, Universities, and Professional Schools | 570 | 0.02 | $ 27.95 | $ 58,130 |
| Other Ambulatory Health Care Services | 360 | 0.12 | $ 27.43 | $ 57,040 |
| Offices of Other Health Practitioners | 320 | 0.03 | $ 27.21 | $ 56,600 |
| Outpatient Care Centers | 12,080 | 1.22 | $ 26.77 | $ 55,680 |
States and areas with the highest published employment, location quotients, and wages for Surgical Technologists are provided. For a list of all areas with employment in Surgical Technologists, see the Create Customized Tables function.
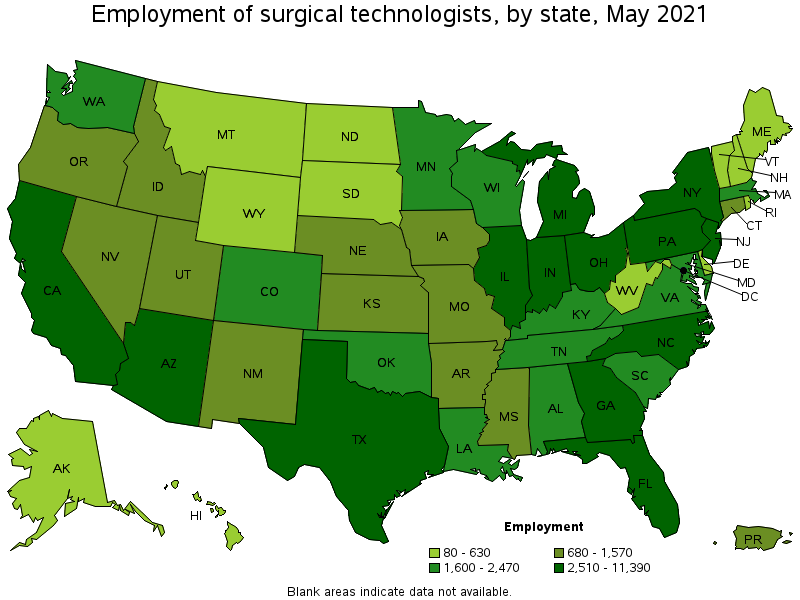
States with the highest employment level in Surgical Technologists:
| State | Employment (1) | Employment per thousand jobs | Location quotient (9) | Hourly mean wage | Annual mean wage (2) |
|---|---|---|---|---|---|
| California | 11,390 | 0.69 | 0.89 | $ 32.89 | $ 68,410 |
| Texas | 10,820 | 0.89 | 1.14 | $ 25.46 | $ 52,950 |
| Florida | 7,370 | 0.86 | 1.11 | $ 23.10 | $ 48,050 |
| New York | 5,720 | 0.66 | 0.85 | $ 29.02 | $ 60,350 |
| Michigan | 4,130 | 1.02 | 1.31 | $ 23.10 | $ 48,050 |
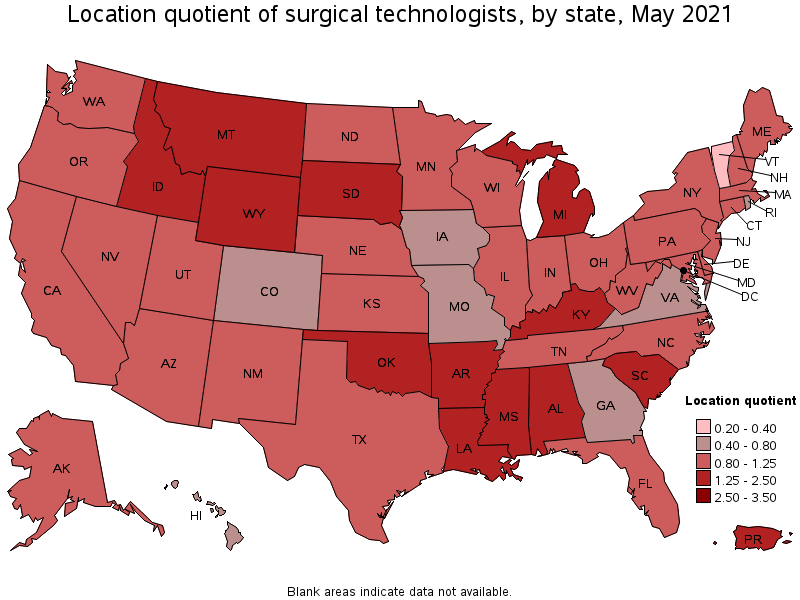
States with the highest concentration of jobs and location quotients in Surgical Technologists:
| State | Employment (1) | Employment per thousand jobs | Location quotient (9) | Hourly mean wage | Annual mean wage (2) |
|---|---|---|---|---|---|
| South Dakota | 590 | 1.41 | 1.82 | $ 21.68 | $ 45,100 |
| Kentucky | 2,370 | 1.29 | 1.67 | $ 22.60 | $ 47,000 |
| Louisiana | 2,210 | 1.23 | 1.59 | $ 20.79 | $ 43,240 |
| South Carolina | 2,470 | 1.19 | 1.54 | $ 22.30 | $ 46,390 |
| Alabama | 2,220 | 1.15 | 1.49 | $ 19.50 | $ 40,550 |
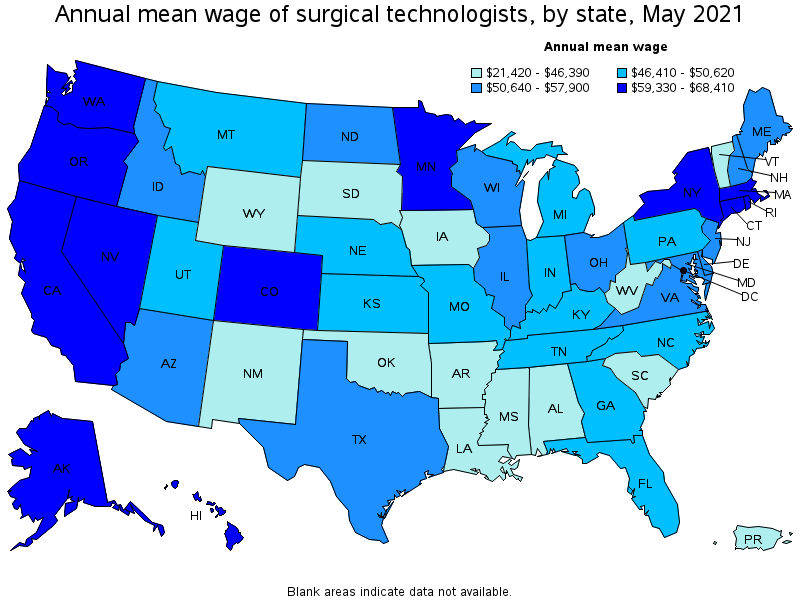
Top paying states for Surgical Technologists:
| State | Employment (1) | Employment per thousand jobs | Location quotient (9) | Hourly mean wage | Annual mean wage (2) |
|---|---|---|---|---|---|
| California | 11,390 | 0.69 | 0.89 | $ 32.89 | $ 68,410 |
| Alaska | 230 | 0.77 | 0.99 | $ 31.58 | $ 65,690 |
| District of Columbia | 270 | 0.41 | 0.53 | $ 31.37 | $ 65,250 |
| Connecticut | 1,270 | 0.80 | 1.04 | $ 31.34 | $ 65,190 |
| Nevada | 1,110 | 0.86 | 1.11 | $ 31.34 | $ 65,180 |
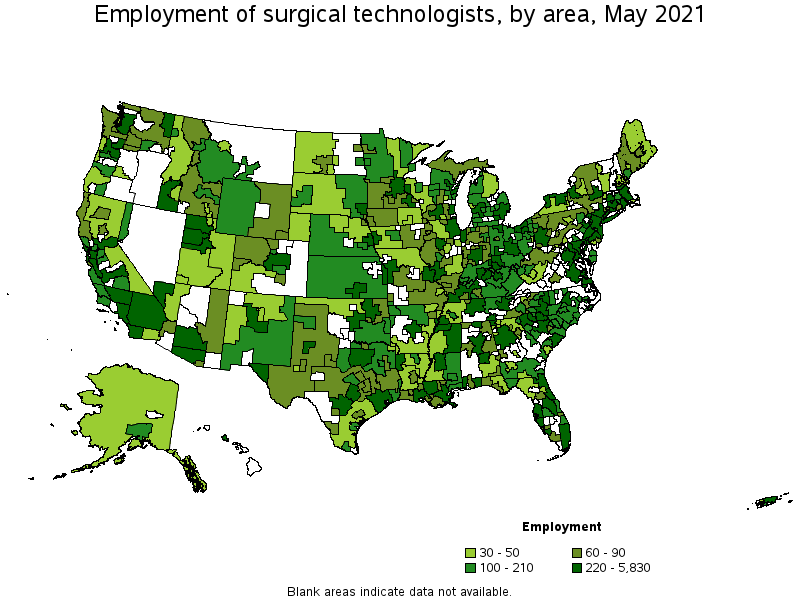
Metropolitan areas with the highest employment level in Surgical Technologists:
| Metropolitan area | Employment (1) | Employment per thousand jobs | Location quotient (9) | Hourly mean wage | Annual mean wage (2) |
|---|---|---|---|---|---|
| New York-Newark-Jersey City, NY-NJ-PA | 5,830 | 0.67 | 0.87 | $ 30.07 | $ 62,540 |
| Los Angeles-Long Beach-Anaheim, CA | 4,510 | 0.79 | 1.02 | $ 32.22 | $ 67,020 |
| Dallas-Fort Worth-Arlington, TX | 3,190 | 0.89 | 1.15 | $ 26.33 | $ 54,760 |
| Houston-The Woodlands-Sugar Land, TX | 2,920 | 1.01 | 1.30 | $ 27.57 | $ 57,340 |
| Chicago-Naperville-Elgin, IL-IN-WI | 2,650 | 0.63 | 0.81 | $ 25.72 | $ 53,490 |
| Phoenix-Mesa-Scottsdale, AZ | 1,930 | 0.91 | 1.18 | $ 27.38 | $ 56,950 |
| Miami-Fort Lauderdale-West Palm Beach, FL | 1,860 | 0.76 | 0.98 | $ 23.85 | $ 49,600 |
| Philadelphia-Camden-Wilmington, PA-NJ-DE-MD | 1,850 | 0.70 | 0.90 | $ 25.96 | $ 53,990 |
| Detroit-Warren-Dearborn, MI | 1,810 | 1.00 | 1.29 | $ 23.52 | $ 48,920 |
| Atlanta-Sandy Springs-Roswell, GA | 1,530 | 0.59 | 0.76 | $ 26.63 | $ 55,380 |
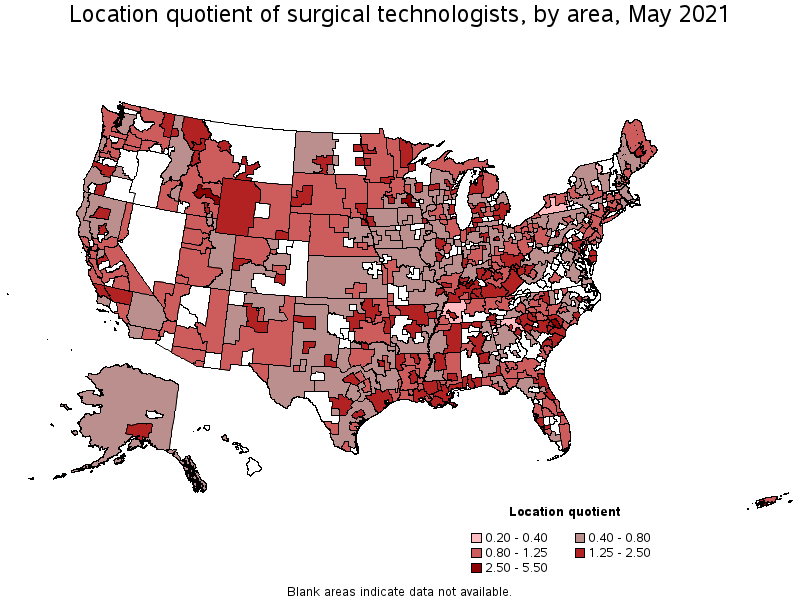
Metropolitan areas with the highest concentration of jobs and location quotients in Surgical Technologists:
| Metropolitan area | Employment (1) | Employment per thousand jobs | Location quotient (9) | Hourly mean wage | Annual mean wage (2) |
|---|---|---|---|---|---|
| Rochester, MN | 490 | 4.26 | 5.50 | $ 29.87 | $ 62,120 |
| Florence, SC | 200 | 2.38 | 3.08 | $ 21.07 | $ 43,820 |
| Owensboro, KY | 110 | 2.16 | 2.79 | $ 22.67 | $ 47,150 |
| Idaho Falls, ID | 150 | 2.13 | 2.76 | $ 23.52 | $ 48,910 |
| Sioux Falls, SD | 300 | 1.91 | 2.47 | $ 21.57 | $ 44,860 |
| Hattiesburg, MS | 120 | 1.89 | 2.45 | $ 18.67 | $ 38,840 |
| Rapid City, SD | 120 | 1.81 | 2.34 | $ 22.06 | $ 45,890 |
| Lubbock, TX | 260 | 1.80 | 2.32 | $ 25.68 | $ 53,410 |
| Billings, MT | 150 | 1.77 | 2.29 | $ 22.53 | $ 46,870 |
| Little Rock-North Little Rock-Conway, AR | 570 | 1.77 | 2.28 | $ 21.40 | $ 44,510 |
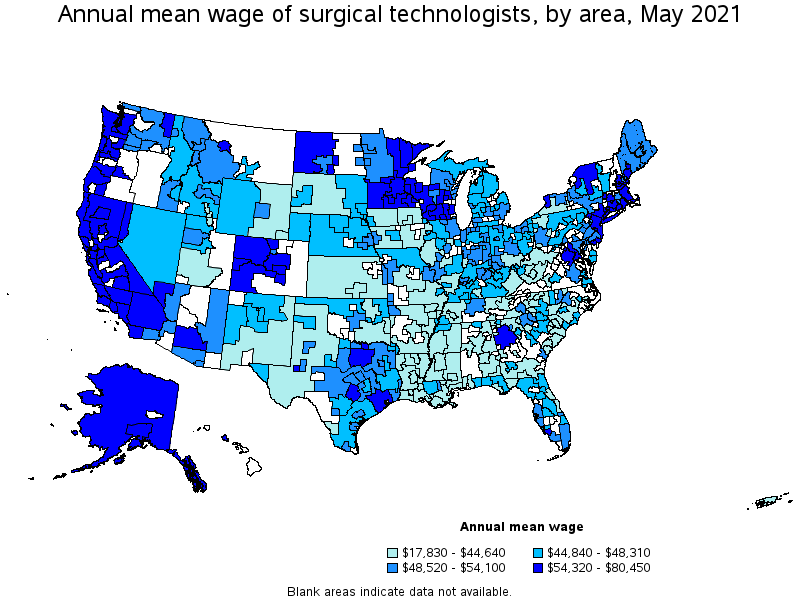
Top paying metropolitan areas for Surgical Technologists:
| Metropolitan area | Employment (1) | Employment per thousand jobs | Location quotient (9) | Hourly mean wage | Annual mean wage (2) |
|---|---|---|---|---|---|
| San Jose-Sunnyvale-Santa Clara, CA | 730 | 0.68 | 0.88 | $ 38.68 | $ 80,450 |
| San Francisco-Oakland-Hayward, CA | 1,460 | 0.65 | 0.84 | $ 38.54 | $ 80,170 |
| Vallejo-Fairfield, CA | 100 | 0.74 | 0.95 | $ 37.24 | $ 77,460 |
| Sacramento--Roseville--Arden-Arcade, CA | 620 | 0.64 | 0.82 | $ 35.80 | $ 74,470 |
| Santa Rosa, CA | 140 | 0.74 | 0.96 | $ 35.74 | $ 74,330 |
| Santa Cruz-Watsonville, CA | 70 | 0.74 | 0.96 | $ 34.41 | $ 71,570 |
| Danbury, CT | 60 | 0.78 | 1.01 | $ 34.36 | $ 71,460 |
| San Diego-Carlsbad, CA | 670 | 0.48 | 0.62 | $ 32.70 | $ 68,010 |
| Stockton-Lodi, CA | 140 | 0.54 | 0.69 | $ 32.24 | $ 67,060 |
| Los Angeles-Long Beach-Anaheim, CA | 4,510 | 0.79 | 1.02 | $ 32.22 | $ 67,020 |
Nonmetropolitan areas with the highest employment in Surgical Technologists:
| Nonmetropolitan area | Employment (1) | Employment per thousand jobs | Location quotient (9) | Hourly mean wage | Annual mean wage (2) |
|---|---|---|---|---|---|
| Northeast Mississippi nonmetropolitan area | 230 | 1.05 | 1.35 | $ 17.75 | $ 36,920 |
| West Kentucky nonmetropolitan area | 230 | 1.59 | 2.06 | $ 22.37 | $ 46,530 |
| South Central Kentucky nonmetropolitan area | 210 | 1.31 | 1.70 | $ 22.32 | $ 46,430 |
| Piedmont North Carolina nonmetropolitan area | 190 | 0.80 | 1.03 | $ 20.98 | $ 43,640 |
| East Kentucky nonmetropolitan area | 180 | 1.83 | 2.37 | $ 21.25 | $ 44,200 |
Nonmetropolitan areas with the highest concentration of jobs and location quotients in Surgical Technologists:
| Nonmetropolitan area | Employment (1) | Employment per thousand jobs | Location quotient (9) | Hourly mean wage | Annual mean wage (2) |
|---|---|---|---|---|---|
| East Kentucky nonmetropolitan area | 180 | 1.83 | 2.37 | $ 21.25 | $ 44,200 |
| West Kentucky nonmetropolitan area | 230 | 1.59 | 2.06 | $ 22.37 | $ 46,530 |
| Upper Savannah South Carolina nonmetropolitan area | 110 | 1.43 | 1.85 | $ 21.15 | $ 43,990 |
| Northwest Lower Peninsula of Michigan nonmetropolitan area | 160 | 1.36 | 1.76 | $ 22.68 | $ 47,170 |
| South Central Kentucky nonmetropolitan area | 210 | 1.31 | 1.70 | $ 22.32 | $ 46,430 |
Top paying nonmetropolitan areas for Surgical Technologists:
| Nonmetropolitan area | Employment (1) | Employment per thousand jobs | Location quotient (9) | Hourly mean wage | Annual mean wage (2) |
|---|---|---|---|---|---|
| North Valley-Northern Mountains Region of California nonmetropolitan area | 50 | 0.47 | 0.61 | $ 32.81 | $ 68,250 |
| Eastern Sierra-Mother Lode Region of California nonmetropolitan area | 40 | 0.77 | 0.99 | $ 32.46 | $ 67,520 |
| Alaska nonmetropolitan area | 40 | 0.38 | 0.50 | $ 31.69 | $ 65,920 |
| Northwest Colorado nonmetropolitan area | 90 | 0.73 | 0.95 | $ 31.02 | $ 64,520 |
| North Coast Region of California nonmetropolitan area | 60 | 0.57 | 0.74 | $ 28.75 | $ 59,800 |
These estimates are calculated with data collected from employers in all industry sectors, all metropolitan and nonmetropolitan areas, and all states and the District of Columbia. The top employment and wage figures are provided above. The complete list is available in the downloadable XLS files.
The percentile wage estimate is the value of a wage below which a certain percent of workers fall. The median wage is the 50th percentile wage estimate—50 percent of workers earn less than the median and 50 percent of workers earn more than the median. More about percentile wages.
(1) Estimates for detailed occupations do not sum to the totals because the totals include occupations not shown separately. Estimates do not include self-employed workers.
(2) Annual wages have been calculated by multiplying the hourly mean wage by a "year-round, full-time" hours figure of 2,080 hours; for those occupations where there is not an hourly wage published, the annual wage has been directly calculated from the reported survey data.
(3) The relative standard error (RSE) is a measure of the reliability of a survey statistic. The smaller the relative standard error, the more precise the estimate.
(9) The location quotient is the ratio of the area concentration of occupational employment to the national average concentration. A location quotient greater than one indicates the occupation has a higher share of employment than average, and a location quotient less than one indicates the occupation is less prevalent in the area than average.
Other OEWS estimates and related information:
May 2021 National Occupational Employment and Wage Estimates
May 2021 State Occupational Employment and Wage Estimates
May 2021 Metropolitan and Nonmetropolitan Area Occupational Employment and Wage Estimates
May 2021 National Industry-Specific Occupational Employment and Wage Estimates
Last Modified Date: March 31, 2022