
An official website of the United States government
An official website of the United States government
The .gov means it's official.
Federal government websites often end in .gov or .mil. Before sharing sensitive information,
make sure you're on a federal government site.
The site is secure.
The
https:// ensures that you are connecting to the official website and that any
information you provide is encrypted and transmitted securely.
Care for ill, injured, or convalescing patients or persons with disabilities in hospitals, nursing homes, clinics, private homes, group homes, and similar institutions. May work under the supervision of a registered nurse. Licensing required.
Employment estimate and mean wage estimates for Licensed Practical and Licensed Vocational Nurses:
| Employment (1) | Employment RSE (3) |
Mean hourly wage |
Mean annual wage (2) |
Wage RSE (3) |
|---|---|---|---|---|
| 641,240 | 0.7 % | $ 24.93 | $ 51,850 | 0.4 % |
Percentile wage estimates for Licensed Practical and Licensed Vocational Nurses:
| Percentile | 10% | 25% | 50% (Median) |
75% | 90% |
|---|---|---|---|---|---|
| Hourly Wage | $ 17.86 | $ 22.31 | $ 23.11 | $ 28.73 | $ 30.67 |
| Annual Wage (2) | $ 37,150 | $ 46,410 | $ 48,070 | $ 59,770 | $ 63,790 |
Industries with the highest published employment and wages for Licensed Practical and Licensed Vocational Nurses are provided. For a list of all industries with employment in Licensed Practical and Licensed Vocational Nurses, see the Create Customized Tables function.
Industries with the highest levels of employment in Licensed Practical and Licensed Vocational Nurses:
| Industry | Employment (1) | Percent of industry employment | Hourly mean wage | Annual mean wage (2) |
|---|---|---|---|---|
| Nursing Care Facilities (Skilled Nursing Facilities) | 177,960 | 12.64 | $ 25.80 | $ 53,670 |
| Home Health Care Services | 89,280 | 5.89 | $ 25.32 | $ 52,670 |
| Offices of Physicians | 80,510 | 2.99 | $ 22.57 | $ 46,950 |
| General Medical and Surgical Hospitals | 78,090 | 1.40 | $ 23.10 | $ 48,050 |
| Continuing Care Retirement Communities and Assisted Living Facilities for the Elderly | 45,200 | 5.07 | $ 25.22 | $ 52,460 |
Industries with the highest concentration of employment in Licensed Practical and Licensed Vocational Nurses:
| Industry | Employment (1) | Percent of industry employment | Hourly mean wage | Annual mean wage (2) |
|---|---|---|---|---|
| Nursing Care Facilities (Skilled Nursing Facilities) | 177,960 | 12.64 | $ 25.80 | $ 53,670 |
| Home Health Care Services | 89,280 | 5.89 | $ 25.32 | $ 52,670 |
| Continuing Care Retirement Communities and Assisted Living Facilities for the Elderly | 45,200 | 5.07 | $ 25.22 | $ 52,460 |
| Psychiatric and Substance Abuse Hospitals | 9,010 | 3.76 | $ 25.21 | $ 52,440 |
| Outpatient Care Centers | 33,090 | 3.35 | $ 27.97 | $ 58,170 |
Top paying industries for Licensed Practical and Licensed Vocational Nurses:
| Industry | Employment (1) | Percent of industry employment | Hourly mean wage | Annual mean wage (2) |
|---|---|---|---|---|
| Personal Care Services | 150 | 0.02 | $ 31.18 | $ 64,840 |
| Office Administrative Services | 1,370 | 0.28 | $ 30.93 | $ 64,330 |
| Insurance Carriers | 620 | 0.05 | $ 28.73 | $ 59,770 |
| Health and Personal Care Stores | 100 | 0.01 | $ 28.65 | $ 59,590 |
| Junior Colleges | 90 | 0.01 | $ 28.56 | $ 59,400 |
States and areas with the highest published employment, location quotients, and wages for Licensed Practical and Licensed Vocational Nurses are provided. For a list of all areas with employment in Licensed Practical and Licensed Vocational Nurses, see the Create Customized Tables function.
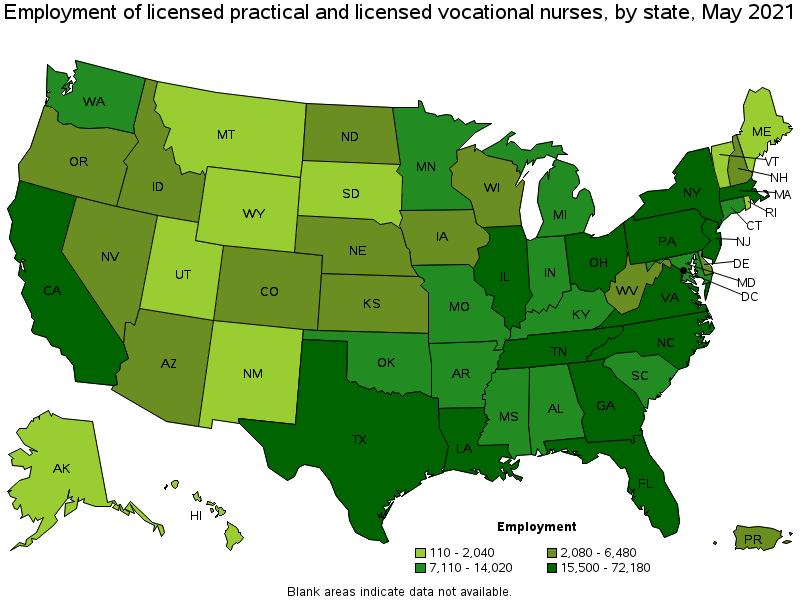
States with the highest employment level in Licensed Practical and Licensed Vocational Nurses:
| State | Employment (1) | Employment per thousand jobs | Location quotient (9) | Hourly mean wage | Annual mean wage (2) |
|---|---|---|---|---|---|
| California | 72,180 | 4.37 | 0.96 | $ 31.32 | $ 65,140 |
| Texas | 64,680 | 5.29 | 1.16 | $ 24.15 | $ 50,220 |
| New York | 40,470 | 4.67 | 1.03 | $ 25.84 | $ 53,750 |
| Florida | 37,740 | 4.39 | 0.96 | $ 23.01 | $ 47,860 |
| Pennsylvania | 36,810 | 6.59 | 1.45 | $ 24.56 | $ 51,090 |
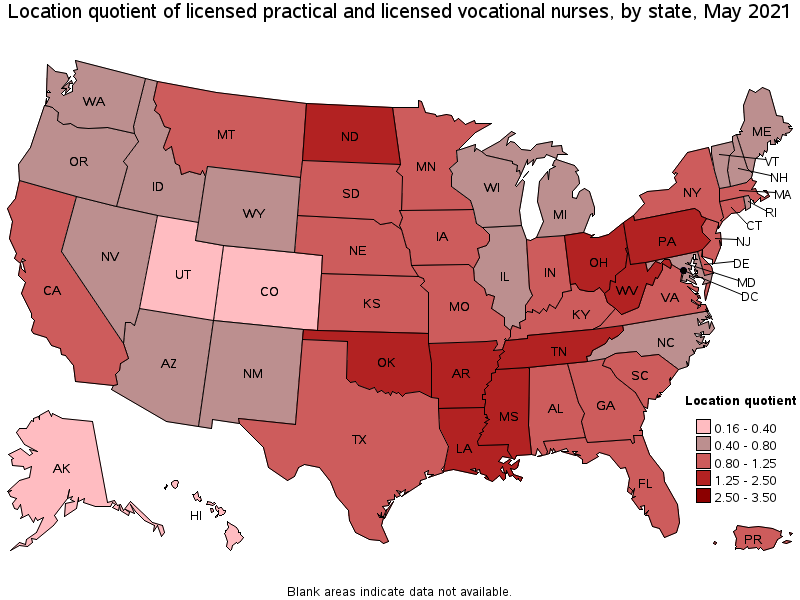
States with the highest concentration of jobs and location quotients in Licensed Practical and Licensed Vocational Nurses:
| State | Employment (1) | Employment per thousand jobs | Location quotient (9) | Hourly mean wage | Annual mean wage (2) |
|---|---|---|---|---|---|
| Louisiana | 18,120 | 10.11 | 2.22 | $ 21.11 | $ 43,900 |
| West Virginia | 6,190 | 9.41 | 2.07 | $ 19.86 | $ 41,310 |
| Arkansas | 10,480 | 8.80 | 1.93 | $ 20.69 | $ 43,040 |
| Mississippi | 8,730 | 7.92 | 1.74 | $ 19.97 | $ 41,530 |
| Oklahoma | 12,150 | 7.80 | 1.71 | $ 21.59 | $ 44,910 |
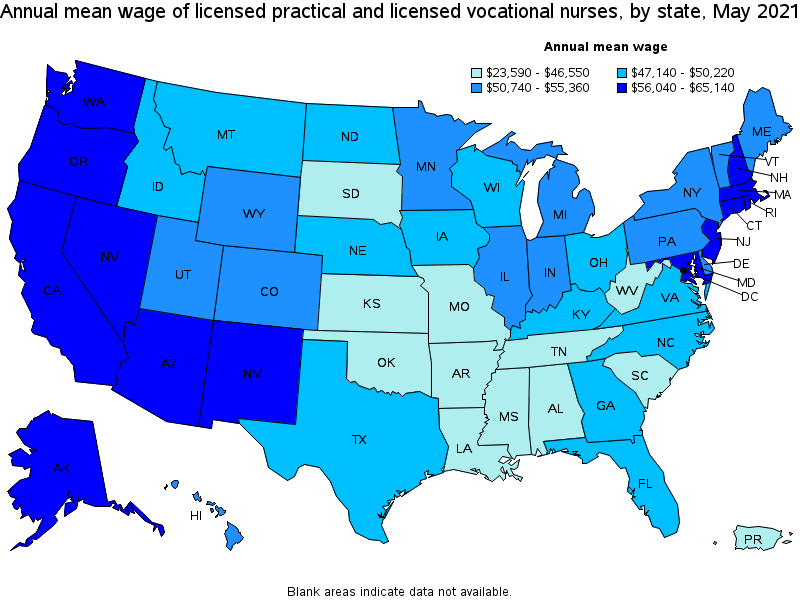
Top paying states for Licensed Practical and Licensed Vocational Nurses:
| State | Employment (1) | Employment per thousand jobs | Location quotient (9) | Hourly mean wage | Annual mean wage (2) |
|---|---|---|---|---|---|
| California | 72,180 | 4.37 | 0.96 | $ 31.32 | $ 65,140 |
| Alaska | 480 | 1.61 | 0.35 | $ 30.60 | $ 63,650 |
| Washington | 7,110 | 2.22 | 0.49 | $ 30.41 | $ 63,250 |
| Massachusetts | 15,500 | 4.57 | 1.00 | $ 29.72 | $ 61,820 |
| Nevada | 3,610 | 2.80 | 0.61 | $ 29.08 | $ 60,490 |
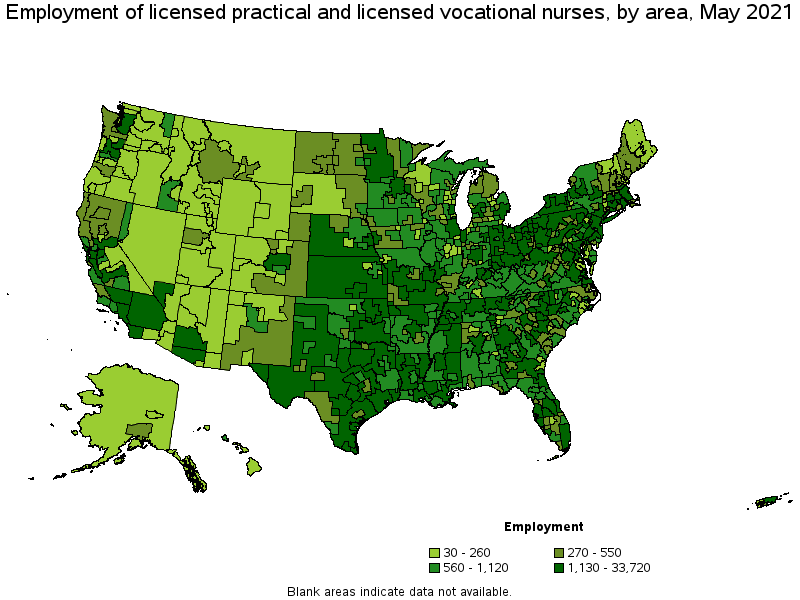
Metropolitan areas with the highest employment level in Licensed Practical and Licensed Vocational Nurses:
| Metropolitan area | Employment (1) | Employment per thousand jobs | Location quotient (9) | Hourly mean wage | Annual mean wage (2) |
|---|---|---|---|---|---|
| New York-Newark-Jersey City, NY-NJ-PA | 33,720 | 3.89 | 0.85 | $ 28.47 | $ 59,230 |
| Los Angeles-Long Beach-Anaheim, CA | 29,750 | 5.20 | 1.14 | $ 30.77 | $ 63,990 |
| Philadelphia-Camden-Wilmington, PA-NJ-DE-MD | 15,970 | 6.02 | 1.32 | $ 26.75 | $ 55,640 |
| Dallas-Fort Worth-Arlington, TX | 14,790 | 4.12 | 0.91 | $ 25.69 | $ 53,440 |
| Houston-The Woodlands-Sugar Land, TX | 12,200 | 4.21 | 0.92 | $ 25.46 | $ 52,960 |
| Chicago-Naperville-Elgin, IL-IN-WI | 10,740 | 2.54 | 0.56 | $ 27.64 | $ 57,480 |
| Boston-Cambridge-Nashua, MA-NH | 10,370 | 4.01 | 0.88 | $ 30.04 | $ 62,470 |
| Atlanta-Sandy Springs-Roswell, GA | 9,490 | 3.67 | 0.81 | $ 24.81 | $ 51,610 |
| Miami-Fort Lauderdale-West Palm Beach, FL | 9,110 | 3.72 | 0.82 | $ 23.68 | $ 49,260 |
| Washington-Arlington-Alexandria, DC-VA-MD-WV | 8,130 | 2.77 | 0.61 | $ 27.15 | $ 56,480 |
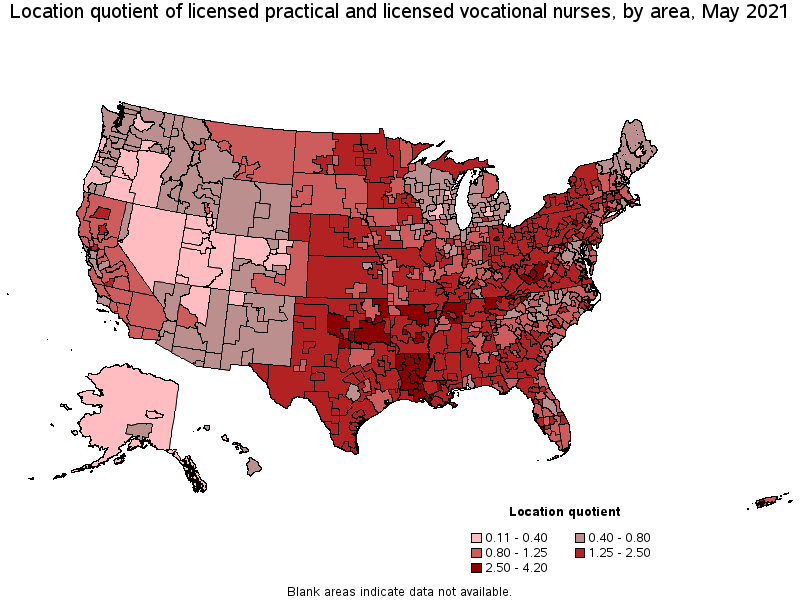
Metropolitan areas with the highest concentration of jobs and location quotients in Licensed Practical and Licensed Vocational Nurses:
| Metropolitan area | Employment (1) | Employment per thousand jobs | Location quotient (9) | Hourly mean wage | Annual mean wage (2) |
|---|---|---|---|---|---|
| Johnson City, TN | 1,150 | 14.77 | 3.24 | $ 19.28 | $ 40,100 |
| Alexandria, LA | 840 | 14.47 | 3.18 | $ 20.63 | $ 42,910 |
| Wichita Falls, TX | 750 | 13.84 | 3.04 | $ 21.57 | $ 44,860 |
| Hammond, LA | 610 | 13.78 | 3.03 | $ 21.03 | $ 43,730 |
| Monroe, LA | 1,000 | 13.69 | 3.01 | $ 20.27 | $ 42,160 |
| Shreveport-Bossier City, LA | 2,070 | 12.75 | 2.80 | $ 21.13 | $ 43,940 |
| Beckley, WV | 500 | 12.73 | 2.80 | $ 18.71 | $ 38,920 |
| Hot Springs, AR | 440 | 12.14 | 2.67 | $ 20.37 | $ 42,360 |
| Jonesboro, AR | 680 | 12.08 | 2.65 | $ 19.42 | $ 40,400 |
| Lima, OH | 580 | 11.84 | 2.60 | $ 22.18 | $ 46,140 |
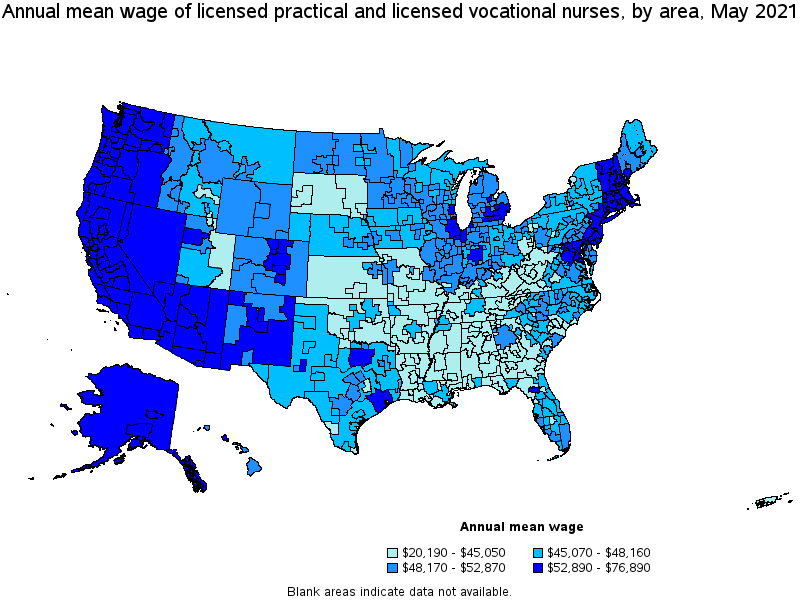
Top paying metropolitan areas for Licensed Practical and Licensed Vocational Nurses:
| Metropolitan area | Employment (1) | Employment per thousand jobs | Location quotient (9) | Hourly mean wage | Annual mean wage (2) |
|---|---|---|---|---|---|
| Napa, CA | 340 | 4.99 | 1.10 | $ 36.97 | $ 76,890 |
| San Jose-Sunnyvale-Santa Clara, CA | 2,680 | 2.50 | 0.55 | $ 36.48 | $ 75,880 |
| San Francisco-Oakland-Hayward, CA | 7,450 | 3.32 | 0.73 | $ 36.26 | $ 75,410 |
| Santa Rosa, CA | 790 | 4.12 | 0.90 | $ 34.22 | $ 71,180 |
| Vallejo-Fairfield, CA | 860 | 6.66 | 1.46 | $ 34.00 | $ 70,720 |
| San Luis Obispo-Paso Robles-Arroyo Grande, CA | 440 | 3.91 | 0.86 | $ 33.14 | $ 68,940 |
| Santa Cruz-Watsonville, CA | 290 | 3.14 | 0.69 | $ 32.12 | $ 66,800 |
| Seattle-Tacoma-Bellevue, WA | 3,810 | 1.98 | 0.44 | $ 31.91 | $ 66,380 |
| Sacramento--Roseville--Arden-Arcade, CA | 3,800 | 3.86 | 0.85 | $ 31.77 | $ 66,090 |
| Carson City, NV | 100 | 3.32 | 0.73 | $ 31.47 | $ 65,460 |
Nonmetropolitan areas with the highest employment in Licensed Practical and Licensed Vocational Nurses:
| Nonmetropolitan area | Employment (1) | Employment per thousand jobs | Location quotient (9) | Hourly mean wage | Annual mean wage (2) |
|---|---|---|---|---|---|
| North Northeastern Ohio nonmetropolitan area (noncontiguous) | 2,990 | 9.52 | 2.09 | $ 22.03 | $ 45,820 |
| North Texas Region of Texas nonmetropolitan area | 2,640 | 9.94 | 2.18 | $ 22.33 | $ 46,450 |
| Kansas nonmetropolitan area | 2,340 | 6.24 | 1.37 | $ 21.11 | $ 43,910 |
| Northeast Mississippi nonmetropolitan area | 1,930 | 8.71 | 1.91 | $ 19.31 | $ 40,160 |
| Southeast Oklahoma nonmetropolitan area | 1,910 | 11.70 | 2.57 | $ 20.72 | $ 43,100 |
Nonmetropolitan areas with the highest concentration of jobs and location quotients in Licensed Practical and Licensed Vocational Nurses:
| Nonmetropolitan area | Employment (1) | Employment per thousand jobs | Location quotient (9) | Hourly mean wage | Annual mean wage (2) |
|---|---|---|---|---|---|
| Northeast Louisiana nonmetropolitan area | 1,180 | 19.11 | 4.20 | $ 20.36 | $ 42,340 |
| Central Louisiana nonmetropolitan area | 1,320 | 17.93 | 3.94 | $ 20.45 | $ 42,540 |
| North Central Tennessee nonmetropolitan area | 1,810 | 16.51 | 3.63 | $ 20.21 | $ 42,030 |
| Southern West Virginia nonmetropolitan area | 900 | 13.50 | 2.97 | $ 19.01 | $ 39,550 |
| Northeast Oklahoma nonmetropolitan area | 1,460 | 12.90 | 2.83 | $ 20.75 | $ 43,150 |
Top paying nonmetropolitan areas for Licensed Practical and Licensed Vocational Nurses:
| Nonmetropolitan area | Employment (1) | Employment per thousand jobs | Location quotient (9) | Hourly mean wage | Annual mean wage (2) |
|---|---|---|---|---|---|
| Alaska nonmetropolitan area | 110 | 1.14 | 0.25 | $ 31.36 | $ 65,230 |
| Eastern Sierra-Mother Lode Region of California nonmetropolitan area | 230 | 3.96 | 0.87 | $ 30.00 | $ 62,390 |
| Western Washington nonmetropolitan area | 340 | 2.81 | 0.62 | $ 29.27 | $ 60,880 |
| Massachusetts nonmetropolitan area | 280 | 4.86 | 1.07 | $ 29.18 | $ 60,690 |
| North Coast Region of California nonmetropolitan area | 410 | 4.09 | 0.90 | $ 29.08 | $ 60,490 |
These estimates are calculated with data collected from employers in all industry sectors, all metropolitan and nonmetropolitan areas, and all states and the District of Columbia. The top employment and wage figures are provided above. The complete list is available in the downloadable XLS files.
The percentile wage estimate is the value of a wage below which a certain percent of workers fall. The median wage is the 50th percentile wage estimate—50 percent of workers earn less than the median and 50 percent of workers earn more than the median. More about percentile wages.
(1) Estimates for detailed occupations do not sum to the totals because the totals include occupations not shown separately. Estimates do not include self-employed workers.
(2) Annual wages have been calculated by multiplying the hourly mean wage by a "year-round, full-time" hours figure of 2,080 hours; for those occupations where there is not an hourly wage published, the annual wage has been directly calculated from the reported survey data.
(3) The relative standard error (RSE) is a measure of the reliability of a survey statistic. The smaller the relative standard error, the more precise the estimate.
(9) The location quotient is the ratio of the area concentration of occupational employment to the national average concentration. A location quotient greater than one indicates the occupation has a higher share of employment than average, and a location quotient less than one indicates the occupation is less prevalent in the area than average.
Other OEWS estimates and related information:
May 2021 National Occupational Employment and Wage Estimates
May 2021 State Occupational Employment and Wage Estimates
May 2021 Metropolitan and Nonmetropolitan Area Occupational Employment and Wage Estimates
May 2021 National Industry-Specific Occupational Employment and Wage Estimates
Last Modified Date: March 31, 2022