
An official website of the United States government
An official website of the United States government
The .gov means it's official.
Federal government websites often end in .gov or .mil. Before sharing sensitive information,
make sure you're on a federal government site.
The site is secure.
The
https:// ensures that you are connecting to the official website and that any
information you provide is encrypted and transmitted securely.
Transcribe medical reports recorded by physicians and other healthcare practitioners using various electronic devices, covering office visits, emergency room visits, diagnostic imaging studies, operations, chart reviews, and final summaries. Transcribe dictated reports and translate abbreviations into fully understandable form. Edit as necessary and return reports in either printed or electronic form for review and signature, or correction.
Employment estimate and mean wage estimates for Medical Transcriptionists:
| Employment (1) | Employment RSE (3) |
Mean hourly wage |
Mean annual wage (2) |
Wage RSE (3) |
|---|---|---|---|---|
| 55,830 | 3.7 % | $ 16.45 | $ 34,220 | 0.9 % |
Percentile wage estimates for Medical Transcriptionists:
| Percentile | 10% | 25% | 50% (Median) |
75% | 90% |
|---|---|---|---|---|---|
| Hourly Wage | $ 10.97 | $ 13.57 | $ 14.47 | $ 18.38 | $ 23.17 |
| Annual Wage (2) | $ 22,810 | $ 28,220 | $ 30,100 | $ 38,220 | $ 48,190 |
Industries with the highest published employment and wages for Medical Transcriptionists are provided. For a list of all industries with employment in Medical Transcriptionists, see the Create Customized Tables function.
Industries with the highest levels of employment in Medical Transcriptionists:
| Industry | Employment (1) | Percent of industry employment | Hourly mean wage | Annual mean wage (2) |
|---|---|---|---|---|
| Business Support Services | 17,320 | 2.10 | $ 13.28 | $ 27,610 |
| Offices of Physicians | 14,940 | 0.55 | $ 18.14 | $ 37,730 |
| General Medical and Surgical Hospitals | 6,640 | 0.12 | $ 20.41 | $ 42,460 |
| Management, Scientific, and Technical Consulting Services | 1,750 | 0.11 | $ 13.36 | $ 27,800 |
| Offices of Other Health Practitioners | 1,430 | 0.15 | $ 15.87 | $ 33,020 |
Industries with the highest concentration of employment in Medical Transcriptionists:
| Industry | Employment (1) | Percent of industry employment | Hourly mean wage | Annual mean wage (2) |
|---|---|---|---|---|
| Business Support Services | 17,320 | 2.10 | $ 13.28 | $ 27,610 |
| Offices of Physicians | 14,940 | 0.55 | $ 18.14 | $ 37,730 |
| Medical and Diagnostic Laboratories | 1,390 | 0.47 | $ 22.21 | $ 46,190 |
| Office Administrative Services | 920 | 0.19 | $ 19.48 | $ 40,520 |
| Offices of Other Health Practitioners | 1,430 | 0.15 | $ 15.87 | $ 33,020 |
Top paying industries for Medical Transcriptionists:
| Industry | Employment (1) | Percent of industry employment | Hourly mean wage | Annual mean wage (2) |
|---|---|---|---|---|
| Offices of Dentists | 520 | 0.05 | $ 24.19 | $ 50,320 |
| Data Processing, Hosting, and Related Services | (8) | (8) | $ 23.60 | $ 49,090 |
| Medical and Diagnostic Laboratories | 1,390 | 0.47 | $ 22.21 | $ 46,190 |
| Local Government, excluding schools and hospitals (OEWS Designation) | 140 | (7) | $ 22.00 | $ 45,750 |
| Nursing Care Facilities (Skilled Nursing Facilities) | 50 | (7) | $ 21.60 | $ 44,930 |
States and areas with the highest published employment, location quotients, and wages for Medical Transcriptionists are provided. For a list of all areas with employment in Medical Transcriptionists, see the Create Customized Tables function.
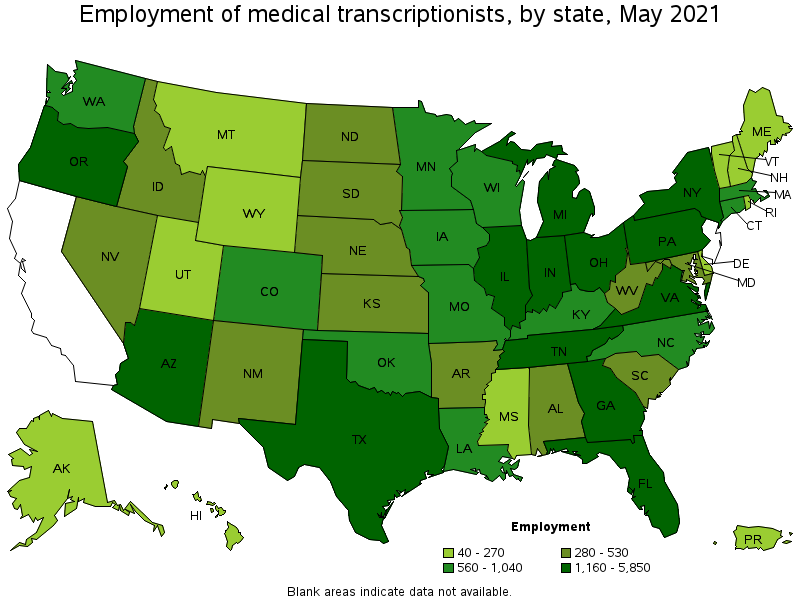
States with the highest employment level in Medical Transcriptionists:
| State | Employment (1) | Employment per thousand jobs | Location quotient (9) | Hourly mean wage | Annual mean wage (2) |
|---|---|---|---|---|---|
| Florida | 5,850 | 0.68 | 1.72 | $ 15.25 | $ 31,710 |
| Texas | 4,980 | 0.41 | 1.03 | $ 14.50 | $ 30,170 |
| New York | 3,030 | 0.35 | 0.88 | $ 16.64 | $ 34,600 |
| Pennsylvania | 1,940 | 0.35 | 0.88 | $ 17.86 | $ 37,140 |
| Illinois | 1,840 | 0.33 | 0.83 | $ 15.78 | $ 32,830 |
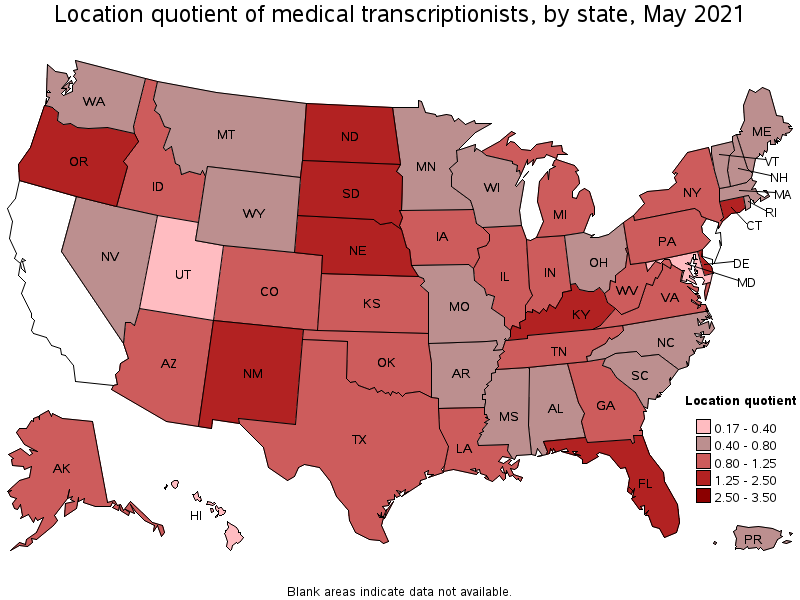
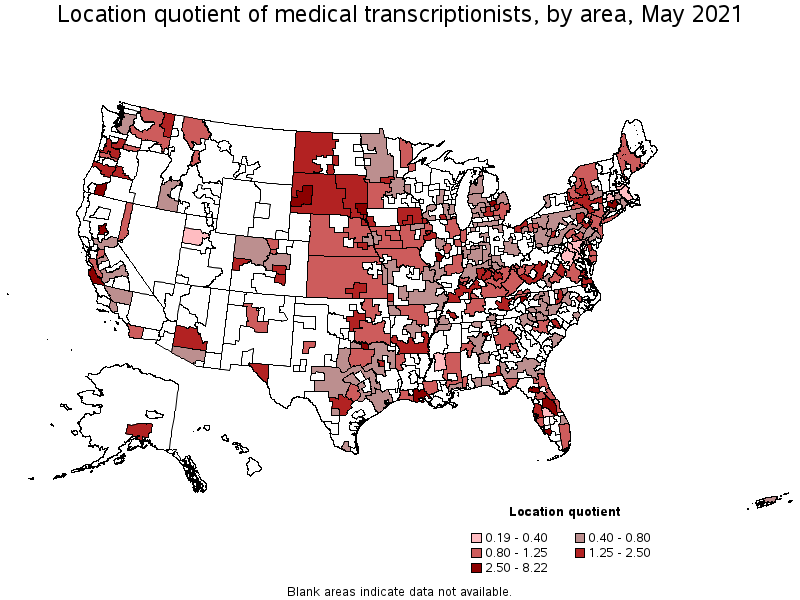
States with the highest concentration of jobs and location quotients in Medical Transcriptionists:
| State | Employment (1) | Employment per thousand jobs | Location quotient (9) | Hourly mean wage | Annual mean wage (2) |
|---|---|---|---|---|---|
| South Dakota | 380 | 0.90 | 2.26 | $ 18.92 | $ 39,350 |
| North Dakota | 340 | 0.86 | 2.17 | $ 16.32 | $ 33,940 |
| Florida | 5,850 | 0.68 | 1.72 | $ 15.25 | $ 31,710 |
| Oregon | 1,160 | 0.64 | 1.60 | $ 19.00 | $ 39,520 |
| Delaware | 270 | 0.62 | 1.57 | $ 16.61 | $ 34,540 |
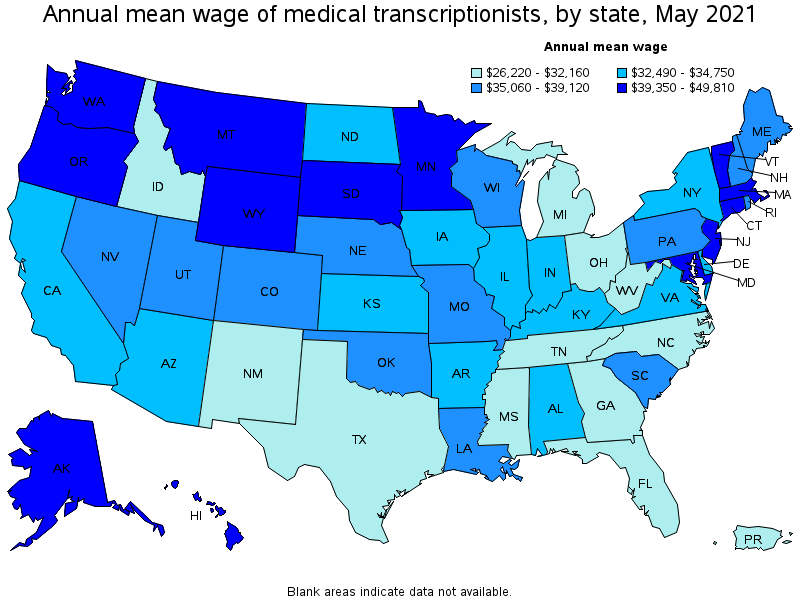
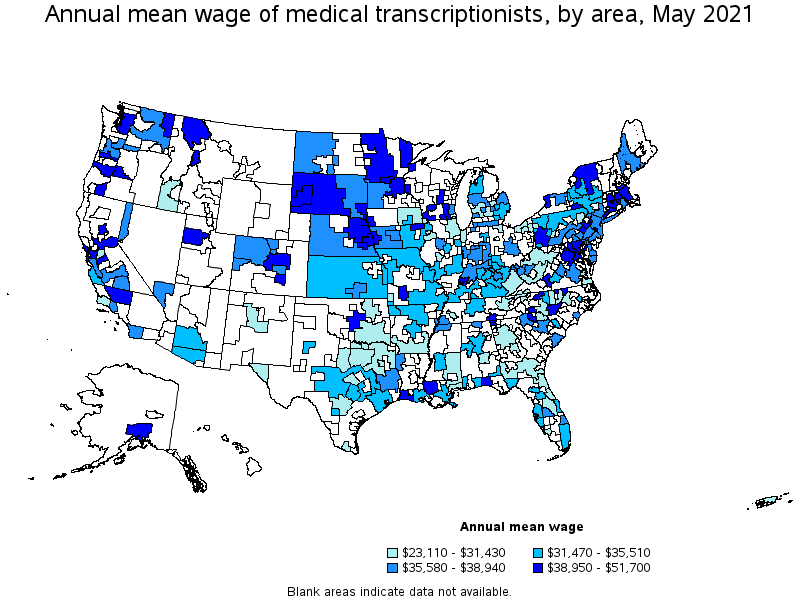
Top paying states for Medical Transcriptionists:
| State | Employment (1) | Employment per thousand jobs | Location quotient (9) | Hourly mean wage | Annual mean wage (2) |
|---|---|---|---|---|---|
| Connecticut | 900 | 0.57 | 1.45 | $ 23.95 | $ 49,810 |
| Alaska | 100 | 0.34 | 0.86 | $ 21.51 | $ 44,730 |
| Minnesota | 690 | 0.25 | 0.63 | $ 21.34 | $ 44,390 |
| New Jersey | (8) | (8) | (8) | $ 21.15 | $ 43,990 |
| Montana | 130 | 0.27 | 0.69 | $ 20.98 | $ 43,640 |
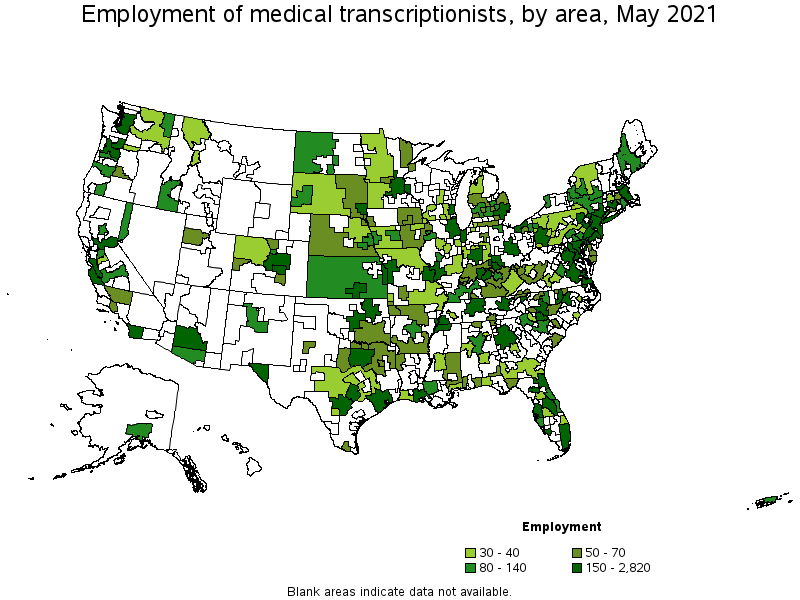
Metropolitan areas with the highest employment level in Medical Transcriptionists:
| Metropolitan area | Employment (1) | Employment per thousand jobs | Location quotient (9) | Hourly mean wage | Annual mean wage (2) |
|---|---|---|---|---|---|
| New York-Newark-Jersey City, NY-NJ-PA | 2,820 | 0.32 | 0.82 | $ 17.37 | $ 36,130 |
| Dallas-Fort Worth-Arlington, TX | 1,730 | 0.48 | 1.21 | $ 15.04 | $ 31,270 |
| Chicago-Naperville-Elgin, IL-IN-WI | 1,680 | 0.40 | 1.00 | $ 14.60 | $ 30,380 |
| Orlando-Kissimmee-Sanford, FL | 1,620 | 1.38 | 3.48 | $ 13.53 | $ 28,130 |
| Atlanta-Sandy Springs-Roswell, GA | 1,080 | 0.42 | 1.05 | $ 13.56 | $ 28,200 |
| Phoenix-Mesa-Scottsdale, AZ | 1,050 | 0.50 | 1.25 | $ 15.49 | $ 32,220 |
| Tampa-St. Petersburg-Clearwater, FL | 920 | 0.71 | 1.80 | $ 16.06 | $ 33,410 |
| Houston-The Woodlands-Sugar Land, TX | 860 | 0.30 | 0.75 | $ 15.45 | $ 32,140 |
| Miami-Fort Lauderdale-West Palm Beach, FL | 860 | 0.35 | 0.88 | $ 16.84 | $ 35,020 |
| Philadelphia-Camden-Wilmington, PA-NJ-DE-MD | 830 | 0.31 | 0.79 | $ 18.36 | $ 38,180 |
Metropolitan areas with the highest concentration of jobs and location quotients in Medical Transcriptionists:
| Metropolitan area | Employment (1) | Employment per thousand jobs | Location quotient (9) | Hourly mean wage | Annual mean wage (2) |
|---|---|---|---|---|---|
| Johnson City, TN | 250 | 3.26 | 8.22 | $ 11.59 | $ 24,100 |
| Saginaw, MI | 130 | 1.69 | 4.26 | $ 12.77 | $ 26,550 |
| Chico, CA | 110 | 1.45 | 3.67 | $ 22.52 | $ 46,840 |
| Orlando-Kissimmee-Sanford, FL | 1,620 | 1.38 | 3.48 | $ 13.53 | $ 28,130 |
| Medford, OR | 110 | 1.33 | 3.35 | $ 20.53 | $ 42,700 |
| Salinas, CA | 220 | 1.32 | 3.33 | $ 16.50 | $ 34,320 |
| Gainesville, FL | 170 | 1.28 | 3.23 | $ 16.41 | $ 34,130 |
| Lafayette, LA | 230 | 1.24 | 3.13 | $ 16.68 | $ 34,700 |
| Springfield, IL | 120 | 1.19 | 3.01 | $ 14.25 | $ 29,640 |
| Gadsden, AL | 40 | 1.19 | 3.00 | $ 12.60 | $ 26,210 |
Top paying metropolitan areas for Medical Transcriptionists:
| Metropolitan area | Employment (1) | Employment per thousand jobs | Location quotient (9) | Hourly mean wage | Annual mean wage (2) |
|---|---|---|---|---|---|
| Bridgeport-Stamford-Norwalk, CT | 110 | 0.30 | 0.77 | $ 24.85 | $ 51,700 |
| New Haven, CT | 70 | 0.25 | 0.63 | $ 23.85 | $ 49,600 |
| Hartford-West Hartford-East Hartford, CT | 560 | 1.03 | 2.61 | $ 23.75 | $ 49,400 |
| San Francisco-Oakland-Hayward, CA | (8) | (8) | (8) | $ 23.25 | $ 48,350 |
| Trenton, NJ | 30 | 0.14 | 0.36 | $ 22.97 | $ 47,780 |
| Bend-Redmond, OR | 70 | 0.80 | 2.03 | $ 22.63 | $ 47,070 |
| Chico, CA | 110 | 1.45 | 3.67 | $ 22.52 | $ 46,840 |
| Seattle-Tacoma-Bellevue, WA | 350 | 0.18 | 0.46 | $ 22.15 | $ 46,070 |
| Minneapolis-St. Paul-Bloomington, MN-WI | 340 | 0.19 | 0.47 | $ 22.11 | $ 46,000 |
| Duluth, MN-WI | 50 | 0.39 | 1.00 | $ 22.10 | $ 45,970 |
Nonmetropolitan areas with the highest employment in Medical Transcriptionists:
| Nonmetropolitan area | Employment (1) | Employment per thousand jobs | Location quotient (9) | Hourly mean wage | Annual mean wage (2) |
|---|---|---|---|---|---|
| Kansas nonmetropolitan area | 120 | 0.32 | 0.82 | $ 15.61 | $ 32,460 |
| West North Dakota nonmetropolitan area | 90 | 0.83 | 2.09 | $ 17.36 | $ 36,110 |
| Central East New York nonmetropolitan area | 80 | 0.52 | 1.31 | $ 16.71 | $ 34,760 |
| West Kentucky nonmetropolitan area | 80 | 0.54 | 1.36 | $ 17.07 | $ 35,510 |
| Southwest Maine nonmetropolitan area | 80 | 0.42 | 1.06 | $ 18.72 | $ 38,940 |
Nonmetropolitan areas with the highest concentration of jobs and location quotients in Medical Transcriptionists:
| Nonmetropolitan area | Employment (1) | Employment per thousand jobs | Location quotient (9) | Hourly mean wage | Annual mean wage (2) |
|---|---|---|---|---|---|
| Southern West Virginia nonmetropolitan area | 70 | 0.98 | 2.48 | $ 13.98 | $ 29,080 |
| West North Dakota nonmetropolitan area | 90 | 0.83 | 2.09 | $ 17.36 | $ 36,110 |
| West South Dakota nonmetropolitan area | 40 | 0.66 | 1.67 | $ 18.75 | $ 39,000 |
| Northeast Iowa nonmetropolitan area | 60 | 0.61 | 1.54 | $ 13.90 | $ 28,920 |
| East South Dakota nonmetropolitan area | 70 | 0.54 | 1.36 | $ 17.47 | $ 36,340 |
Top paying nonmetropolitan areas for Medical Transcriptionists:
| Nonmetropolitan area | Employment (1) | Employment per thousand jobs | Location quotient (9) | Hourly mean wage | Annual mean wage (2) |
|---|---|---|---|---|---|
| Northwest Minnesota nonmetropolitan area | 40 | 0.22 | 0.55 | $ 21.21 | $ 44,110 |
| South Central Wisconsin nonmetropolitan area | 40 | 0.21 | 0.52 | $ 20.20 | $ 42,020 |
| West Montana nonmetropolitan area | 40 | 0.47 | 1.19 | $ 19.69 | $ 40,950 |
| Capital/Northern New York nonmetropolitan area | 40 | 0.32 | 0.80 | $ 19.28 | $ 40,100 |
| Piedmont North Carolina nonmetropolitan area | 50 | 0.21 | 0.52 | $ 19.16 | $ 39,860 |
These estimates are calculated with data collected from employers in all industry sectors, all metropolitan and nonmetropolitan areas, and all states and the District of Columbia. The top employment and wage figures are provided above. The complete list is available in the downloadable XLS files.
The percentile wage estimate is the value of a wage below which a certain percent of workers fall. The median wage is the 50th percentile wage estimate—50 percent of workers earn less than the median and 50 percent of workers earn more than the median. More about percentile wages.
(1) Estimates for detailed occupations do not sum to the totals because the totals include occupations not shown separately. Estimates do not include self-employed workers.
(2) Annual wages have been calculated by multiplying the hourly mean wage by a "year-round, full-time" hours figure of 2,080 hours; for those occupations where there is not an hourly wage published, the annual wage has been directly calculated from the reported survey data.
(3) The relative standard error (RSE) is a measure of the reliability of a survey statistic. The smaller the relative standard error, the more precise the estimate.
(7) The value is less than .005 percent of industry employment.
(8) Estimate not released.
(9) The location quotient is the ratio of the area concentration of occupational employment to the national average concentration. A location quotient greater than one indicates the occupation has a higher share of employment than average, and a location quotient less than one indicates the occupation is less prevalent in the area than average.
Other OEWS estimates and related information:
May 2021 National Occupational Employment and Wage Estimates
May 2021 State Occupational Employment and Wage Estimates
May 2021 Metropolitan and Nonmetropolitan Area Occupational Employment and Wage Estimates
May 2021 National Industry-Specific Occupational Employment and Wage Estimates
Last Modified Date: March 31, 2022