
An official website of the United States government
An official website of the United States government
The .gov means it's official.
Federal government websites often end in .gov or .mil. Before sharing sensitive information,
make sure you're on a federal government site.
The site is secure.
The
https:// ensures that you are connecting to the official website and that any
information you provide is encrypted and transmitted securely.
Gather, analyze, compile, and report information regarding individuals or organizations to clients, or detect occurrences of unlawful acts or infractions of rules in private establishment.
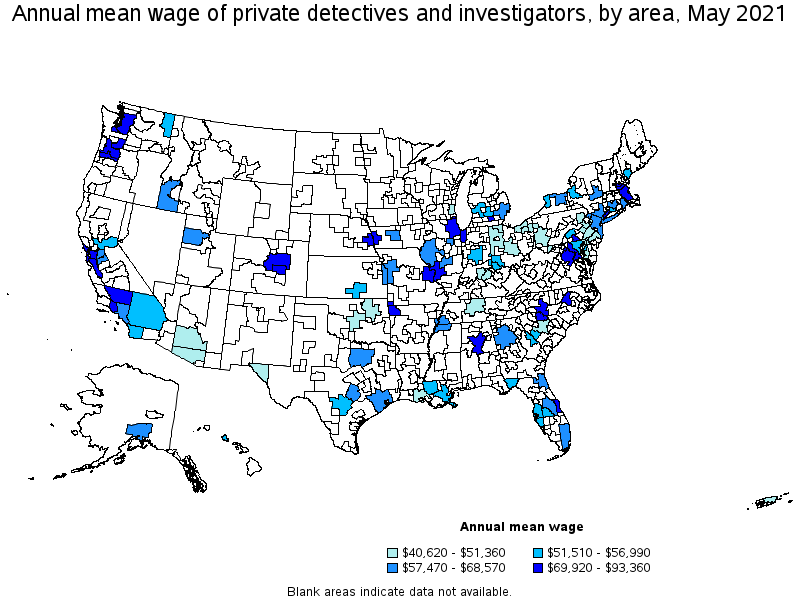
Employment estimate and mean wage estimates for Private Detectives and Investigators:
| Employment (1) | Employment RSE (3) |
Mean hourly wage |
Mean annual wage (2) |
Wage RSE (3) |
|---|---|---|---|---|
| 28,860 | 4.0 % | $ 29.31 | $ 60,970 | 1.5 % |
Percentile wage estimates for Private Detectives and Investigators:
| Percentile | 10% | 25% | 50% (Median) |
75% | 90% |
|---|---|---|---|---|---|
| Hourly Wage | $ 15.45 | $ 19.37 | $ 28.55 | $ 37.28 | $ 47.15 |
| Annual Wage (2) | $ 32,130 | $ 40,290 | $ 59,380 | $ 77,540 | $ 98,070 |
Industries with the highest published employment and wages for Private Detectives and Investigators are provided. For a list of all industries with employment in Private Detectives and Investigators, see the Create Customized Tables function.
Industries with the highest levels of employment in Private Detectives and Investigators:
| Industry | Employment (1) | Percent of industry employment | Hourly mean wage | Annual mean wage (2) |
|---|---|---|---|---|
| Investigation and Security Services | 6,680 | 0.73 | $ 26.40 | $ 54,910 |
| Management of Companies and Enterprises | 2,590 | 0.10 | $ 32.33 | $ 67,240 |
| Credit Intermediation and Related Activities (5221 and 5223 only) | 2,570 | 0.13 | $ 32.95 | $ 68,530 |
| Local Government, excluding schools and hospitals (OEWS Designation) | 2,290 | 0.04 | $ 32.20 | $ 66,970 |
| Computer Systems Design and Related Services | 1,920 | 0.08 | $ 27.50 | $ 57,210 |
Industries with the highest concentration of employment in Private Detectives and Investigators:
| Industry | Employment (1) | Percent of industry employment | Hourly mean wage | Annual mean wage (2) |
|---|---|---|---|---|
| Investigation and Security Services | 6,680 | 0.73 | $ 26.40 | $ 54,910 |
| Credit Intermediation and Related Activities (5221 and 5223 only) | 2,570 | 0.13 | $ 32.95 | $ 68,530 |
| Legal Services | 1,490 | 0.13 | $ 29.17 | $ 60,680 |
| Management of Companies and Enterprises | 2,590 | 0.10 | $ 32.33 | $ 67,240 |
| Couriers and Express Delivery Services | 750 | 0.08 | $ 36.94 | $ 76,830 |
Top paying industries for Private Detectives and Investigators:
| Industry | Employment (1) | Percent of industry employment | Hourly mean wage | Annual mean wage (2) |
|---|---|---|---|---|
| Securities, Commodity Contracts, and Other Financial Investments and Related Activities | 110 | 0.01 | $ 50.62 | $ 105,290 |
| Electric Power Generation, Transmission and Distribution | 160 | 0.04 | $ 47.59 | $ 98,980 |
| Scientific Research and Development Services | 60 | 0.01 | $ 45.81 | $ 95,280 |
| Aerospace Product and Parts Manufacturing | 120 | 0.03 | $ 44.09 | $ 91,710 |
| Merchant Wholesalers, Nondurable Goods (4242 and 4246 only) | (8) | (8) | $ 43.86 | $ 91,230 |
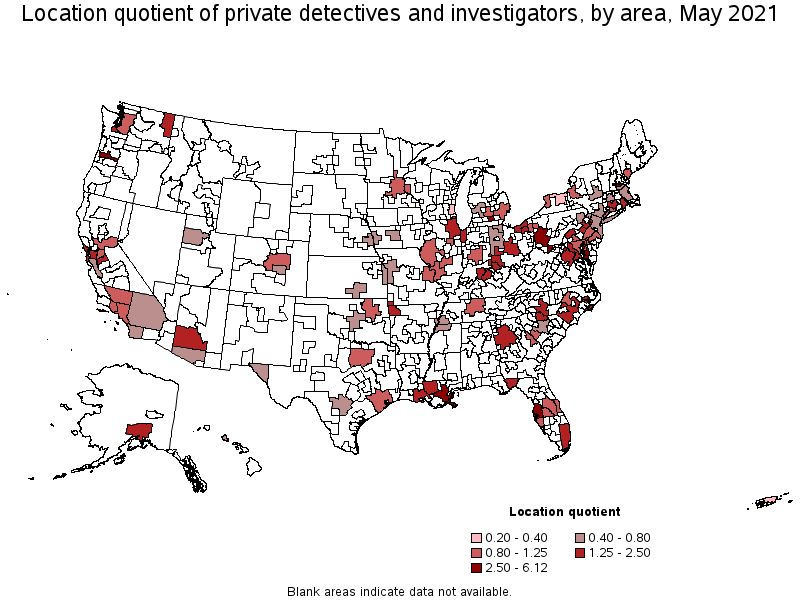
States and areas with the highest published employment, location quotients, and wages for Private Detectives and Investigators are provided. For a list of all areas with employment in Private Detectives and Investigators, see the Create Customized Tables function.
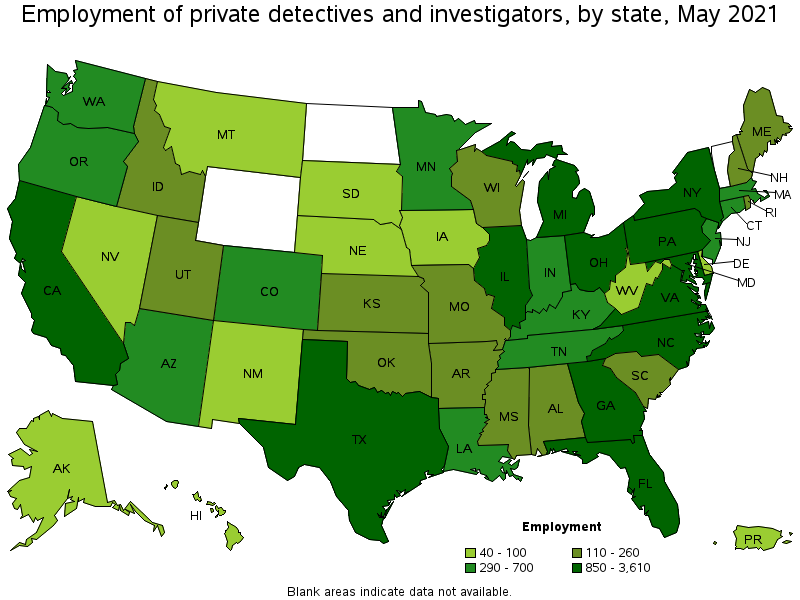
States with the highest employment level in Private Detectives and Investigators:
| State | Employment (1) | Employment per thousand jobs | Location quotient (9) | Hourly mean wage | Annual mean wage (2) |
|---|---|---|---|---|---|
| California | 3,610 | 0.22 | 1.07 | $ 31.33 | $ 65,160 |
| Florida | 2,630 | 0.31 | 1.49 | $ 28.53 | $ 59,350 |
| Texas | 2,360 | 0.19 | 0.94 | $ 27.84 | $ 57,910 |
| Pennsylvania | 2,180 | 0.39 | 1.91 | $ 24.40 | $ 50,740 |
| Ohio | 1,690 | 0.32 | 1.58 | $ 24.28 | $ 50,510 |
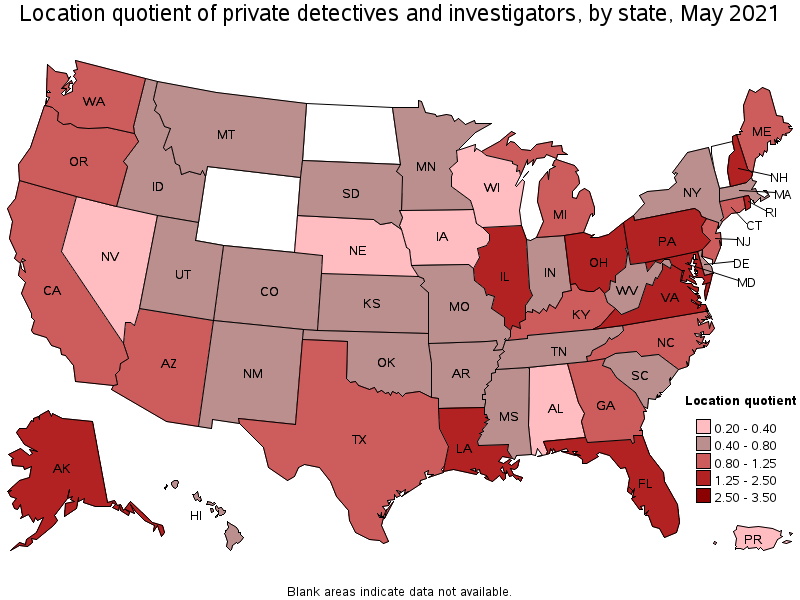
States with the highest concentration of jobs and location quotients in Private Detectives and Investigators:
| State | Employment (1) | Employment per thousand jobs | Location quotient (9) | Hourly mean wage | Annual mean wage (2) |
|---|---|---|---|---|---|
| Rhode Island | 210 | 0.45 | 2.20 | $ 30.92 | $ 64,310 |
| Virginia | 1,500 | 0.40 | 1.95 | $ 36.44 | $ 75,800 |
| Pennsylvania | 2,180 | 0.39 | 1.91 | $ 24.40 | $ 50,740 |
| Louisiana | 660 | 0.37 | 1.80 | $ 24.42 | $ 50,790 |
| Maryland | 850 | 0.33 | 1.64 | $ 27.04 | $ 56,250 |
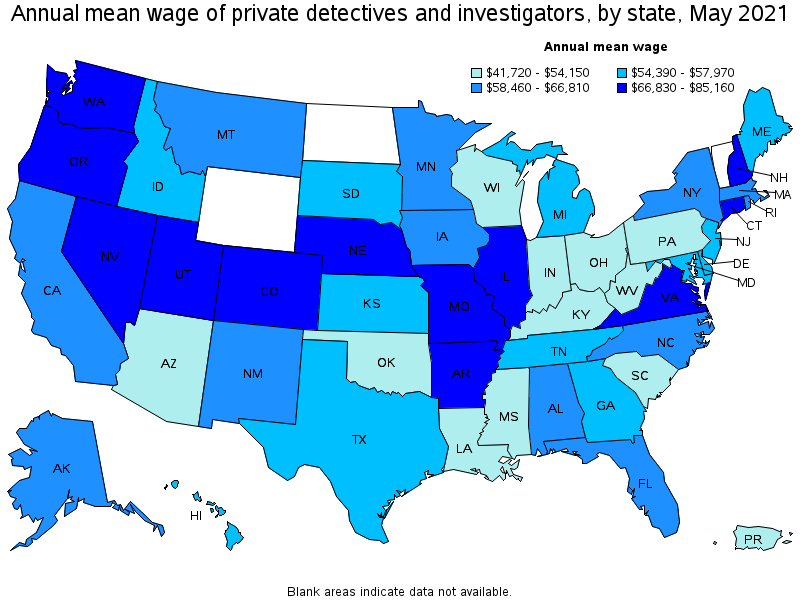
Top paying states for Private Detectives and Investigators:
| State | Employment (1) | Employment per thousand jobs | Location quotient (9) | Hourly mean wage | Annual mean wage (2) |
|---|---|---|---|---|---|
| Colorado | 360 | 0.14 | 0.68 | $ 40.94 | $ 85,160 |
| Arkansas | 170 | 0.15 | 0.71 | $ 39.08 | $ 81,280 |
| Oregon | 400 | 0.22 | 1.06 | $ 37.73 | $ 78,480 |
| Virginia | 1,500 | 0.40 | 1.95 | $ 36.44 | $ 75,800 |
| Nevada | 100 | 0.08 | 0.38 | $ 35.99 | $ 74,860 |
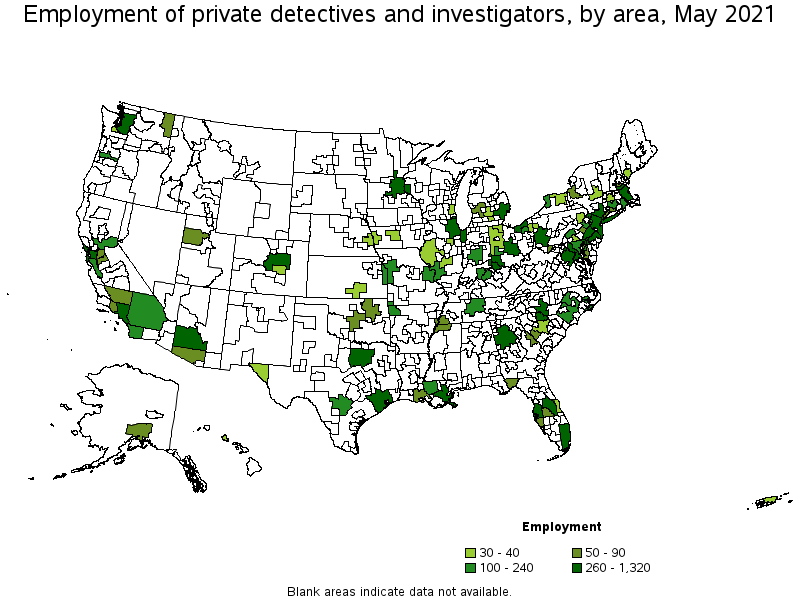
Metropolitan areas with the highest employment level in Private Detectives and Investigators:
| Metropolitan area | Employment (1) | Employment per thousand jobs | Location quotient (9) | Hourly mean wage | Annual mean wage (2) |
|---|---|---|---|---|---|
| Los Angeles-Long Beach-Anaheim, CA | 1,320 | 0.23 | 1.13 | $ 30.04 | $ 62,490 |
| Chicago-Naperville-Elgin, IL-IN-WI | 1,260 | 0.30 | 1.46 | $ 34.76 | $ 72,300 |
| New York-Newark-Jersey City, NY-NJ-PA | 1,210 | 0.14 | 0.68 | $ 32.58 | $ 67,760 |
| Washington-Arlington-Alexandria, DC-VA-MD-WV | 1,030 | 0.35 | 1.71 | $ 39.20 | $ 81,530 |
| Pittsburgh, PA | 1,020 | 0.98 | 4.80 | $ 23.97 | $ 49,860 |
| Miami-Fort Lauderdale-West Palm Beach, FL | 880 | 0.36 | 1.76 | $ 29.91 | $ 62,210 |
| Atlanta-Sandy Springs-Roswell, GA | 800 | 0.31 | 1.52 | $ 28.06 | $ 58,370 |
| Tampa-St. Petersburg-Clearwater, FL | 660 | 0.51 | 2.50 | $ 27.23 | $ 56,630 |
| San Francisco-Oakland-Hayward, CA | 630 | 0.28 | 1.38 | $ 36.47 | $ 75,860 |
| Dallas-Fort Worth-Arlington, TX | 630 | 0.17 | 0.85 | $ 30.61 | $ 63,680 |
Metropolitan areas with the highest concentration of jobs and location quotients in Private Detectives and Investigators:
| Metropolitan area | Employment (1) | Employment per thousand jobs | Location quotient (9) | Hourly mean wage | Annual mean wage (2) |
|---|---|---|---|---|---|
| Pittsburgh, PA | 1,020 | 0.98 | 4.80 | $ 23.97 | $ 49,860 |
| Jackson, MI | 40 | 0.78 | 3.79 | $ 44.89 | $ 93,360 |
| Salem, OR | 130 | 0.75 | 3.67 | $ 36.28 | $ 75,460 |
| New Orleans-Metairie, LA | 270 | 0.54 | 2.62 | $ 24.76 | $ 51,510 |
| Manchester, NH | 60 | 0.53 | 2.61 | $ 35.08 | $ 72,960 |
| Tampa-St. Petersburg-Clearwater, FL | 660 | 0.51 | 2.50 | $ 27.23 | $ 56,630 |
| Lafayette, LA | 90 | 0.47 | 2.27 | $ 21.57 | $ 44,860 |
| Cincinnati, OH-KY-IN | 460 | 0.45 | 2.21 | $ 26.24 | $ 54,570 |
| Cleveland-Elyria, OH | 400 | 0.42 | 2.04 | $ 23.35 | $ 48,570 |
| Charlotte-Concord-Gastonia, NC-SC | 480 | 0.40 | 1.94 | $ 37.16 | $ 77,290 |
Top paying metropolitan areas for Private Detectives and Investigators:
| Metropolitan area | Employment (1) | Employment per thousand jobs | Location quotient (9) | Hourly mean wage | Annual mean wage (2) |
|---|---|---|---|---|---|
| Jackson, MI | 40 | 0.78 | 3.79 | $ 44.89 | $ 93,360 |
| Bakersfield, CA | 50 | 0.17 | 0.83 | $ 43.79 | $ 91,080 |
| Fayetteville-Springdale-Rogers, AR-MO | 100 | 0.39 | 1.90 | $ 42.19 | $ 87,760 |
| Denver-Aurora-Lakewood, CO | 260 | 0.18 | 0.86 | $ 41.84 | $ 87,020 |
| Washington-Arlington-Alexandria, DC-VA-MD-WV | 1,030 | 0.35 | 1.71 | $ 39.20 | $ 81,530 |
| Olympia-Tumwater, WA | 40 | 0.38 | 1.85 | $ 38.67 | $ 80,440 |
| Colorado Springs, CO | 30 | 0.12 | 0.59 | $ 37.98 | $ 79,000 |
| Portland-Vancouver-Hillsboro, OR-WA | (8) | (8) | (8) | $ 37.91 | $ 78,860 |
| Bridgeport-Stamford-Norwalk, CT | 70 | 0.19 | 0.93 | $ 37.49 | $ 77,990 |
| Charlotte-Concord-Gastonia, NC-SC | 480 | 0.40 | 1.94 | $ 37.16 | $ 77,290 |
Nonmetropolitan areas with the highest employment in Private Detectives and Investigators:
| Nonmetropolitan area | Employment (1) | Employment per thousand jobs | Location quotient (9) | Hourly mean wage | Annual mean wage (2) |
|---|---|---|---|---|---|
| Southeast Coastal North Carolina nonmetropolitan area | 100 | 0.40 | 1.95 | (8) | (8) |
| Maryland nonmetropolitan area | 70 | 1.25 | 6.12 | $ 24.33 | $ 50,610 |
| West Northwestern Ohio nonmetropolitan area | 30 | 0.13 | 0.65 | $ 22.88 | $ 47,580 |
| West Central Illinois nonmetropolitan area | 30 | 0.20 | 0.98 | $ 29.11 | $ 60,550 |
Nonmetropolitan areas with the highest concentration of jobs and location quotients in Private Detectives and Investigators:
| Nonmetropolitan area | Employment (1) | Employment per thousand jobs | Location quotient (9) | Hourly mean wage | Annual mean wage (2) |
|---|---|---|---|---|---|
| Maryland nonmetropolitan area | 70 | 1.25 | 6.12 | $ 24.33 | $ 50,610 |
| Southeast Coastal North Carolina nonmetropolitan area | 100 | 0.40 | 1.95 | (8) | (8) |
| West Central Illinois nonmetropolitan area | 30 | 0.20 | 0.98 | $ 29.11 | $ 60,550 |
| West Northwestern Ohio nonmetropolitan area | 30 | 0.13 | 0.65 | $ 22.88 | $ 47,580 |
Top paying nonmetropolitan areas for Private Detectives and Investigators:
| Nonmetropolitan area | Employment (1) | Employment per thousand jobs | Location quotient (9) | Hourly mean wage | Annual mean wage (2) |
|---|---|---|---|---|---|
| West Central Illinois nonmetropolitan area | 30 | 0.20 | 0.98 | $ 29.11 | $ 60,550 |
| Maryland nonmetropolitan area | 70 | 1.25 | 6.12 | $ 24.33 | $ 50,610 |
| West Northwestern Ohio nonmetropolitan area | 30 | 0.13 | 0.65 | $ 22.88 | $ 47,580 |
These estimates are calculated with data collected from employers in all industry sectors, all metropolitan and nonmetropolitan areas, and all states and the District of Columbia. The top employment and wage figures are provided above. The complete list is available in the downloadable XLS files.
The percentile wage estimate is the value of a wage below which a certain percent of workers fall. The median wage is the 50th percentile wage estimate—50 percent of workers earn less than the median and 50 percent of workers earn more than the median. More about percentile wages.
(1) Estimates for detailed occupations do not sum to the totals because the totals include occupations not shown separately. Estimates do not include self-employed workers.
(2) Annual wages have been calculated by multiplying the hourly mean wage by a "year-round, full-time" hours figure of 2,080 hours; for those occupations where there is not an hourly wage published, the annual wage has been directly calculated from the reported survey data.
(3) The relative standard error (RSE) is a measure of the reliability of a survey statistic. The smaller the relative standard error, the more precise the estimate.
(8) Estimate not released.
(9) The location quotient is the ratio of the area concentration of occupational employment to the national average concentration. A location quotient greater than one indicates the occupation has a higher share of employment than average, and a location quotient less than one indicates the occupation is less prevalent in the area than average.
Other OEWS estimates and related information:
May 2021 National Occupational Employment and Wage Estimates
May 2021 State Occupational Employment and Wage Estimates
May 2021 Metropolitan and Nonmetropolitan Area Occupational Employment and Wage Estimates
May 2021 National Industry-Specific Occupational Employment and Wage Estimates
Last Modified Date: March 31, 2022