
An official website of the United States government
An official website of the United States government
The .gov means it's official.
Federal government websites often end in .gov or .mil. Before sharing sensitive information,
make sure you're on a federal government site.
The site is secure.
The
https:// ensures that you are connecting to the official website and that any
information you provide is encrypted and transmitted securely.
Perform a variety of food preparation duties other than cooking, such as preparing cold foods and shellfish, slicing meat, and brewing coffee or tea.
Employment estimate and mean wage estimates for Food Preparation Workers:
| Employment (1) | Employment RSE (3) |
Mean hourly wage |
Mean annual wage (2) |
Wage RSE (3) |
|---|---|---|---|---|
| 783,350 | 1.7 % | $ 13.85 | $ 28,810 | 0.5 % |
Percentile wage estimates for Food Preparation Workers:
| Percentile | 10% | 25% | 50% (Median) |
75% | 90% |
|---|---|---|---|---|---|
| Hourly Wage | $ 9.39 | $ 11.31 | $ 13.84 | $ 15.07 | $ 18.30 |
| Annual Wage (2) | $ 19,520 | $ 23,520 | $ 28,780 | $ 31,340 | $ 38,060 |
Industries with the highest published employment and wages for Food Preparation Workers are provided. For a list of all industries with employment in Food Preparation Workers, see the Create Customized Tables function.
Industries with the highest levels of employment in Food Preparation Workers:
| Industry | Employment (1) | Percent of industry employment | Hourly mean wage | Annual mean wage (2) |
|---|---|---|---|---|
| Restaurants and Other Eating Places | 392,330 | 4.16 | $ 13.20 | $ 27,450 |
| Food and Beverage Stores (4451 and 4452 only) | 176,760 | 5.98 | $ 14.43 | $ 30,010 |
| Special Food Services | 38,850 | 8.20 | $ 14.26 | $ 29,650 |
| General Merchandise Stores | 22,180 | 0.72 | $ 17.14 | $ 35,660 |
| Elementary and Secondary Schools | 20,500 | 0.25 | $ 15.27 | $ 31,770 |
Industries with the highest concentration of employment in Food Preparation Workers:
| Industry | Employment (1) | Percent of industry employment | Hourly mean wage | Annual mean wage (2) |
|---|---|---|---|---|
| Special Food Services | 38,850 | 8.20 | $ 14.26 | $ 29,650 |
| Food and Beverage Stores (4451 and 4452 only) | 176,760 | 5.98 | $ 14.43 | $ 30,010 |
| Restaurants and Other Eating Places | 392,330 | 4.16 | $ 13.20 | $ 27,450 |
| Vending Machine Operators | 770 | 2.61 | $ 13.97 | $ 29,060 |
| Other Food Manufacturing | 5,600 | 2.39 | $ 15.69 | $ 32,620 |
Top paying industries for Food Preparation Workers:
| Industry | Employment (1) | Percent of industry employment | Hourly mean wage | Annual mean wage (2) |
|---|---|---|---|---|
| Deep Sea, Coastal, and Great Lakes Water Transportation | (8) | (8) | $ 25.15 | $ 52,320 |
| Navigational, Measuring, Electromedical, and Control Instruments Manufacturing | 30 | 0.01 | $ 19.96 | $ 41,520 |
| Dairy Product Manufacturing | 320 | 0.21 | $ 18.86 | $ 39,220 |
| Computer Systems Design and Related Services | 30 | (7) | $ 18.46 | $ 38,400 |
| Management of Companies and Enterprises | 560 | 0.02 | $ 18.41 | $ 38,280 |
States and areas with the highest published employment, location quotients, and wages for Food Preparation Workers are provided. For a list of all areas with employment in Food Preparation Workers, see the Create Customized Tables function.
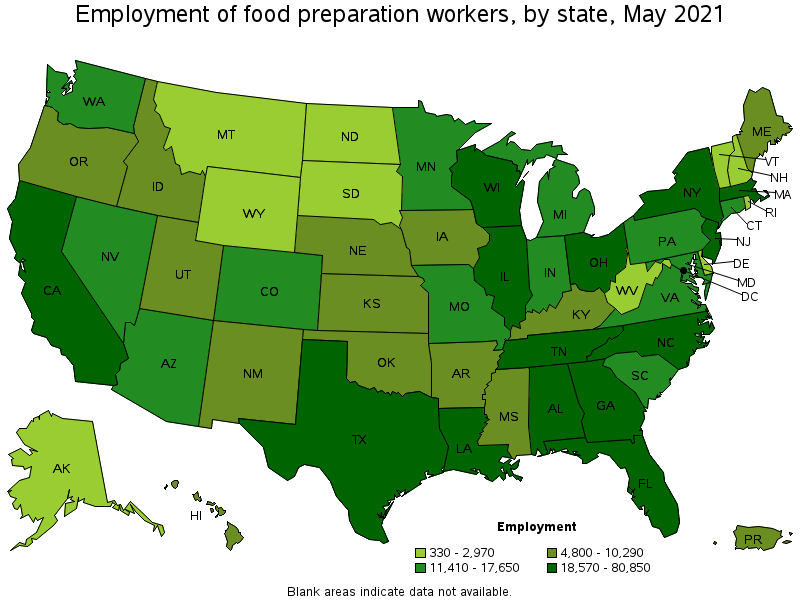
States with the highest employment level in Food Preparation Workers:
| State | Employment (1) | Employment per thousand jobs | Location quotient (9) | Hourly mean wage | Annual mean wage (2) |
|---|---|---|---|---|---|
| California | 80,850 | 4.89 | 0.88 | $ 16.70 | $ 34,730 |
| Florida | 63,260 | 7.35 | 1.32 | $ 13.68 | $ 28,450 |
| Texas | 57,250 | 4.68 | 0.84 | $ 13.32 | $ 27,710 |
| New York | 43,160 | 4.98 | 0.90 | $ 16.62 | $ 34,560 |
| Illinois | 41,840 | 7.45 | 1.34 | $ 13.87 | $ 28,850 |
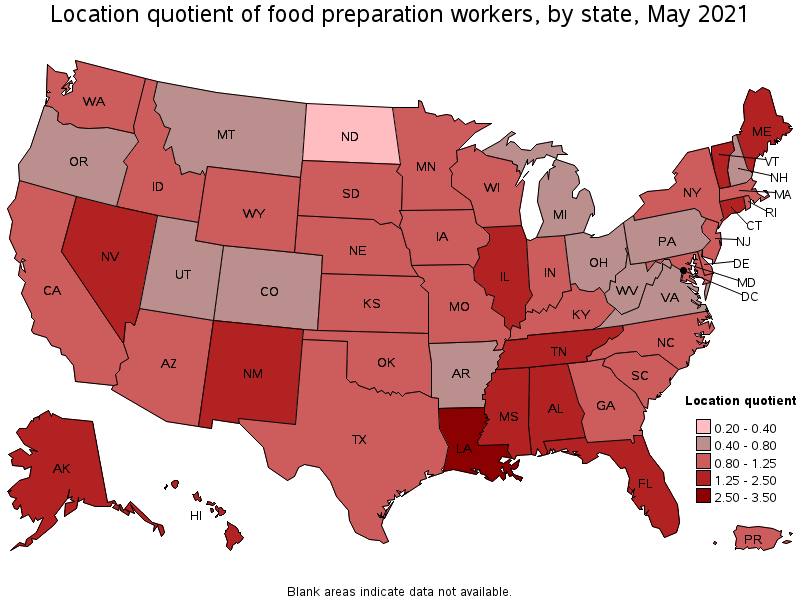
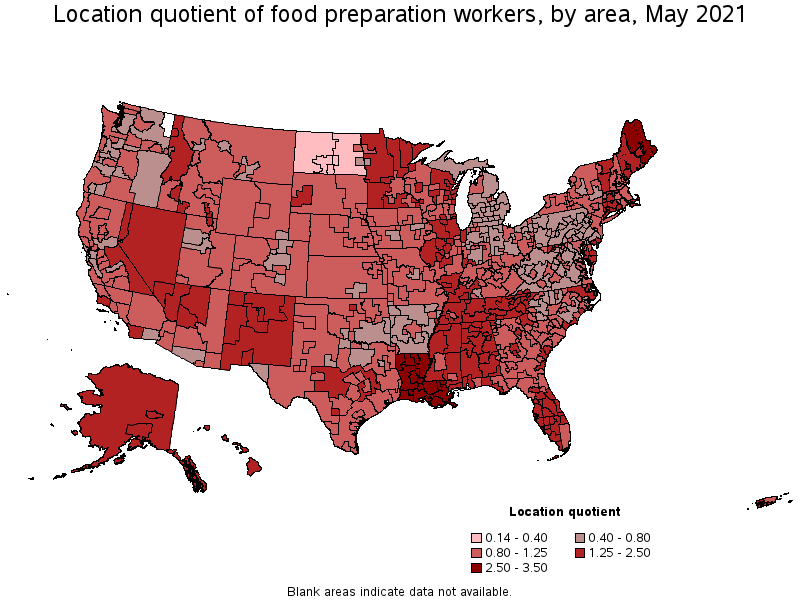
States with the highest concentration of jobs and location quotients in Food Preparation Workers:
| State | Employment (1) | Employment per thousand jobs | Location quotient (9) | Hourly mean wage | Annual mean wage (2) |
|---|---|---|---|---|---|
| Louisiana | 29,010 | 16.18 | 2.91 | $ 9.88 | $ 20,560 |
| Maine | 6,940 | 11.72 | 2.11 | $ 15.00 | $ 31,210 |
| Alaska | 2,970 | 10.04 | 1.81 | $ 15.59 | $ 32,430 |
| Alabama | 18,840 | 9.77 | 1.76 | $ 10.56 | $ 21,970 |
| Nevada | 11,890 | 9.23 | 1.66 | $ 14.05 | $ 29,230 |
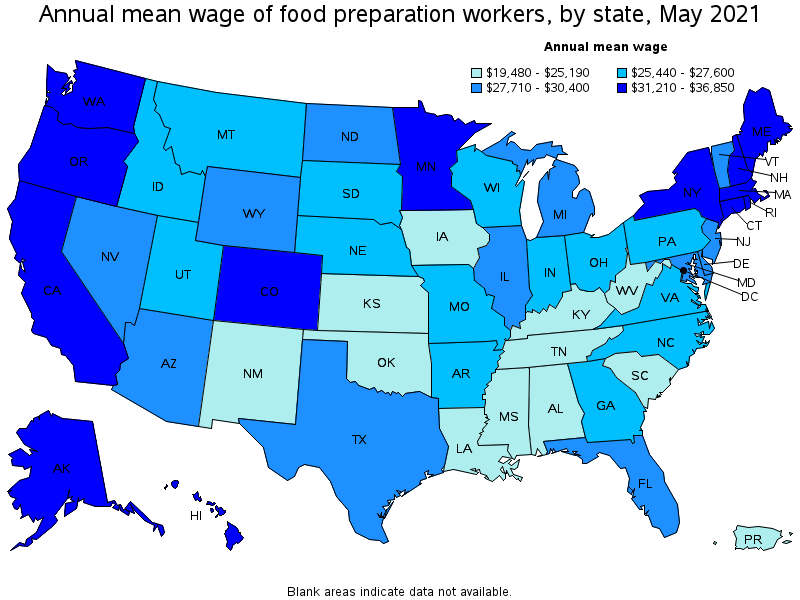
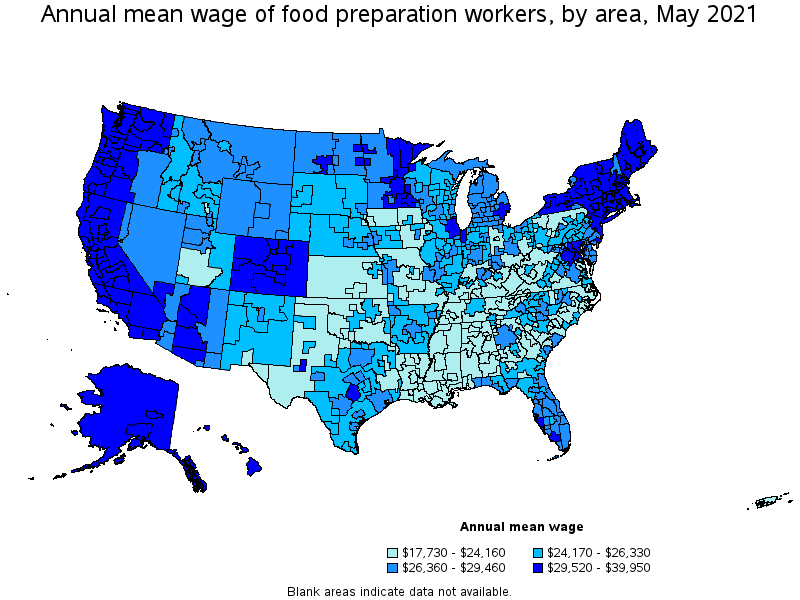
Top paying states for Food Preparation Workers:
| State | Employment (1) | Employment per thousand jobs | Location quotient (9) | Hourly mean wage | Annual mean wage (2) |
|---|---|---|---|---|---|
| District of Columbia | 2,650 | 4.01 | 0.72 | $ 17.72 | $ 36,850 |
| Washington | 14,370 | 4.48 | 0.81 | $ 17.61 | $ 36,630 |
| Hawaii | 4,800 | 8.76 | 1.57 | $ 16.76 | $ 34,860 |
| California | 80,850 | 4.89 | 0.88 | $ 16.70 | $ 34,730 |
| New York | 43,160 | 4.98 | 0.90 | $ 16.62 | $ 34,560 |
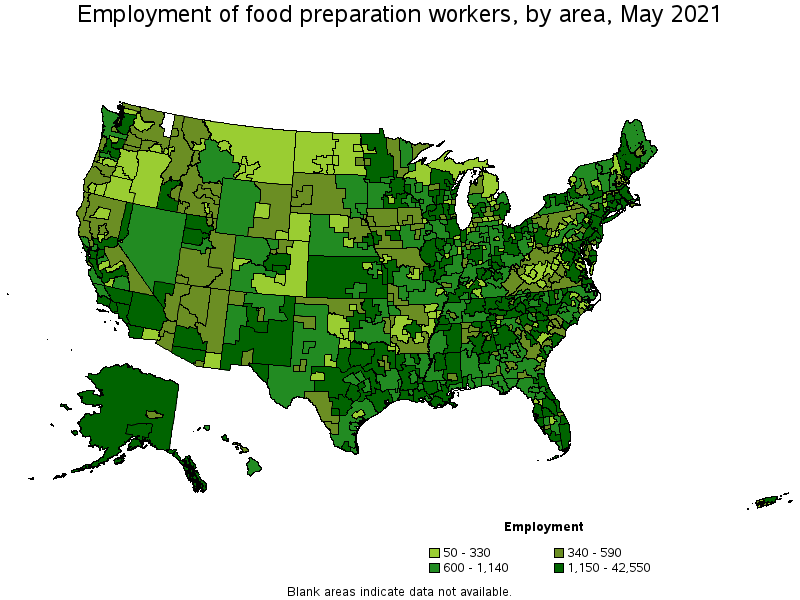
Metropolitan areas with the highest employment level in Food Preparation Workers:
| Metropolitan area | Employment (1) | Employment per thousand jobs | Location quotient (9) | Hourly mean wage | Annual mean wage (2) |
|---|---|---|---|---|---|
| New York-Newark-Jersey City, NY-NJ-PA | 42,550 | 4.90 | 0.88 | $ 16.76 | $ 34,860 |
| Los Angeles-Long Beach-Anaheim, CA | 32,470 | 5.68 | 1.02 | $ 16.32 | $ 33,950 |
| Chicago-Naperville-Elgin, IL-IN-WI | 32,140 | 7.59 | 1.37 | $ 14.35 | $ 29,840 |
| Atlanta-Sandy Springs-Roswell, GA | 17,580 | 6.80 | 1.22 | $ 13.06 | $ 27,160 |
| Miami-Fort Lauderdale-West Palm Beach, FL | 15,450 | 6.30 | 1.13 | $ 14.12 | $ 29,380 |
| Houston-The Woodlands-Sugar Land, TX | 14,990 | 5.18 | 0.93 | $ 13.83 | $ 28,760 |
| Washington-Arlington-Alexandria, DC-VA-MD-WV | 12,840 | 4.38 | 0.79 | $ 15.54 | $ 32,330 |
| Boston-Cambridge-Nashua, MA-NH | 12,730 | 4.92 | 0.89 | $ 16.72 | $ 34,780 |
| Dallas-Fort Worth-Arlington, TX | 11,730 | 3.27 | 0.59 | $ 13.44 | $ 27,960 |
| Minneapolis-St. Paul-Bloomington, MN-WI | 11,260 | 6.18 | 1.11 | $ 15.51 | $ 32,260 |
Metropolitan areas with the highest concentration of jobs and location quotients in Food Preparation Workers:
| Metropolitan area | Employment (1) | Employment per thousand jobs | Location quotient (9) | Hourly mean wage | Annual mean wage (2) |
|---|---|---|---|---|---|
| Monroe, LA | 1,390 | 19.08 | 3.43 | $ 9.29 | $ 19,330 |
| Shreveport-Bossier City, LA | 3,030 | 18.70 | 3.36 | $ 9.64 | $ 20,060 |
| Lafayette, LA | 3,460 | 18.52 | 3.33 | $ 9.61 | $ 19,990 |
| Hammond, LA | 790 | 17.87 | 3.21 | $ 9.57 | $ 19,900 |
| Baton Rouge, LA | 6,170 | 16.80 | 3.02 | $ 10.14 | $ 21,100 |
| Alexandria, LA | 960 | 16.49 | 2.97 | $ 9.53 | $ 19,820 |
| Houma-Thibodaux, LA | 1,280 | 16.10 | 2.90 | $ 10.01 | $ 20,810 |
| Lake Charles, LA | 1,390 | 15.36 | 2.76 | $ 10.07 | $ 20,940 |
| Ocean City, NJ | 600 | 15.28 | 2.75 | $ 13.32 | $ 27,700 |
| Lewiston-Auburn, ME | 720 | 15.14 | 2.72 | $ 14.23 | $ 29,590 |
Top paying metropolitan areas for Food Preparation Workers:
| Metropolitan area | Employment (1) | Employment per thousand jobs | Location quotient (9) | Hourly mean wage | Annual mean wage (2) |
|---|---|---|---|---|---|
| San Francisco-Oakland-Hayward, CA | 6,480 | 2.89 | 0.52 | $ 19.21 | $ 39,950 |
| San Jose-Sunnyvale-Santa Clara, CA | 4,010 | 3.75 | 0.67 | $ 18.86 | $ 39,230 |
| Seattle-Tacoma-Bellevue, WA | 8,010 | 4.18 | 0.75 | $ 18.43 | $ 38,340 |
| Santa Rosa, CA | 880 | 4.59 | 0.82 | $ 18.11 | $ 37,670 |
| Napa, CA | 410 | 5.96 | 1.07 | $ 18.09 | $ 37,640 |
| Kahului-Wailuku-Lahaina, HI | 540 | 8.48 | 1.53 | $ 17.94 | $ 37,310 |
| Olympia-Tumwater, WA | 490 | 4.41 | 0.79 | $ 17.49 | $ 36,370 |
| Santa Cruz-Watsonville, CA | 580 | 6.26 | 1.13 | $ 17.39 | $ 36,170 |
| Mount Vernon-Anacortes, WA | 230 | 4.95 | 0.89 | $ 17.35 | $ 36,100 |
| Vallejo-Fairfield, CA | 670 | 5.17 | 0.93 | $ 17.16 | $ 35,690 |
Nonmetropolitan areas with the highest employment in Food Preparation Workers:
| Nonmetropolitan area | Employment (1) | Employment per thousand jobs | Location quotient (9) | Hourly mean wage | Annual mean wage (2) |
|---|---|---|---|---|---|
| Southwest Maine nonmetropolitan area | 2,480 | 13.57 | 2.44 | $ 14.97 | $ 31,130 |
| Kansas nonmetropolitan area | 2,010 | 5.35 | 0.96 | $ 11.05 | $ 22,990 |
| Northeast Mississippi nonmetropolitan area | 1,870 | 8.43 | 1.52 | $ 10.08 | $ 20,970 |
| Eastern New Mexico nonmetropolitan area | 1,630 | 11.16 | 2.01 | $ 11.74 | $ 24,420 |
| Northeast Alabama nonmetropolitan area | 1,570 | 11.03 | 1.98 | $ 9.95 | $ 20,690 |
Nonmetropolitan areas with the highest concentration of jobs and location quotients in Food Preparation Workers:
| Nonmetropolitan area | Employment (1) | Employment per thousand jobs | Location quotient (9) | Hourly mean wage | Annual mean wage (2) |
|---|---|---|---|---|---|
| Northeast Louisiana nonmetropolitan area | 1,050 | 17.01 | 3.06 | $ 9.21 | $ 19,150 |
| Central Louisiana nonmetropolitan area | 1,220 | 16.57 | 2.98 | $ 9.38 | $ 19,510 |
| Northeast Maine nonmetropolitan area | 1,100 | 16.37 | 2.94 | $ 14.66 | $ 30,490 |
| Southwest Louisiana nonmetropolitan area | 1,000 | 15.29 | 2.75 | $ 9.12 | $ 18,960 |
| Southwest Maine nonmetropolitan area | 2,480 | 13.57 | 2.44 | $ 14.97 | $ 31,130 |
Top paying nonmetropolitan areas for Food Preparation Workers:
| Nonmetropolitan area | Employment (1) | Employment per thousand jobs | Location quotient (9) | Hourly mean wage | Annual mean wage (2) |
|---|---|---|---|---|---|
| Hawaii / Kauai nonmetropolitan area | 910 | 10.24 | 1.84 | $ 18.10 | $ 37,650 |
| Northwest Colorado nonmetropolitan area | 810 | 6.90 | 1.24 | $ 17.21 | $ 35,800 |
| Massachusetts nonmetropolitan area | 510 | 8.84 | 1.59 | $ 16.59 | $ 34,500 |
| North Coast Region of California nonmetropolitan area | 450 | 4.54 | 0.82 | $ 16.29 | $ 33,890 |
| Western Washington nonmetropolitan area | 710 | 5.91 | 1.06 | $ 16.25 | $ 33,790 |
These estimates are calculated with data collected from employers in all industry sectors, all metropolitan and nonmetropolitan areas, and all states and the District of Columbia. The top employment and wage figures are provided above. The complete list is available in the downloadable XLS files.
The percentile wage estimate is the value of a wage below which a certain percent of workers fall. The median wage is the 50th percentile wage estimate—50 percent of workers earn less than the median and 50 percent of workers earn more than the median. More about percentile wages.
(1) Estimates for detailed occupations do not sum to the totals because the totals include occupations not shown separately. Estimates do not include self-employed workers.
(2) Annual wages have been calculated by multiplying the hourly mean wage by a "year-round, full-time" hours figure of 2,080 hours; for those occupations where there is not an hourly wage published, the annual wage has been directly calculated from the reported survey data.
(3) The relative standard error (RSE) is a measure of the reliability of a survey statistic. The smaller the relative standard error, the more precise the estimate.
(7) The value is less than .005 percent of industry employment.
(8) Estimate not released.
(9) The location quotient is the ratio of the area concentration of occupational employment to the national average concentration. A location quotient greater than one indicates the occupation has a higher share of employment than average, and a location quotient less than one indicates the occupation is less prevalent in the area than average.
Other OEWS estimates and related information:
May 2021 National Occupational Employment and Wage Estimates
May 2021 State Occupational Employment and Wage Estimates
May 2021 Metropolitan and Nonmetropolitan Area Occupational Employment and Wage Estimates
May 2021 National Industry-Specific Occupational Employment and Wage Estimates
Last Modified Date: March 31, 2022