
An official website of the United States government
An official website of the United States government
The .gov means it's official.
Federal government websites often end in .gov or .mil. Before sharing sensitive information,
make sure you're on a federal government site.
The site is secure.
The
https:// ensures that you are connecting to the official website and that any
information you provide is encrypted and transmitted securely.
Mix and serve drinks to patrons, directly or through waitstaff.
Employment estimate and mean wage estimates for Bartenders:
| Employment (1) | Employment RSE (3) |
Mean hourly wage |
Mean annual wage (2) |
Wage RSE (3) |
|---|---|---|---|---|
| 485,330 | 1.4 % | $ 14.59 | $ 30,340 | 1.0 % |
Percentile wage estimates for Bartenders:
| Percentile | 10% | 25% | 50% (Median) |
75% | 90% |
|---|---|---|---|---|---|
| Hourly Wage | $ 8.59 | $ 9.89 | $ 12.67 | $ 16.41 | $ 22.94 |
| Annual Wage (2) | $ 17,870 | $ 20,560 | $ 26,350 | $ 34,120 | $ 47,710 |
Industries with the highest published employment and wages for Bartenders are provided. For a list of all industries with employment in Bartenders, see the Create Customized Tables function.
Industries with the highest levels of employment in Bartenders:
| Industry | Employment (1) | Percent of industry employment | Hourly mean wage | Annual mean wage (2) |
|---|---|---|---|---|
| Restaurants and Other Eating Places | 217,290 | 2.30 | $ 15.63 | $ 32,510 |
| Drinking Places (Alcoholic Beverages) | 134,980 | 43.98 | $ 13.63 | $ 28,350 |
| Civic and Social Organizations | 28,860 | 11.04 | $ 11.55 | $ 24,030 |
| Beverage Manufacturing | 26,100 | 9.30 | $ 15.20 | $ 31,610 |
| Traveler Accommodation | 26,060 | 1.90 | $ 15.03 | $ 31,270 |
Industries with the highest concentration of employment in Bartenders:
| Industry | Employment (1) | Percent of industry employment | Hourly mean wage | Annual mean wage (2) |
|---|---|---|---|---|
| Drinking Places (Alcoholic Beverages) | 134,980 | 43.98 | $ 13.63 | $ 28,350 |
| Civic and Social Organizations | 28,860 | 11.04 | $ 11.55 | $ 24,030 |
| Beverage Manufacturing | 26,100 | 9.30 | $ 15.20 | $ 31,610 |
| Gambling Industries | 5,660 | 3.12 | $ 12.83 | $ 26,680 |
| Restaurants and Other Eating Places | 217,290 | 2.30 | $ 15.63 | $ 32,510 |
Top paying industries for Bartenders:
| Industry | Employment (1) | Percent of industry employment | Hourly mean wage | Annual mean wage (2) |
|---|---|---|---|---|
| Other Personal Services | 190 | 0.06 | $ 17.77 | $ 36,960 |
| Merchant Wholesalers, Nondurable Goods (4244 and 4248 only) | 360 | 0.04 | $ 17.73 | $ 36,880 |
| General Merchandise Stores | (8) | (8) | $ 16.93 | $ 35,220 |
| Continuing Care Retirement Communities and Assisted Living Facilities for the Elderly | 310 | 0.04 | $ 16.49 | $ 34,300 |
| Colleges, Universities, and Professional Schools | 200 | 0.01 | $ 16.39 | $ 34,080 |
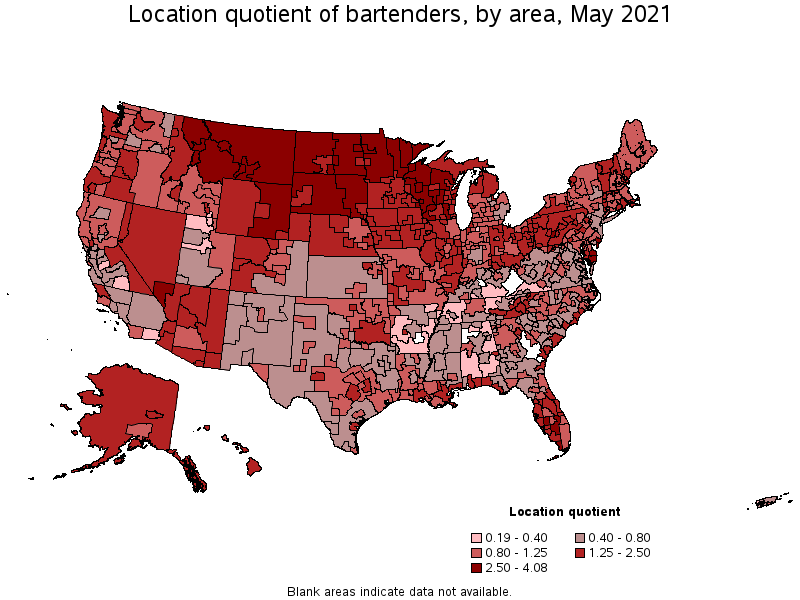
States and areas with the highest published employment, location quotients, and wages for Bartenders are provided. For a list of all areas with employment in Bartenders, see the Create Customized Tables function.
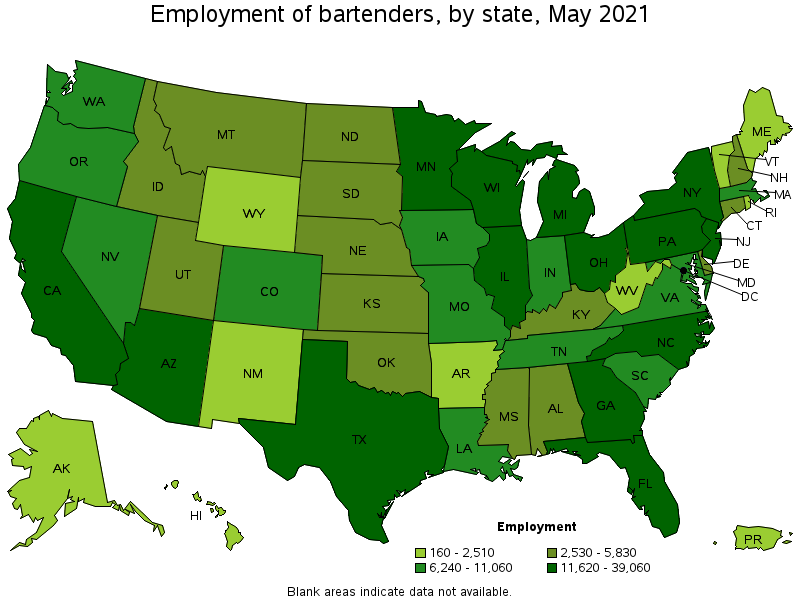
States with the highest employment level in Bartenders:
| State | Employment (1) | Employment per thousand jobs | Location quotient (9) | Hourly mean wage | Annual mean wage (2) |
|---|---|---|---|---|---|
| California | 39,060 | 2.36 | 0.69 | $ 18.30 | $ 38,070 |
| Texas | 38,600 | 3.16 | 0.92 | $ 13.33 | $ 27,730 |
| Florida | 35,890 | 4.17 | 1.21 | $ 13.92 | $ 28,950 |
| Wisconsin | 22,330 | 8.11 | 2.35 | $ 11.46 | $ 23,840 |
| Ohio | 22,170 | 4.26 | 1.24 | $ 12.62 | $ 26,250 |
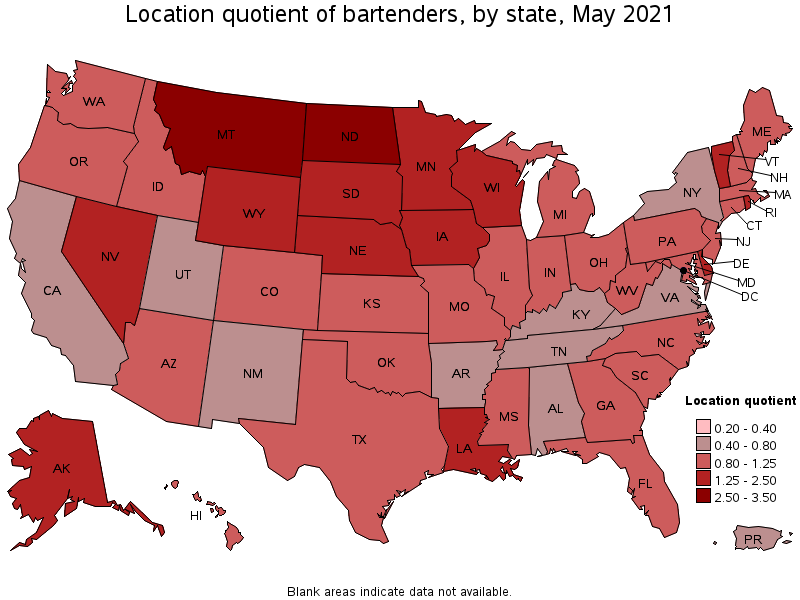
States with the highest concentration of jobs and location quotients in Bartenders:
| State | Employment (1) | Employment per thousand jobs | Location quotient (9) | Hourly mean wage | Annual mean wage (2) |
|---|---|---|---|---|---|
| Montana | 5,140 | 10.94 | 3.18 | $ 10.96 | $ 22,800 |
| North Dakota | 3,730 | 9.43 | 2.74 | $ 12.80 | $ 26,630 |
| Nevada | 11,060 | 8.58 | 2.49 | $ 12.21 | $ 25,390 |
| Wisconsin | 22,330 | 8.11 | 2.35 | $ 11.46 | $ 23,840 |
| Wyoming | 2,040 | 7.83 | 2.27 | $ 12.24 | $ 25,460 |
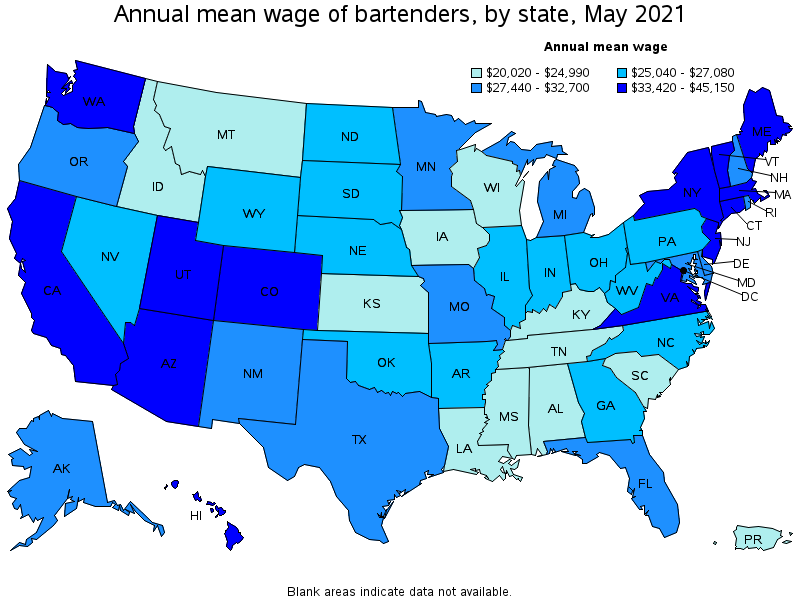
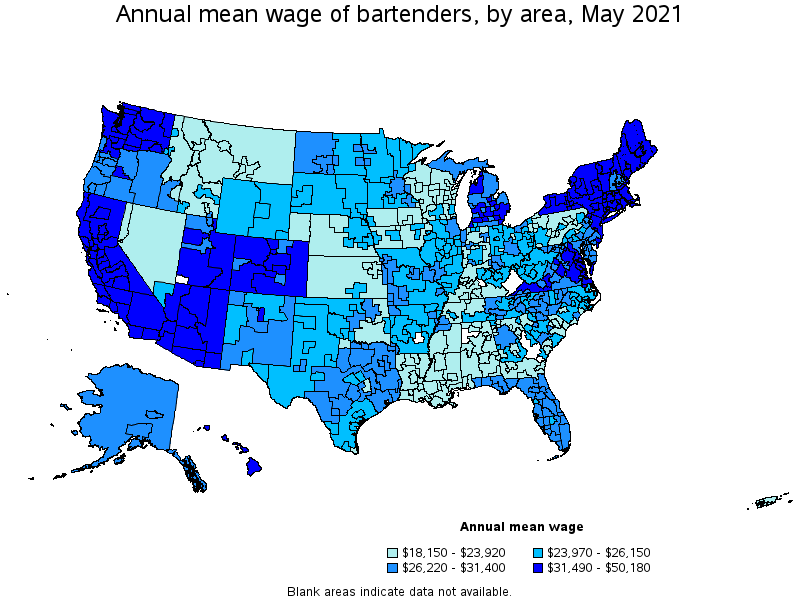
Top paying states for Bartenders:
| State | Employment (1) | Employment per thousand jobs | Location quotient (9) | Hourly mean wage | Annual mean wage (2) |
|---|---|---|---|---|---|
| Arizona | 11,620 | 4.03 | 1.17 | $ 21.71 | $ 45,150 |
| Hawaii | 2,140 | 3.90 | 1.13 | $ 21.48 | $ 44,680 |
| Washington | 9,810 | 3.06 | 0.89 | $ 21.21 | $ 44,120 |
| New York | 20,110 | 2.32 | 0.67 | $ 21.05 | $ 43,780 |
| District of Columbia | 2,400 | 3.62 | 1.05 | $ 20.57 | $ 42,790 |
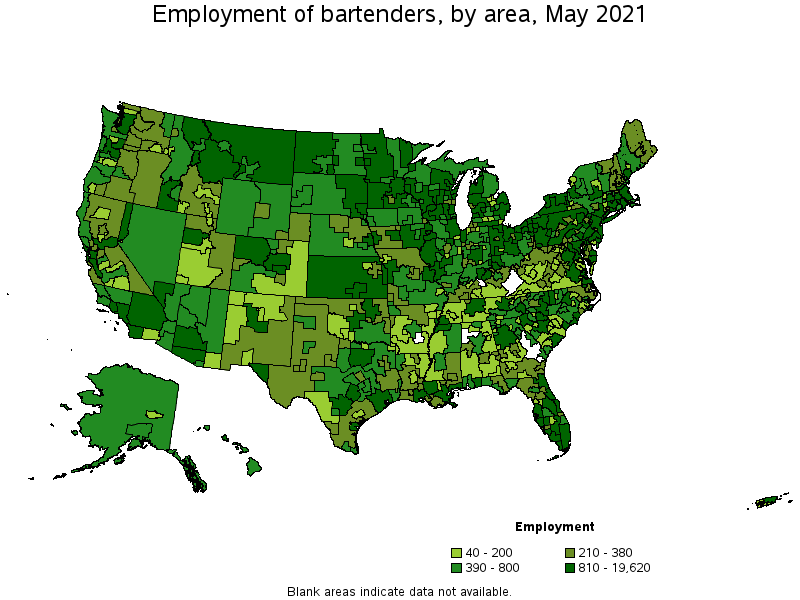
Metropolitan areas with the highest employment level in Bartenders:
| Metropolitan area | Employment (1) | Employment per thousand jobs | Location quotient (9) | Hourly mean wage | Annual mean wage (2) |
|---|---|---|---|---|---|
| New York-Newark-Jersey City, NY-NJ-PA | 19,620 | 2.26 | 0.66 | $ 20.76 | $ 43,170 |
| Chicago-Naperville-Elgin, IL-IN-WI | 12,570 | 2.97 | 0.86 | $ 13.21 | $ 27,480 |
| Los Angeles-Long Beach-Anaheim, CA | 12,160 | 2.13 | 0.62 | $ 20.13 | $ 41,880 |
| Houston-The Woodlands-Sugar Land, TX | 10,240 | 3.53 | 1.03 | $ 13.59 | $ 28,270 |
| Dallas-Fort Worth-Arlington, TX | 9,230 | 2.57 | 0.75 | $ 14.11 | $ 29,350 |
| Las Vegas-Henderson-Paradise, NV | 8,820 | 9.60 | 2.79 | $ 12.51 | $ 26,010 |
| Miami-Fort Lauderdale-West Palm Beach, FL | 8,750 | 3.57 | 1.04 | $ 13.66 | $ 28,420 |
| Minneapolis-St. Paul-Bloomington, MN-WI | 8,340 | 4.58 | 1.33 | $ 13.83 | $ 28,770 |
| Atlanta-Sandy Springs-Roswell, GA | 8,100 | 3.13 | 0.91 | $ 14.03 | $ 29,180 |
| Philadelphia-Camden-Wilmington, PA-NJ-DE-MD | 7,920 | 2.98 | 0.87 | $ 14.36 | $ 29,860 |
Metropolitan areas with the highest concentration of jobs and location quotients in Bartenders:
| Metropolitan area | Employment (1) | Employment per thousand jobs | Location quotient (9) | Hourly mean wage | Annual mean wage (2) |
|---|---|---|---|---|---|
| Ocean City, NJ | 480 | 12.22 | 3.55 | $ 15.14 | $ 31,500 |
| Great Falls, MT | 400 | 11.76 | 3.41 | $ 10.38 | $ 21,580 |
| Salisbury, MD-DE | 1,800 | 11.56 | 3.36 | $ 13.48 | $ 28,040 |
| Atlantic City-Hammonton, NJ | 1,280 | 11.03 | 3.20 | $ 15.93 | $ 33,120 |
| Johnstown, PA | 520 | 10.90 | 3.16 | $ 10.17 | $ 21,140 |
| Missoula, MT | 650 | 10.88 | 3.16 | $ 10.39 | $ 21,610 |
| La Crosse-Onalaska, WI-MN | 770 | 10.72 | 3.11 | $ 11.02 | $ 22,920 |
| Grand Forks, ND-MN | 480 | 9.92 | 2.88 | $ 12.61 | $ 26,230 |
| Duluth, MN-WI | 1,160 | 9.70 | 2.82 | $ 12.26 | $ 25,500 |
| Las Vegas-Henderson-Paradise, NV | 8,820 | 9.60 | 2.79 | $ 12.51 | $ 26,010 |
Top paying metropolitan areas for Bartenders:
| Metropolitan area | Employment (1) | Employment per thousand jobs | Location quotient (9) | Hourly mean wage | Annual mean wage (2) |
|---|---|---|---|---|---|
| Kahului-Wailuku-Lahaina, HI | 490 | 7.70 | 2.23 | $ 24.12 | $ 50,180 |
| Seattle-Tacoma-Bellevue, WA | 5,540 | 2.89 | 0.84 | $ 22.99 | $ 47,820 |
| Phoenix-Mesa-Scottsdale, AZ | 7,570 | 3.57 | 1.04 | $ 22.81 | $ 47,440 |
| Flagstaff, AZ | 420 | 7.32 | 2.12 | $ 21.75 | $ 45,230 |
| Portland-South Portland, ME | 1,060 | 5.35 | 1.55 | $ 21.47 | $ 44,660 |
| Kennewick-Richland, WA | 330 | 2.80 | 0.81 | $ 20.89 | $ 43,440 |
| New York-Newark-Jersey City, NY-NJ-PA | 19,620 | 2.26 | 0.66 | $ 20.76 | $ 43,170 |
| Urban Honolulu, HI | 1,230 | 3.10 | 0.90 | $ 20.67 | $ 42,990 |
| Tucson, AZ | 1,650 | 4.51 | 1.31 | $ 20.51 | $ 42,660 |
| Prescott, AZ | 470 | 7.28 | 2.11 | $ 20.30 | $ 42,230 |
Nonmetropolitan areas with the highest employment in Bartenders:
| Nonmetropolitan area | Employment (1) | Employment per thousand jobs | Location quotient (9) | Hourly mean wage | Annual mean wage (2) |
|---|---|---|---|---|---|
| South Central Wisconsin nonmetropolitan area | 2,320 | 11.65 | 3.38 | $ 11.01 | $ 22,910 |
| Northeastern Wisconsin nonmetropolitan area | 2,310 | 12.09 | 3.51 | $ 10.96 | $ 22,790 |
| Northwest Minnesota nonmetropolitan area | 1,880 | 10.32 | 2.99 | $ 12.54 | $ 26,090 |
| North Northeastern Ohio nonmetropolitan area (noncontiguous) | 1,610 | 5.13 | 1.49 | $ 11.83 | $ 24,610 |
| Western Wisconsin nonmetropolitan area | 1,560 | 11.67 | 3.39 | $ 10.59 | $ 22,030 |
Nonmetropolitan areas with the highest concentration of jobs and location quotients in Bartenders:
| Nonmetropolitan area | Employment (1) | Employment per thousand jobs | Location quotient (9) | Hourly mean wage | Annual mean wage (2) |
|---|---|---|---|---|---|
| East-Central Montana nonmetropolitan area | 880 | 14.07 | 4.08 | $ 11.01 | $ 22,900 |
| Northwestern Wisconsin nonmetropolitan area | 640 | 13.60 | 3.95 | $ 10.53 | $ 21,900 |
| East North Dakota nonmetropolitan area | 800 | 13.05 | 3.79 | $ 12.16 | $ 25,290 |
| Northeast Minnesota nonmetropolitan area | 520 | 12.69 | 3.68 | $ 12.03 | $ 25,030 |
| Northeastern Wisconsin nonmetropolitan area | 2,310 | 12.09 | 3.51 | $ 10.96 | $ 22,790 |
Top paying nonmetropolitan areas for Bartenders:
| Nonmetropolitan area | Employment (1) | Employment per thousand jobs | Location quotient (9) | Hourly mean wage | Annual mean wage (2) |
|---|---|---|---|---|---|
| Hawaii / Kauai nonmetropolitan area | 420 | 4.72 | 1.37 | $ 20.74 | $ 43,140 |
| Massachusetts nonmetropolitan area | 420 | 7.23 | 2.10 | $ 20.53 | $ 42,700 |
| Northeast Maine nonmetropolitan area | 230 | 3.49 | 1.01 | $ 18.87 | $ 39,240 |
| Southwest Maine nonmetropolitan area | 700 | 3.81 | 1.11 | $ 18.78 | $ 39,060 |
| Arizona nonmetropolitan area | 470 | 5.17 | 1.50 | $ 18.19 | $ 37,840 |
These estimates are calculated with data collected from employers in all industry sectors, all metropolitan and nonmetropolitan areas, and all states and the District of Columbia. The top employment and wage figures are provided above. The complete list is available in the downloadable XLS files.
The percentile wage estimate is the value of a wage below which a certain percent of workers fall. The median wage is the 50th percentile wage estimate—50 percent of workers earn less than the median and 50 percent of workers earn more than the median. More about percentile wages.
(1) Estimates for detailed occupations do not sum to the totals because the totals include occupations not shown separately. Estimates do not include self-employed workers.
(2) Annual wages have been calculated by multiplying the hourly mean wage by a "year-round, full-time" hours figure of 2,080 hours; for those occupations where there is not an hourly wage published, the annual wage has been directly calculated from the reported survey data.
(3) The relative standard error (RSE) is a measure of the reliability of a survey statistic. The smaller the relative standard error, the more precise the estimate.
(8) Estimate not released.
(9) The location quotient is the ratio of the area concentration of occupational employment to the national average concentration. A location quotient greater than one indicates the occupation has a higher share of employment than average, and a location quotient less than one indicates the occupation is less prevalent in the area than average.
Other OEWS estimates and related information:
May 2021 National Occupational Employment and Wage Estimates
May 2021 State Occupational Employment and Wage Estimates
May 2021 Metropolitan and Nonmetropolitan Area Occupational Employment and Wage Estimates
May 2021 National Industry-Specific Occupational Employment and Wage Estimates
Last Modified Date: March 31, 2022