
An official website of the United States government
An official website of the United States government
The .gov means it's official.
Federal government websites often end in .gov or .mil. Before sharing sensitive information,
make sure you're on a federal government site.
The site is secure.
The
https:// ensures that you are connecting to the official website and that any
information you provide is encrypted and transmitted securely.
Welcome patrons, seat them at tables or in lounge, and help ensure quality of facilities and service.
Employment estimate and mean wage estimates for Hosts and Hostesses, Restaurant, Lounge, and Coffee Shop:
| Employment (1) | Employment RSE (3) |
Mean hourly wage |
Mean annual wage (2) |
Wage RSE (3) |
|---|---|---|---|---|
| 324,690 | 1.7 % | $ 12.50 | $ 26,000 | 0.6 % |
Percentile wage estimates for Hosts and Hostesses, Restaurant, Lounge, and Coffee Shop:
| Percentile | 10% | 25% | 50% (Median) |
75% | 90% |
|---|---|---|---|---|---|
| Hourly Wage | $ 8.73 | $ 10.46 | $ 11.83 | $ 14.16 | $ 15.89 |
| Annual Wage (2) | $ 18,160 | $ 21,750 | $ 24,600 | $ 29,450 | $ 33,050 |
Industries with the highest published employment and wages for Hosts and Hostesses, Restaurant, Lounge, and Coffee Shop are provided. For a list of all industries with employment in Hosts and Hostesses, Restaurant, Lounge, and Coffee Shop, see the Create Customized Tables function.
Industries with the highest levels of employment in Hosts and Hostesses, Restaurant, Lounge, and Coffee Shop:
| Industry | Employment (1) | Percent of industry employment | Hourly mean wage | Annual mean wage (2) |
|---|---|---|---|---|
| Restaurants and Other Eating Places | 288,360 | 3.06 | $ 12.35 | $ 25,680 |
| Traveler Accommodation | 11,460 | 0.83 | $ 14.89 | $ 30,960 |
| Drinking Places (Alcoholic Beverages) | 5,310 | 1.73 | $ 12.46 | $ 25,910 |
| Other Amusement and Recreation Industries | 4,470 | 0.40 | $ 13.33 | $ 27,730 |
| Special Food Services | 2,890 | 0.61 | $ 13.71 | $ 28,520 |
Industries with the highest concentration of employment in Hosts and Hostesses, Restaurant, Lounge, and Coffee Shop:
| Industry | Employment (1) | Percent of industry employment | Hourly mean wage | Annual mean wage (2) |
|---|---|---|---|---|
| Restaurants and Other Eating Places | 288,360 | 3.06 | $ 12.35 | $ 25,680 |
| Drinking Places (Alcoholic Beverages) | 5,310 | 1.73 | $ 12.46 | $ 25,910 |
| Traveler Accommodation | 11,460 | 0.83 | $ 14.89 | $ 30,960 |
| Gambling Industries | 1,490 | 0.82 | $ 13.53 | $ 28,140 |
| Amusement Parks and Arcades | 1,120 | 0.73 | $ 10.20 | $ 21,220 |
Top paying industries for Hosts and Hostesses, Restaurant, Lounge, and Coffee Shop:
| Industry | Employment (1) | Percent of industry employment | Hourly mean wage | Annual mean wage (2) |
|---|---|---|---|---|
| General Medical and Surgical Hospitals | 1,740 | 0.03 | $ 15.36 | $ 31,940 |
| General Merchandise Stores | 210 | 0.01 | $ 15.25 | $ 31,720 |
| Traveler Accommodation | 11,460 | 0.83 | $ 14.89 | $ 30,960 |
| Outpatient Care Centers | (8) | (8) | $ 14.68 | $ 30,530 |
| Continuing Care Retirement Communities and Assisted Living Facilities for the Elderly | 920 | 0.10 | $ 14.45 | $ 30,060 |
States and areas with the highest published employment, location quotients, and wages for Hosts and Hostesses, Restaurant, Lounge, and Coffee Shop are provided. For a list of all areas with employment in Hosts and Hostesses, Restaurant, Lounge, and Coffee Shop, see the Create Customized Tables function.
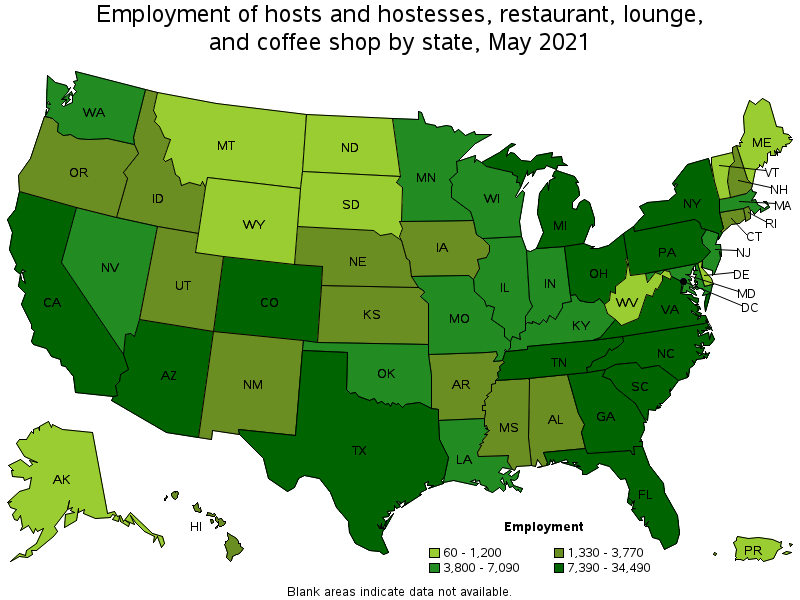
States with the highest employment level in Hosts and Hostesses, Restaurant, Lounge, and Coffee Shop:
| State | Employment (1) | Employment per thousand jobs | Location quotient (9) | Hourly mean wage | Annual mean wage (2) |
|---|---|---|---|---|---|
| Texas | 34,490 | 2.82 | 1.22 | $ 10.94 | $ 22,760 |
| California | 33,720 | 2.04 | 0.89 | $ 15.61 | $ 32,470 |
| Florida | 30,560 | 3.55 | 1.54 | $ 12.20 | $ 25,370 |
| Pennsylvania | 13,010 | 2.33 | 1.01 | $ 11.20 | $ 23,290 |
| Georgia | 12,490 | 2.85 | 1.24 | $ 10.78 | $ 22,430 |
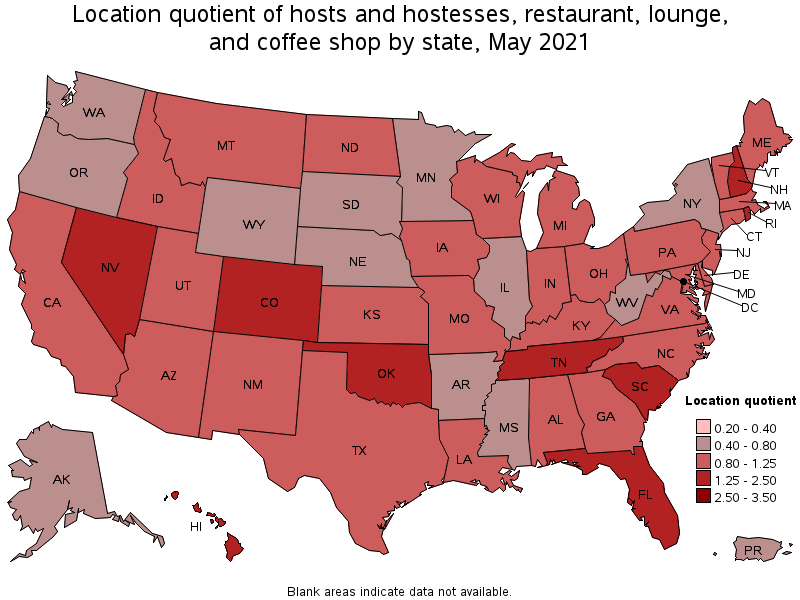
States with the highest concentration of jobs and location quotients in Hosts and Hostesses, Restaurant, Lounge, and Coffee Shop:
| State | Employment (1) | Employment per thousand jobs | Location quotient (9) | Hourly mean wage | Annual mean wage (2) |
|---|---|---|---|---|---|
| Nevada | 5,420 | 4.20 | 1.82 | $ 12.90 | $ 26,840 |
| South Carolina | 7,520 | 3.64 | 1.58 | $ 10.66 | $ 22,170 |
| Florida | 30,560 | 3.55 | 1.54 | $ 12.20 | $ 25,370 |
| New Hampshire | 2,080 | 3.28 | 1.42 | $ 12.50 | $ 26,000 |
| Hawaii | 1,720 | 3.14 | 1.36 | $ 15.96 | $ 33,190 |
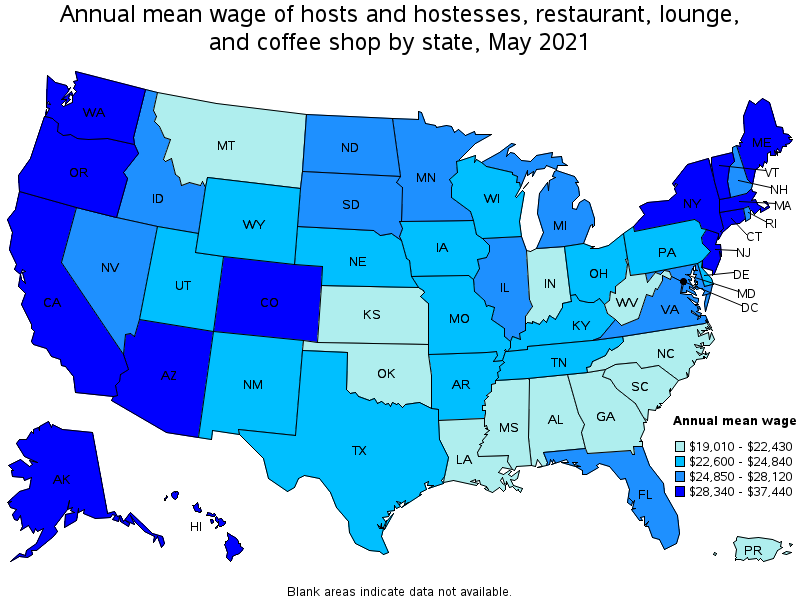
Top paying states for Hosts and Hostesses, Restaurant, Lounge, and Coffee Shop:
| State | Employment (1) | Employment per thousand jobs | Location quotient (9) | Hourly mean wage | Annual mean wage (2) |
|---|---|---|---|---|---|
| District of Columbia | 1,170 | 1.77 | 0.77 | $ 18.00 | $ 37,440 |
| Washington | 5,120 | 1.60 | 0.69 | $ 16.15 | $ 33,600 |
| New York | 11,290 | 1.30 | 0.57 | $ 16.00 | $ 33,270 |
| Hawaii | 1,720 | 3.14 | 1.36 | $ 15.96 | $ 33,190 |
| California | 33,720 | 2.04 | 0.89 | $ 15.61 | $ 32,470 |
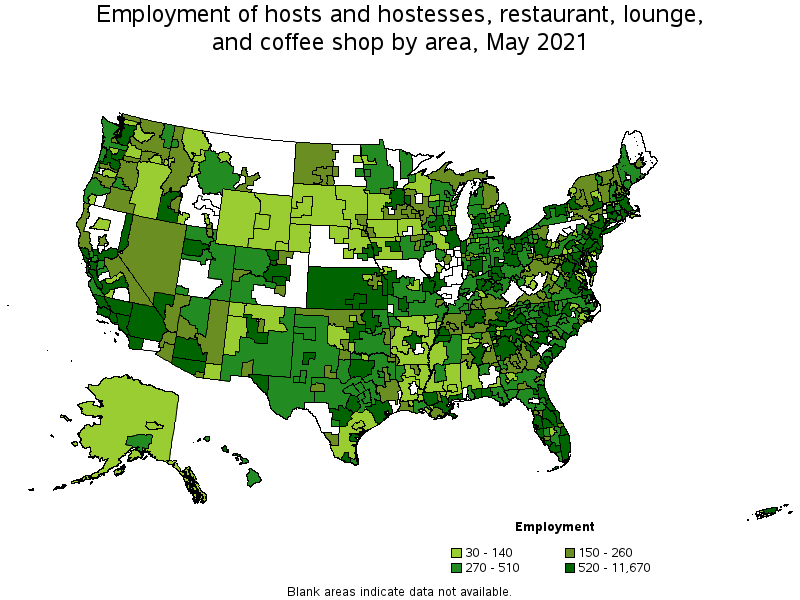
Metropolitan areas with the highest employment level in Hosts and Hostesses, Restaurant, Lounge, and Coffee Shop:
| Metropolitan area | Employment (1) | Employment per thousand jobs | Location quotient (9) | Hourly mean wage | Annual mean wage (2) |
|---|---|---|---|---|---|
| New York-Newark-Jersey City, NY-NJ-PA | 11,670 | 1.35 | 0.58 | $ 15.77 | $ 32,810 |
| Los Angeles-Long Beach-Anaheim, CA | 10,470 | 1.83 | 0.79 | $ 15.42 | $ 32,070 |
| Dallas-Fort Worth-Arlington, TX | 10,170 | 2.84 | 1.23 | $ 11.59 | $ 24,100 |
| Houston-The Woodlands-Sugar Land, TX | 9,010 | 3.11 | 1.35 | $ 10.94 | $ 22,740 |
| Atlanta-Sandy Springs-Roswell, GA | 7,890 | 3.05 | 1.32 | $ 11.10 | $ 23,080 |
| Miami-Fort Lauderdale-West Palm Beach, FL | 7,850 | 3.20 | 1.39 | $ 12.28 | $ 25,540 |
| Washington-Arlington-Alexandria, DC-VA-MD-WV | 6,780 | 2.31 | 1.00 | $ 14.55 | $ 30,250 |
| Philadelphia-Camden-Wilmington, PA-NJ-DE-MD | 6,330 | 2.38 | 1.03 | $ 12.26 | $ 25,490 |
| Phoenix-Mesa-Scottsdale, AZ | 5,340 | 2.52 | 1.09 | $ 14.64 | $ 30,460 |
| Boston-Cambridge-Nashua, MA-NH | 5,170 | 2.00 | 0.87 | $ 15.27 | $ 31,750 |
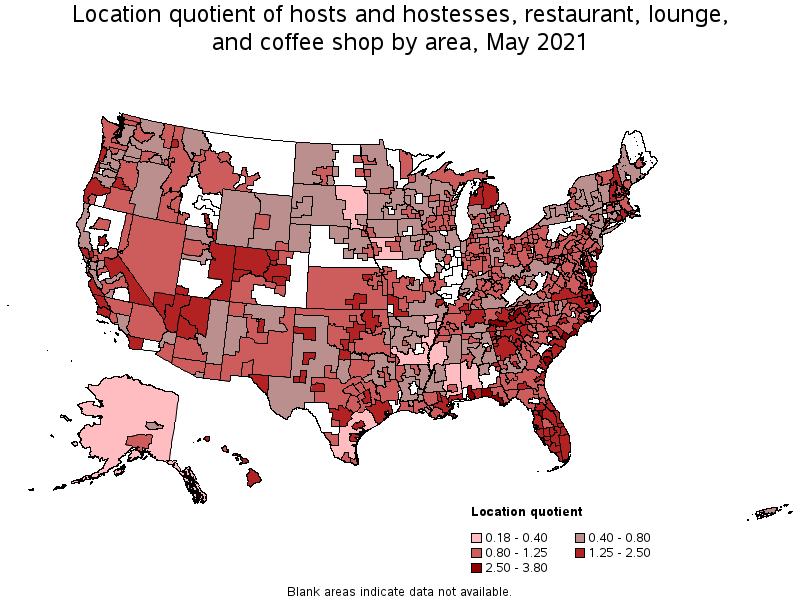
Metropolitan areas with the highest concentration of jobs and location quotients in Hosts and Hostesses, Restaurant, Lounge, and Coffee Shop:
| Metropolitan area | Employment (1) | Employment per thousand jobs | Location quotient (9) | Hourly mean wage | Annual mean wage (2) |
|---|---|---|---|---|---|
| Myrtle Beach-Conway-North Myrtle Beach, SC-NC | 1,420 | 8.75 | 3.80 | $ 10.20 | $ 21,220 |
| Hilton Head Island-Bluffton-Beaufort, SC | 570 | 7.62 | 3.31 | $ 11.08 | $ 23,050 |
| Ocean City, NJ | 290 | 7.53 | 3.27 | $ 13.16 | $ 27,360 |
| Crestview-Fort Walton Beach-Destin, FL | 800 | 6.99 | 3.03 | $ 12.09 | $ 25,150 |
| The Villages, FL | 220 | 6.46 | 2.81 | $ 12.04 | $ 25,040 |
| Daphne-Fairhope-Foley, AL | 480 | 6.44 | 2.80 | $ 10.21 | $ 21,230 |
| Atlantic City-Hammonton, NJ | 740 | 6.40 | 2.78 | $ 13.97 | $ 29,060 |
| Panama City, FL | 460 | 5.90 | 2.56 | $ 11.90 | $ 24,750 |
| Naples-Immokalee-Marco Island, FL | 840 | 5.72 | 2.48 | $ 13.13 | $ 27,300 |
| Napa, CA | 390 | 5.63 | 2.44 | $ 16.48 | $ 34,280 |
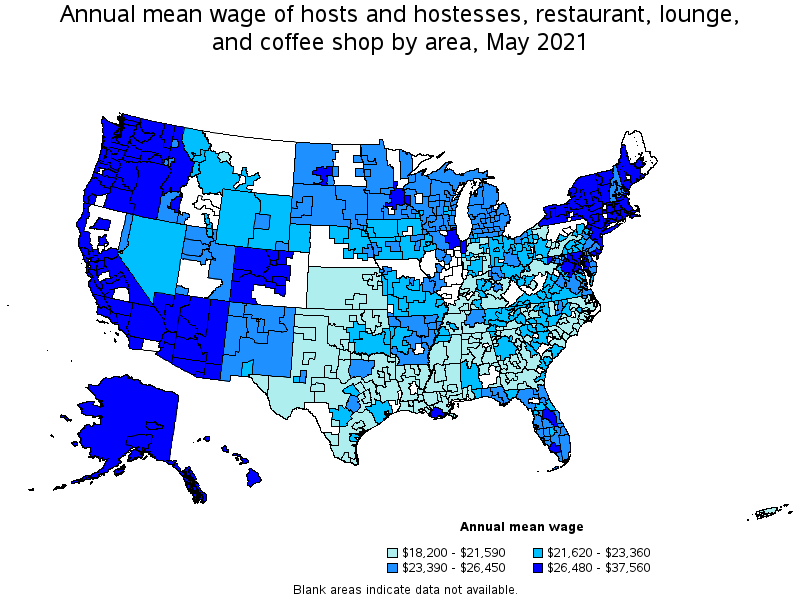
Top paying metropolitan areas for Hosts and Hostesses, Restaurant, Lounge, and Coffee Shop:
| Metropolitan area | Employment (1) | Employment per thousand jobs | Location quotient (9) | Hourly mean wage | Annual mean wage (2) |
|---|---|---|---|---|---|
| Kahului-Wailuku-Lahaina, HI | 360 | 5.56 | 2.41 | $ 18.06 | $ 37,560 |
| San Jose-Sunnyvale-Santa Clara, CA | 1,570 | 1.47 | 0.64 | $ 17.82 | $ 37,060 |
| Madera, CA | 50 | 1.10 | 0.48 | $ 17.55 | $ 36,490 |
| Seattle-Tacoma-Bellevue, WA | 2,490 | 1.30 | 0.56 | $ 17.15 | $ 35,670 |
| San Francisco-Oakland-Hayward, CA | 3,040 | 1.35 | 0.59 | $ 16.98 | $ 35,320 |
| Kingston, NY | 110 | 2.11 | 0.92 | $ 16.48 | $ 34,280 |
| Napa, CA | 390 | 5.63 | 2.44 | $ 16.48 | $ 34,280 |
| Santa Rosa, CA | 630 | 3.31 | 1.43 | $ 16.44 | $ 34,200 |
| Barnstable Town, MA | 470 | 4.81 | 2.09 | $ 16.28 | $ 33,850 |
| Norwich-New London-Westerly, CT-RI | 440 | 3.81 | 1.65 | $ 16.15 | $ 33,580 |
Nonmetropolitan areas with the highest employment in Hosts and Hostesses, Restaurant, Lounge, and Coffee Shop:
| Nonmetropolitan area | Employment (1) | Employment per thousand jobs | Location quotient (9) | Hourly mean wage | Annual mean wage (2) |
|---|---|---|---|---|---|
| East Tennessee nonmetropolitan area | 990 | 7.40 | 3.21 | $ 10.46 | $ 21,760 |
| Kansas nonmetropolitan area | 690 | 1.83 | 0.80 | $ 9.49 | $ 19,730 |
| North Northeastern Ohio nonmetropolitan area (noncontiguous) | 660 | 2.10 | 0.91 | $ 10.59 | $ 22,020 |
| North Georgia nonmetropolitan area | 550 | 3.26 | 1.42 | $ 10.22 | $ 21,250 |
| Piedmont North Carolina nonmetropolitan area | 510 | 2.08 | 0.90 | $ 10.53 | $ 21,900 |
Nonmetropolitan areas with the highest concentration of jobs and location quotients in Hosts and Hostesses, Restaurant, Lounge, and Coffee Shop:
| Nonmetropolitan area | Employment (1) | Employment per thousand jobs | Location quotient (9) | Hourly mean wage | Annual mean wage (2) |
|---|---|---|---|---|---|
| East Tennessee nonmetropolitan area | 990 | 7.40 | 3.21 | $ 10.46 | $ 21,760 |
| South Florida nonmetropolitan area | 430 | 5.62 | 2.44 | $ 12.43 | $ 25,850 |
| Northeast Coastal North Carolina nonmetropolitan area | 460 | 5.15 | 2.23 | $ 10.36 | $ 21,540 |
| Northern New Hampshire nonmetropolitan area | 170 | 5.12 | 2.22 | $ 11.98 | $ 24,920 |
| Eastern Utah nonmetropolitan area | 360 | 4.50 | 1.95 | $ 11.57 | $ 24,060 |
Top paying nonmetropolitan areas for Hosts and Hostesses, Restaurant, Lounge, and Coffee Shop:
| Nonmetropolitan area | Employment (1) | Employment per thousand jobs | Location quotient (9) | Hourly mean wage | Annual mean wage (2) |
|---|---|---|---|---|---|
| Massachusetts nonmetropolitan area | 110 | 1.84 | 0.80 | $ 17.91 | $ 37,250 |
| Hawaii / Kauai nonmetropolitan area | 350 | 3.93 | 1.71 | $ 15.66 | $ 32,560 |
| Capital/Northern New York nonmetropolitan area | 160 | 1.21 | 0.53 | $ 15.56 | $ 32,370 |
| Eastern Sierra-Mother Lode Region of California nonmetropolitan area | 180 | 3.19 | 1.38 | $ 15.55 | $ 32,340 |
| Southwest New York nonmetropolitan area | 280 | 1.65 | 0.72 | $ 15.33 | $ 31,890 |
These estimates are calculated with data collected from employers in all industry sectors, all metropolitan and nonmetropolitan areas, and all states and the District of Columbia. The top employment and wage figures are provided above. The complete list is available in the downloadable XLS files.
The percentile wage estimate is the value of a wage below which a certain percent of workers fall. The median wage is the 50th percentile wage estimate—50 percent of workers earn less than the median and 50 percent of workers earn more than the median. More about percentile wages.
(1) Estimates for detailed occupations do not sum to the totals because the totals include occupations not shown separately. Estimates do not include self-employed workers.
(2) Annual wages have been calculated by multiplying the hourly mean wage by a "year-round, full-time" hours figure of 2,080 hours; for those occupations where there is not an hourly wage published, the annual wage has been directly calculated from the reported survey data.
(3) The relative standard error (RSE) is a measure of the reliability of a survey statistic. The smaller the relative standard error, the more precise the estimate.
(8) Estimate not released.
(9) The location quotient is the ratio of the area concentration of occupational employment to the national average concentration. A location quotient greater than one indicates the occupation has a higher share of employment than average, and a location quotient less than one indicates the occupation is less prevalent in the area than average.
Other OEWS estimates and related information:
May 2021 National Occupational Employment and Wage Estimates
May 2021 State Occupational Employment and Wage Estimates
May 2021 Metropolitan and Nonmetropolitan Area Occupational Employment and Wage Estimates
May 2021 National Industry-Specific Occupational Employment and Wage Estimates
Last Modified Date: March 31, 2022