
An official website of the United States government
An official website of the United States government
The .gov means it's official.
Federal government websites often end in .gov or .mil. Before sharing sensitive information,
make sure you're on a federal government site.
The site is secure.
The
https:// ensures that you are connecting to the official website and that any
information you provide is encrypted and transmitted securely.
Buy and sell securities or commodities in investment and trading firms, or provide financial services to businesses and individuals. May advise customers about stocks, bonds, mutual funds, commodities, and market conditions.
Employment estimate and mean wage estimates for Securities, Commodities, and Financial Services Sales Agents:
| Employment (1) | Employment RSE (3) |
Mean hourly wage |
Mean annual wage (2) |
Wage RSE (3) |
|---|---|---|---|---|
| 426,870 | 1.2 % | $ 44.84 | $ 93,260 | 0.8 % |
Percentile wage estimates for Securities, Commodities, and Financial Services Sales Agents:
| Percentile | 10% | 25% | 50% (Median) |
75% | 90% |
|---|---|---|---|---|---|
| Hourly Wage | $ 18.26 | $ 23.12 | $ 30.25 | $ 55.88 | $ 98.77 |
| Annual Wage (2) | $ 37,970 | $ 48,100 | $ 62,910 | $ 116,240 | $ 205,440 |
Industries with the highest published employment and wages for Securities, Commodities, and Financial Services Sales Agents are provided. For a list of all industries with employment in Securities, Commodities, and Financial Services Sales Agents, see the Create Customized Tables function.
Industries with the highest levels of employment in Securities, Commodities, and Financial Services Sales Agents:
| Industry | Employment (1) | Percent of industry employment | Hourly mean wage | Annual mean wage (2) |
|---|---|---|---|---|
| Credit Intermediation and Related Activities (5221 and 5223 only) | 211,740 | 10.58 | $ 33.77 | $ 70,250 |
| Securities, Commodity Contracts, and Other Financial Investments and Related Activities | 151,990 | 15.85 | $ 60.52 | $ 125,880 |
| Nondepository Credit Intermediation | 26,100 | 4.20 | $ 38.76 | $ 80,630 |
| Management of Companies and Enterprises | 13,730 | 0.54 | $ 47.74 | $ 99,310 |
| Insurance Carriers | 6,100 | 0.51 | $ 36.64 | $ 76,210 |
Industries with the highest concentration of employment in Securities, Commodities, and Financial Services Sales Agents:
| Industry | Employment (1) | Percent of industry employment | Hourly mean wage | Annual mean wage (2) |
|---|---|---|---|---|
| Securities, Commodity Contracts, and Other Financial Investments and Related Activities | 151,990 | 15.85 | $ 60.52 | $ 125,880 |
| Credit Intermediation and Related Activities (5221 and 5223 only) | 211,740 | 10.58 | $ 33.77 | $ 70,250 |
| Nondepository Credit Intermediation | 26,100 | 4.20 | $ 38.76 | $ 80,630 |
| Other Investment Pools and Funds | 370 | 2.95 | $ 60.00 | $ 124,800 |
| Insurance and Employee Benefit Funds | 70 | 0.84 | $ 60.20 | $ 125,220 |
Top paying industries for Securities, Commodities, and Financial Services Sales Agents:
| Industry | Employment (1) | Percent of industry employment | Hourly mean wage | Annual mean wage (2) |
|---|---|---|---|---|
| Wholesale Electronic Markets and Agents and Brokers | 790 | 0.17 | $ 81.22 | $ 168,940 |
| Petroleum and Coal Products Manufacturing | (8) | (8) | $ 72.68 | $ 151,170 |
| Electric Power Generation, Transmission and Distribution | 90 | 0.02 | $ 66.72 | $ 138,770 |
| Management, Scientific, and Technical Consulting Services | 1,750 | 0.11 | $ 63.47 | $ 132,010 |
| Securities, Commodity Contracts, and Other Financial Investments and Related Activities | 151,990 | 15.85 | $ 60.52 | $ 125,880 |
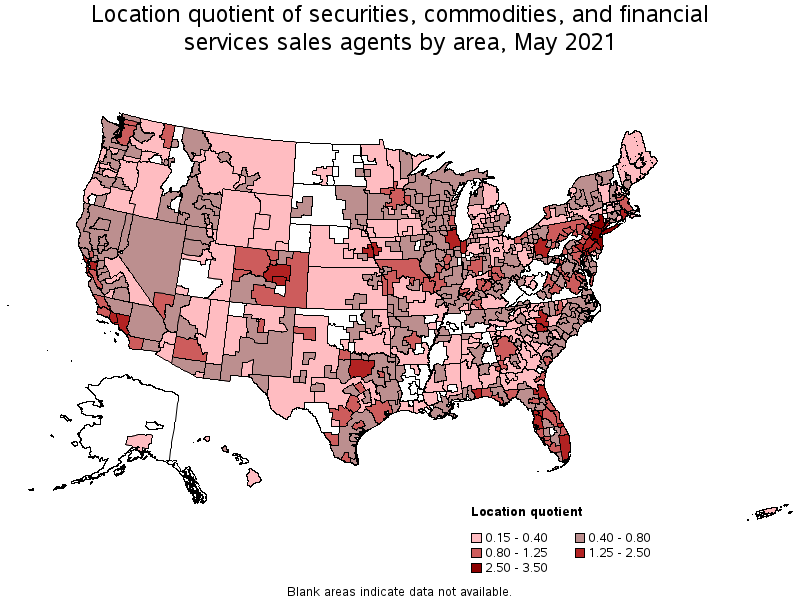
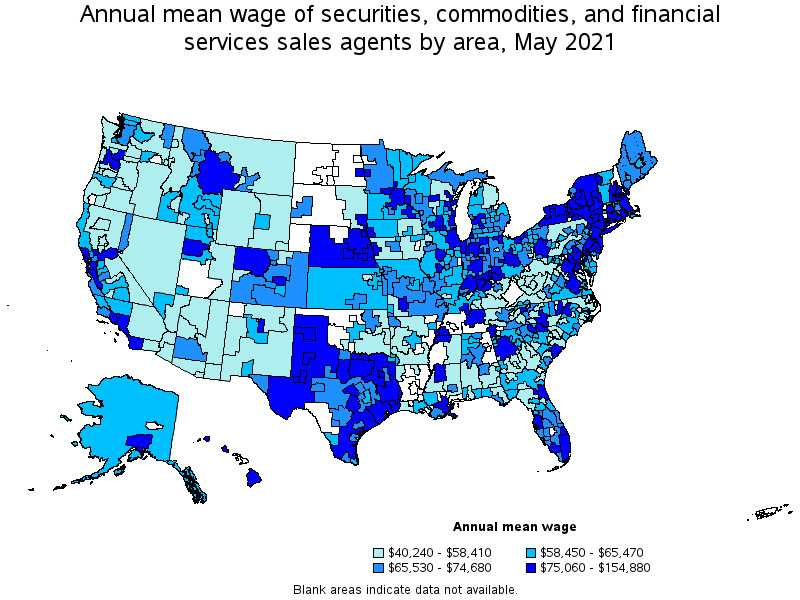
States and areas with the highest published employment, location quotients, and wages for Securities, Commodities, and Financial Services Sales Agents are provided. For a list of all areas with employment in Securities, Commodities, and Financial Services Sales Agents, see the Create Customized Tables function.
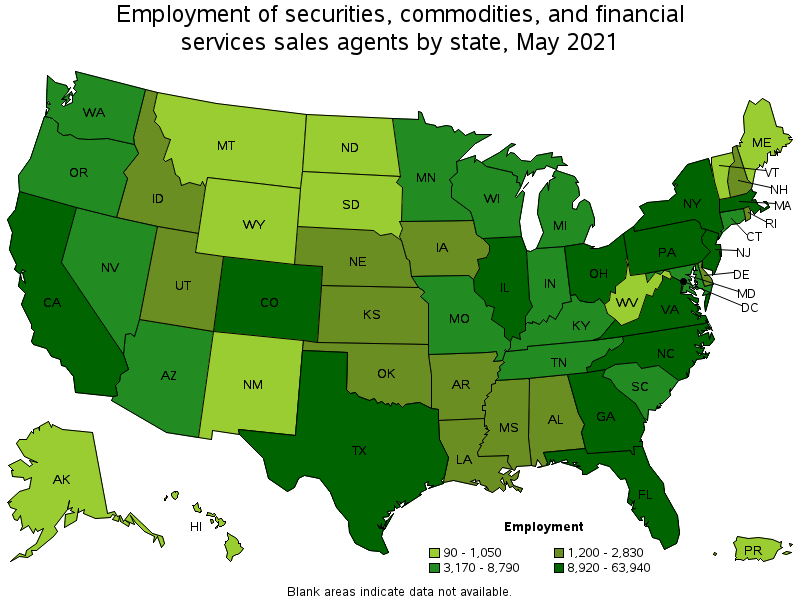
States with the highest employment level in Securities, Commodities, and Financial Services Sales Agents:
| State | Employment (1) | Employment per thousand jobs | Location quotient (9) | Hourly mean wage | Annual mean wage (2) |
|---|---|---|---|---|---|
| New York | 63,940 | 7.38 | 2.43 | $ 75.36 | $ 156,750 |
| California | 55,090 | 3.33 | 1.10 | $ 40.31 | $ 83,850 |
| Texas | 37,490 | 3.07 | 1.01 | $ 42.74 | $ 88,890 |
| Florida | 34,530 | 4.01 | 1.32 | $ 37.75 | $ 78,520 |
| Illinois | 22,770 | 4.05 | 1.34 | $ 42.27 | $ 87,930 |
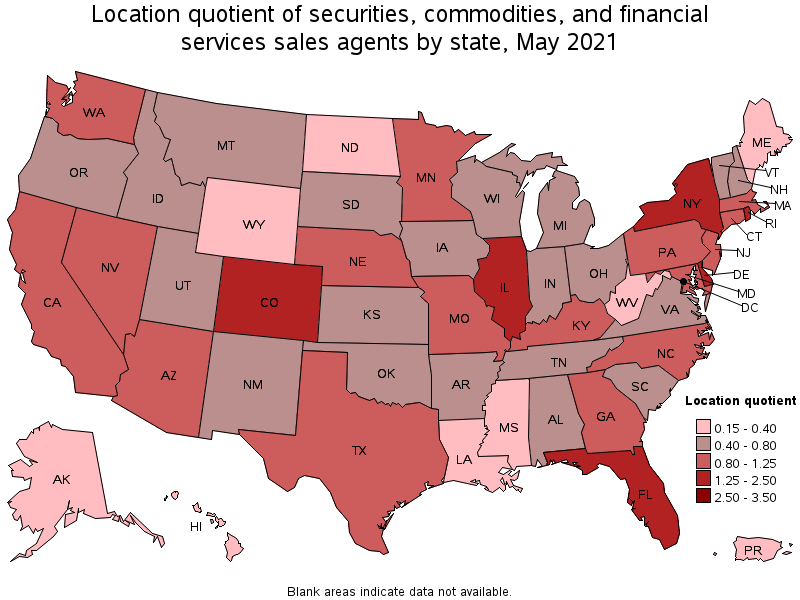
States with the highest concentration of jobs and location quotients in Securities, Commodities, and Financial Services Sales Agents:
| State | Employment (1) | Employment per thousand jobs | Location quotient (9) | Hourly mean wage | Annual mean wage (2) |
|---|---|---|---|---|---|
| New York | 63,940 | 7.38 | 2.43 | $ 75.36 | $ 156,750 |
| Delaware | 2,280 | 5.24 | 1.73 | $ 41.85 | $ 87,060 |
| Rhode Island | 2,030 | 4.43 | 1.46 | $ 40.19 | $ 83,600 |
| Colorado | 11,020 | 4.20 | 1.39 | $ 34.98 | $ 72,760 |
| Illinois | 22,770 | 4.05 | 1.34 | $ 42.27 | $ 87,930 |
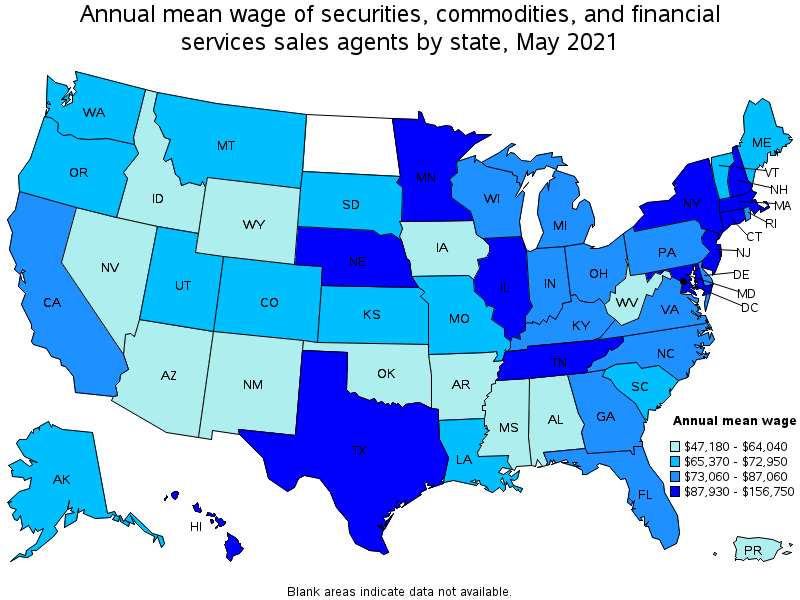
Top paying states for Securities, Commodities, and Financial Services Sales Agents:
| State | Employment (1) | Employment per thousand jobs | Location quotient (9) | Hourly mean wage | Annual mean wage (2) |
|---|---|---|---|---|---|
| New York | 63,940 | 7.38 | 2.43 | $ 75.36 | $ 156,750 |
| Connecticut | 3,980 | 2.53 | 0.84 | $ 60.29 | $ 125,390 |
| District of Columbia | 1,540 | 2.33 | 0.77 | $ 56.24 | $ 116,970 |
| New Jersey | 14,260 | 3.70 | 1.22 | $ 50.51 | $ 105,070 |
| Massachusetts | 9,990 | 2.94 | 0.97 | $ 47.05 | $ 97,870 |
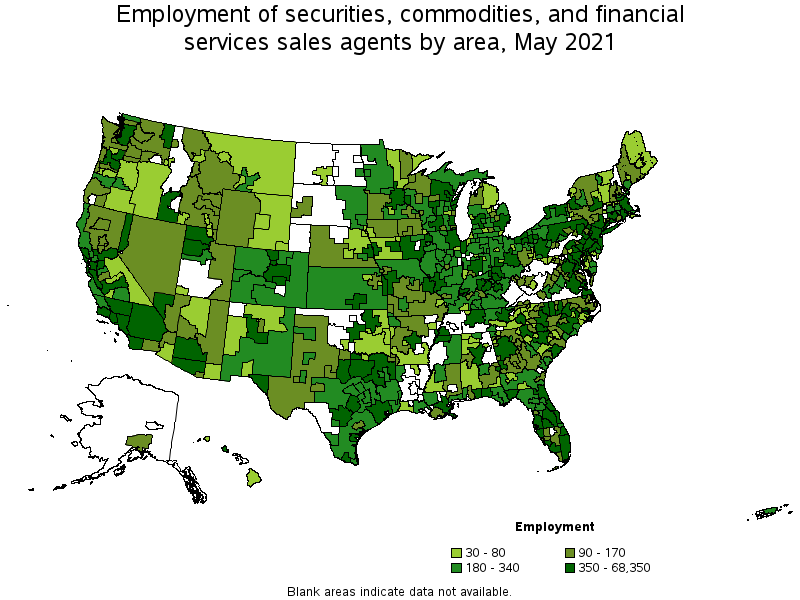
Metropolitan areas with the highest employment level in Securities, Commodities, and Financial Services Sales Agents:
| Metropolitan area | Employment (1) | Employment per thousand jobs | Location quotient (9) | Hourly mean wage | Annual mean wage (2) |
|---|---|---|---|---|---|
| New York-Newark-Jersey City, NY-NJ-PA | 68,350 | 7.88 | 2.60 | $ 74.46 | $ 154,880 |
| Los Angeles-Long Beach-Anaheim, CA | 21,900 | 3.83 | 1.26 | $ 38.59 | $ 80,260 |
| Chicago-Naperville-Elgin, IL-IN-WI | 19,460 | 4.60 | 1.52 | $ 44.16 | $ 91,860 |
| Dallas-Fort Worth-Arlington, TX | 14,310 | 3.99 | 1.32 | $ 43.90 | $ 91,310 |
| Miami-Fort Lauderdale-West Palm Beach, FL | 12,460 | 5.08 | 1.68 | $ 41.24 | $ 85,780 |
| San Francisco-Oakland-Hayward, CA | 11,750 | 5.24 | 1.73 | $ 50.28 | $ 104,580 |
| Philadelphia-Camden-Wilmington, PA-NJ-DE-MD | 11,380 | 4.29 | 1.41 | $ 41.72 | $ 86,780 |
| Houston-The Woodlands-Sugar Land, TX | 9,140 | 3.16 | 1.04 | $ 50.21 | $ 104,430 |
| Boston-Cambridge-Nashua, MA-NH | 9,040 | 3.50 | 1.15 | $ 48.00 | $ 99,830 |
| Atlanta-Sandy Springs-Roswell, GA | 8,070 | 3.12 | 1.03 | $ 40.61 | $ 84,460 |
Metropolitan areas with the highest concentration of jobs and location quotients in Securities, Commodities, and Financial Services Sales Agents:
| Metropolitan area | Employment (1) | Employment per thousand jobs | Location quotient (9) | Hourly mean wage | Annual mean wage (2) |
|---|---|---|---|---|---|
| New York-Newark-Jersey City, NY-NJ-PA | 68,350 | 7.88 | 2.60 | $ 74.46 | $ 154,880 |
| Trenton, NJ | 1,790 | 7.87 | 2.60 | $ 48.39 | $ 100,650 |
| The Villages, FL | 240 | 7.14 | 2.36 | $ 34.24 | $ 71,220 |
| Bridgeport-Stamford-Norwalk, CT | 2,310 | 6.15 | 2.03 | $ 67.93 | $ 141,290 |
| Jacksonville, FL | 3,870 | 5.64 | 1.86 | $ 38.90 | $ 80,900 |
| Charlotte-Concord-Gastonia, NC-SC | 6,420 | 5.31 | 1.75 | $ 45.57 | $ 94,780 |
| San Francisco-Oakland-Hayward, CA | 11,750 | 5.24 | 1.73 | $ 50.28 | $ 104,580 |
| Sebastian-Vero Beach, FL | 260 | 5.12 | 1.69 | $ 32.25 | $ 67,080 |
| Miami-Fort Lauderdale-West Palm Beach, FL | 12,460 | 5.08 | 1.68 | $ 41.24 | $ 85,780 |
| Denver-Aurora-Lakewood, CO | 7,290 | 4.97 | 1.64 | $ 35.16 | $ 73,130 |
Top paying metropolitan areas for Securities, Commodities, and Financial Services Sales Agents:
| Metropolitan area | Employment (1) | Employment per thousand jobs | Location quotient (9) | Hourly mean wage | Annual mean wage (2) |
|---|---|---|---|---|---|
| New York-Newark-Jersey City, NY-NJ-PA | 68,350 | 7.88 | 2.60 | $ 74.46 | $ 154,880 |
| Bridgeport-Stamford-Norwalk, CT | 2,310 | 6.15 | 2.03 | $ 67.93 | $ 141,290 |
| Memphis, TN-MS-AR | 910 | 1.50 | 0.49 | $ 58.26 | $ 121,180 |
| Manchester, NH | 190 | 1.83 | 0.60 | $ 57.48 | $ 119,560 |
| Portsmouth, NH-ME | 180 | 2.04 | 0.67 | $ 55.33 | $ 115,090 |
| Norwich-New London-Westerly, CT-RI | 90 | 0.80 | 0.26 | $ 54.51 | $ 113,380 |
| Hartford-West Hartford-East Hartford, CT | 920 | 1.69 | 0.56 | $ 52.93 | $ 110,100 |
| San Francisco-Oakland-Hayward, CA | 11,750 | 5.24 | 1.73 | $ 50.28 | $ 104,580 |
| Houston-The Woodlands-Sugar Land, TX | 9,140 | 3.16 | 1.04 | $ 50.21 | $ 104,430 |
| Minneapolis-St. Paul-Bloomington, MN-WI | 6,210 | 3.41 | 1.12 | $ 49.70 | $ 103,370 |
Nonmetropolitan areas with the highest employment in Securities, Commodities, and Financial Services Sales Agents:
| Nonmetropolitan area | Employment (1) | Employment per thousand jobs | Location quotient (9) | Hourly mean wage | Annual mean wage (2) |
|---|---|---|---|---|---|
| North Texas Region of Texas nonmetropolitan area | 400 | 1.49 | 0.49 | $ 36.09 | $ 75,060 |
| Northeastern Wisconsin nonmetropolitan area | 380 | 1.99 | 0.66 | $ 27.15 | $ 56,460 |
| Northern Pennsylvania nonmetropolitan area | 370 | 2.52 | 0.83 | $ 26.58 | $ 55,290 |
| Southeast Iowa nonmetropolitan area | 370 | 1.74 | 0.57 | $ 22.66 | $ 47,130 |
| Southeast Coastal North Carolina nonmetropolitan area | 350 | 1.44 | 0.48 | $ 29.11 | $ 60,560 |
Nonmetropolitan areas with the highest concentration of jobs and location quotients in Securities, Commodities, and Financial Services Sales Agents:
| Nonmetropolitan area | Employment (1) | Employment per thousand jobs | Location quotient (9) | Hourly mean wage | Annual mean wage (2) |
|---|---|---|---|---|---|
| North Missouri nonmetropolitan area | 340 | 3.31 | 1.09 | $ 29.29 | $ 60,930 |
| Eastern and Southern Colorado nonmetropolitan area | 190 | 2.89 | 0.95 | $ 34.69 | $ 72,140 |
| Northeast Virginia nonmetropolitan area | 130 | 2.63 | 0.87 | $ 27.43 | $ 57,060 |
| Northern Pennsylvania nonmetropolitan area | 370 | 2.52 | 0.83 | $ 26.58 | $ 55,290 |
| Northwest Colorado nonmetropolitan area | 290 | 2.50 | 0.82 | $ 36.68 | $ 76,290 |
Top paying nonmetropolitan areas for Securities, Commodities, and Financial Services Sales Agents:
| Nonmetropolitan area | Employment (1) | Employment per thousand jobs | Location quotient (9) | Hourly mean wage | Annual mean wage (2) |
|---|---|---|---|---|---|
| West Central-Southwest New Hampshire nonmetropolitan area | 120 | 1.20 | 0.40 | $ 54.97 | $ 114,350 |
| Central New Hampshire nonmetropolitan area | 110 | 1.19 | 0.39 | $ 52.47 | $ 109,130 |
| Hawaii / Kauai nonmetropolitan area | 40 | 0.47 | 0.15 | $ 48.06 | $ 99,960 |
| West Texas Region of Texas nonmetropolitan area | 150 | 0.81 | 0.27 | $ 44.96 | $ 93,510 |
| South Nebraska nonmetropolitan area | 110 | 0.78 | 0.26 | $ 43.61 | $ 90,710 |
These estimates are calculated with data collected from employers in all industry sectors, all metropolitan and nonmetropolitan areas, and all states and the District of Columbia. The top employment and wage figures are provided above. The complete list is available in the downloadable XLS files.
The percentile wage estimate is the value of a wage below which a certain percent of workers fall. The median wage is the 50th percentile wage estimate—50 percent of workers earn less than the median and 50 percent of workers earn more than the median. More about percentile wages.
(1) Estimates for detailed occupations do not sum to the totals because the totals include occupations not shown separately. Estimates do not include self-employed workers.
(2) Annual wages have been calculated by multiplying the hourly mean wage by a "year-round, full-time" hours figure of 2,080 hours; for those occupations where there is not an hourly wage published, the annual wage has been directly calculated from the reported survey data.
(3) The relative standard error (RSE) is a measure of the reliability of a survey statistic. The smaller the relative standard error, the more precise the estimate.
(8) Estimate not released.
(9) The location quotient is the ratio of the area concentration of occupational employment to the national average concentration. A location quotient greater than one indicates the occupation has a higher share of employment than average, and a location quotient less than one indicates the occupation is less prevalent in the area than average.
Other OEWS estimates and related information:
May 2021 National Occupational Employment and Wage Estimates
May 2021 State Occupational Employment and Wage Estimates
May 2021 Metropolitan and Nonmetropolitan Area Occupational Employment and Wage Estimates
May 2021 National Industry-Specific Occupational Employment and Wage Estimates
Last Modified Date: March 31, 2022