
An official website of the United States government
An official website of the United States government
The .gov means it's official.
Federal government websites often end in .gov or .mil. Before sharing sensitive information,
make sure you're on a federal government site.
The site is secure.
The
https:// ensures that you are connecting to the official website and that any
information you provide is encrypted and transmitted securely.
Sell goods for wholesalers or manufacturers where technical or scientific knowledge is required in such areas as biology, engineering, chemistry, and electronics, normally obtained from at least 2 years of postsecondary education. Excludes �Sales Engineers� (41-9031).
Employment estimate and mean wage estimates for Sales Representatives, Wholesale and Manufacturing, Technical and Scientific Products:
| Employment (1) | Employment RSE (3) |
Mean hourly wage |
Mean annual wage (2) |
Wage RSE (3) |
|---|---|---|---|---|
| 266,160 | 1.6 % | $ 49.40 | $ 102,750 | 0.8 % |
Percentile wage estimates for Sales Representatives, Wholesale and Manufacturing, Technical and Scientific Products:
| Percentile | 10% | 25% | 50% (Median) |
75% | 90% |
|---|---|---|---|---|---|
| Hourly Wage | $ 21.38 | $ 29.76 | $ 45.60 | $ 62.92 | $ 80.92 |
| Annual Wage (2) | $ 44,460 | $ 61,900 | $ 94,840 | $ 130,860 | $ 168,320 |
Industries with the highest published employment and wages for Sales Representatives, Wholesale and Manufacturing, Technical and Scientific Products are provided. For a list of all industries with employment in Sales Representatives, Wholesale and Manufacturing, Technical and Scientific Products, see the Create Customized Tables function.
Industries with the highest levels of employment in Sales Representatives, Wholesale and Manufacturing, Technical and Scientific Products:
| Industry | Employment (1) | Percent of industry employment | Hourly mean wage | Annual mean wage (2) |
|---|---|---|---|---|
| Professional and Commercial Equipment and Supplies Merchant Wholesalers | 60,160 | 9.00 | $ 45.44 | $ 94,520 |
| Merchant Wholesalers, Nondurable Goods (4242 and 4246 only) | 41,240 | 10.97 | $ 58.15 | $ 120,960 |
| Software Publishers | 21,400 | 4.07 | $ 48.33 | $ 100,530 |
| Computer Systems Design and Related Services | 17,970 | 0.79 | $ 53.49 | $ 111,270 |
| Wholesale Electronic Markets and Agents and Brokers | 17,660 | 3.72 | $ 49.99 | $ 103,980 |
Industries with the highest concentration of employment in Sales Representatives, Wholesale and Manufacturing, Technical and Scientific Products:
| Industry | Employment (1) | Percent of industry employment | Hourly mean wage | Annual mean wage (2) |
|---|---|---|---|---|
| Merchant Wholesalers, Nondurable Goods (4242 and 4246 only) | 41,240 | 10.97 | $ 58.15 | $ 120,960 |
| Professional and Commercial Equipment and Supplies Merchant Wholesalers | 60,160 | 9.00 | $ 45.44 | $ 94,520 |
| Computer and Peripheral Equipment Manufacturing | 9,000 | 5.78 | $ 69.02 | $ 143,570 |
| Software Publishers | 21,400 | 4.07 | $ 48.33 | $ 100,530 |
| Wholesale Electronic Markets and Agents and Brokers | 17,660 | 3.72 | $ 49.99 | $ 103,980 |
Top paying industries for Sales Representatives, Wholesale and Manufacturing, Technical and Scientific Products:
| Industry | Employment (1) | Percent of industry employment | Hourly mean wage | Annual mean wage (2) |
|---|---|---|---|---|
| Oil and Gas Extraction | (8) | (8) | $ 75.65 | $ 157,350 |
| Animal Food Manufacturing | 160 | 0.24 | $ 75.32 | $ 156,670 |
| Computer and Peripheral Equipment Manufacturing | 9,000 | 5.78 | $ 69.02 | $ 143,570 |
| Scientific Research and Development Services | 7,420 | 0.93 | $ 63.90 | $ 132,920 |
| Pulp, Paper, and Paperboard Mills | 50 | 0.06 | $ 63.82 | $ 132,750 |
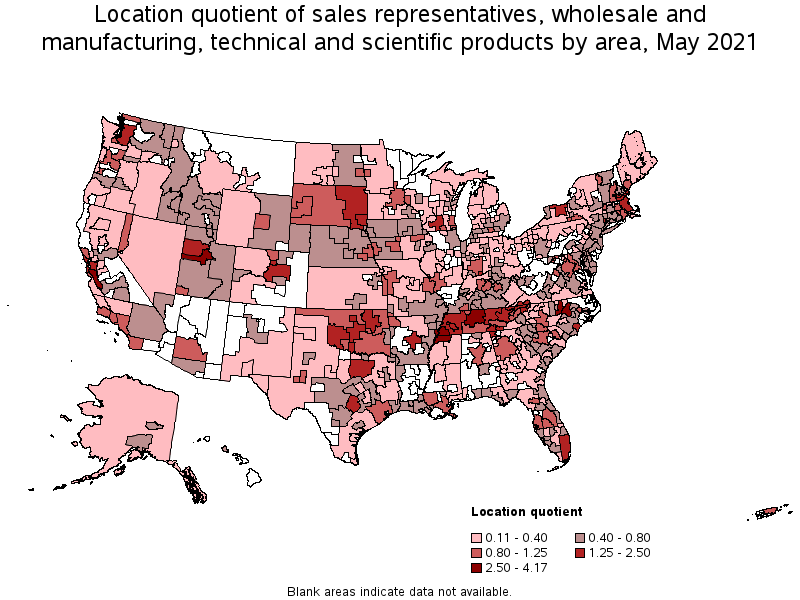
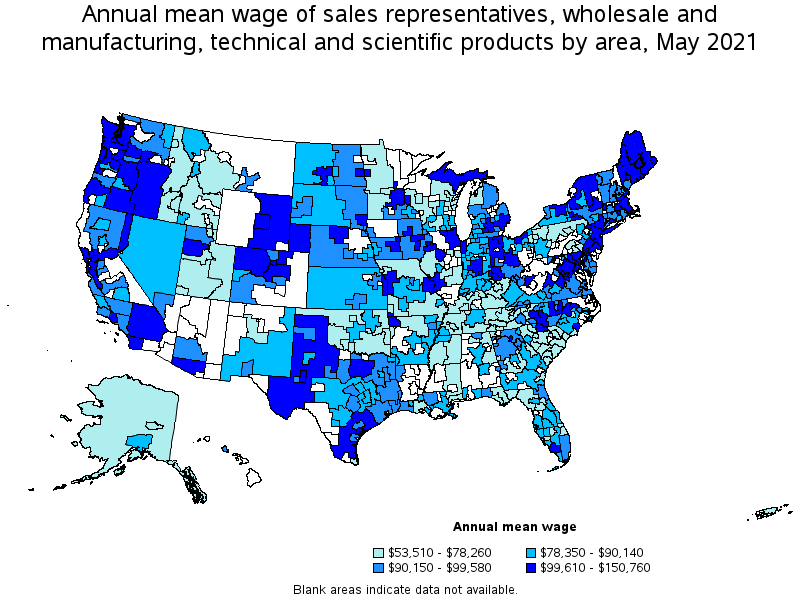
States and areas with the highest published employment, location quotients, and wages for Sales Representatives, Wholesale and Manufacturing, Technical and Scientific Products are provided. For a list of all areas with employment in Sales Representatives, Wholesale and Manufacturing, Technical and Scientific Products, see the Create Customized Tables function.
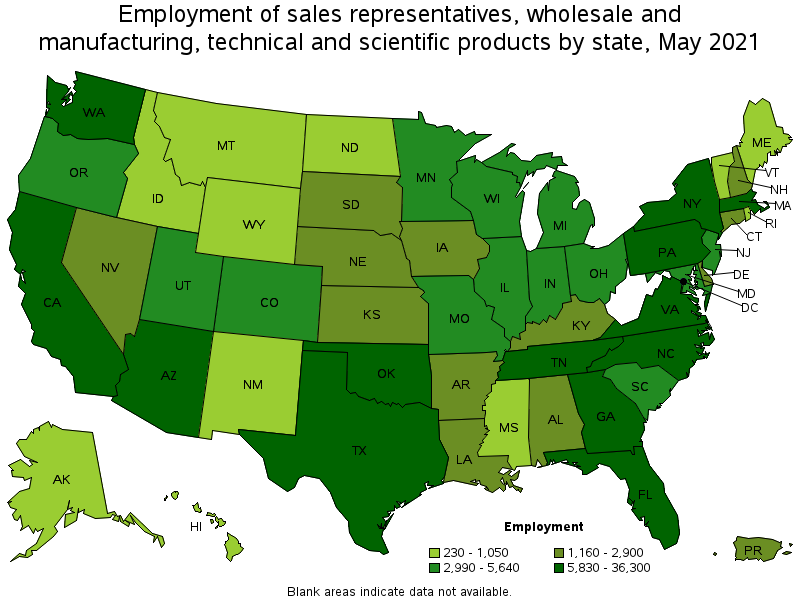
States with the highest employment level in Sales Representatives, Wholesale and Manufacturing, Technical and Scientific Products:
| State | Employment (1) | Employment per thousand jobs | Location quotient (9) | Hourly mean wage | Annual mean wage (2) |
|---|---|---|---|---|---|
| California | 36,300 | 2.20 | 1.16 | $ 56.25 | $ 116,990 |
| Texas | 28,090 | 2.30 | 1.22 | $ 47.62 | $ 99,050 |
| Florida | 18,890 | 2.20 | 1.16 | $ 43.77 | $ 91,040 |
| Tennessee | 15,220 | 5.10 | 2.70 | $ 38.40 | $ 79,870 |
| New York | 14,870 | 1.71 | 0.91 | $ 55.23 | $ 114,870 |
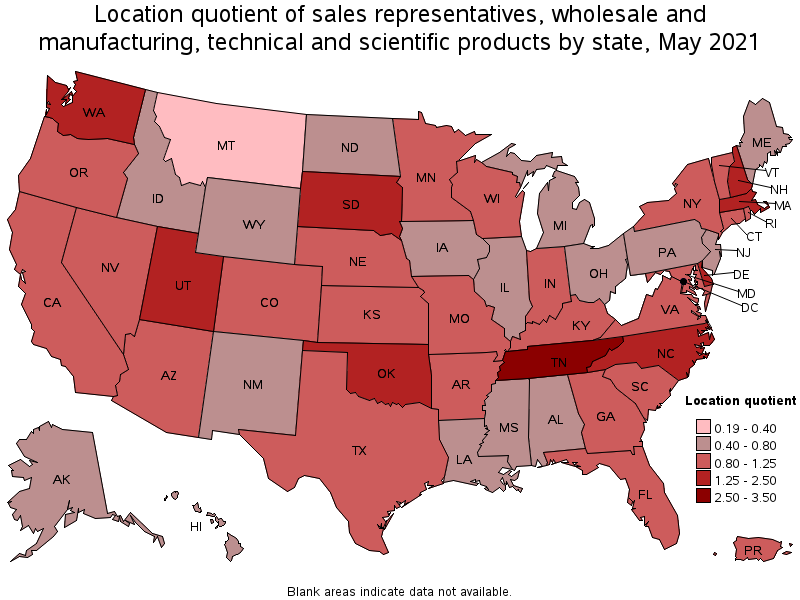
States with the highest concentration of jobs and location quotients in Sales Representatives, Wholesale and Manufacturing, Technical and Scientific Products:
| State | Employment (1) | Employment per thousand jobs | Location quotient (9) | Hourly mean wage | Annual mean wage (2) |
|---|---|---|---|---|---|
| Tennessee | 15,220 | 5.10 | 2.70 | $ 38.40 | $ 79,870 |
| Oklahoma | 6,180 | 3.97 | 2.10 | $ 36.83 | $ 76,600 |
| South Dakota | 1,420 | 3.37 | 1.78 | $ 49.90 | $ 103,780 |
| New Hampshire | 2,100 | 3.31 | 1.75 | $ 47.15 | $ 98,070 |
| Utah | 5,130 | 3.30 | 1.75 | $ 44.96 | $ 93,530 |
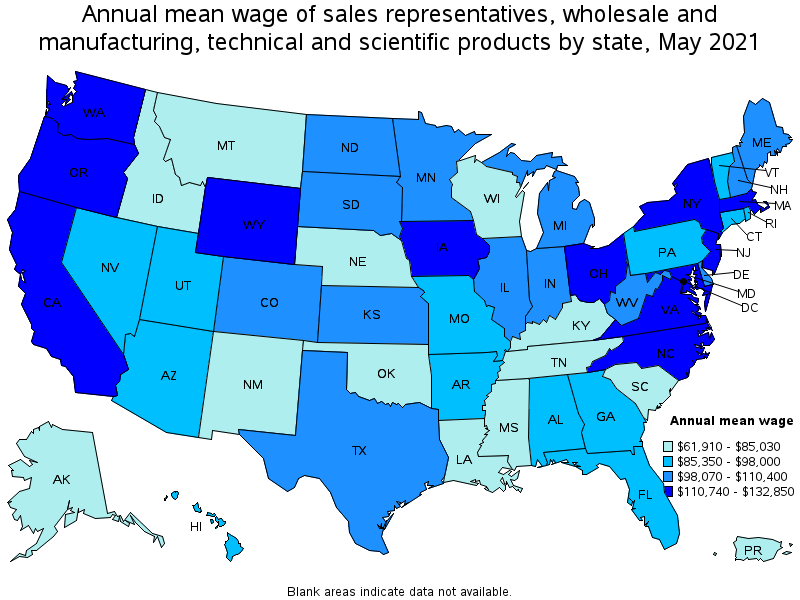
Top paying states for Sales Representatives, Wholesale and Manufacturing, Technical and Scientific Products:
| State | Employment (1) | Employment per thousand jobs | Location quotient (9) | Hourly mean wage | Annual mean wage (2) |
|---|---|---|---|---|---|
| New Jersey | 3,580 | 0.93 | 0.49 | $ 63.87 | $ 132,850 |
| Wyoming | 250 | 0.95 | 0.50 | $ 59.30 | $ 123,340 |
| Massachusetts | 10,980 | 3.24 | 1.71 | $ 59.03 | $ 122,780 |
| Virginia | 7,060 | 1.88 | 1.00 | $ 58.47 | $ 121,620 |
| Washington | 8,160 | 2.55 | 1.35 | $ 58.31 | $ 121,280 |
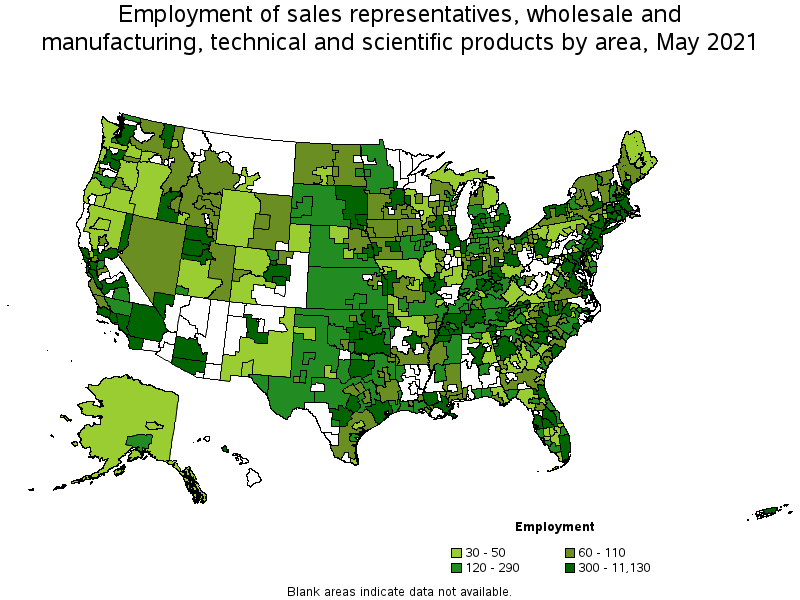
Metropolitan areas with the highest employment level in Sales Representatives, Wholesale and Manufacturing, Technical and Scientific Products:
| Metropolitan area | Employment (1) | Employment per thousand jobs | Location quotient (9) | Hourly mean wage | Annual mean wage (2) |
|---|---|---|---|---|---|
| New York-Newark-Jersey City, NY-NJ-PA | 11,130 | 1.28 | 0.68 | $ 57.83 | $ 120,280 |
| Dallas-Fort Worth-Arlington, TX | 9,670 | 2.69 | 1.43 | $ 49.25 | $ 102,440 |
| Boston-Cambridge-Nashua, MA-NH | 9,520 | 3.68 | 1.95 | $ 58.86 | $ 122,430 |
| Los Angeles-Long Beach-Anaheim, CA | 9,430 | 1.65 | 0.87 | $ 46.52 | $ 96,770 |
| San Jose-Sunnyvale-Santa Clara, CA | 8,420 | 7.88 | 4.17 | $ 72.48 | $ 150,760 |
| Seattle-Tacoma-Bellevue, WA | 6,460 | 3.37 | 1.78 | $ 59.77 | $ 124,330 |
| Miami-Fort Lauderdale-West Palm Beach, FL | 6,140 | 2.51 | 1.33 | $ 43.48 | $ 90,450 |
| Atlanta-Sandy Springs-Roswell, GA | 6,040 | 2.33 | 1.24 | $ 47.50 | $ 98,790 |
| San Francisco-Oakland-Hayward, CA | 5,670 | 2.53 | 1.34 | $ 57.95 | $ 120,530 |
| Houston-The Woodlands-Sugar Land, TX | 5,230 | 1.80 | 0.96 | $ 47.22 | $ 98,210 |
Metropolitan areas with the highest concentration of jobs and location quotients in Sales Representatives, Wholesale and Manufacturing, Technical and Scientific Products:
| Metropolitan area | Employment (1) | Employment per thousand jobs | Location quotient (9) | Hourly mean wage | Annual mean wage (2) |
|---|---|---|---|---|---|
| San Jose-Sunnyvale-Santa Clara, CA | 8,420 | 7.88 | 4.17 | $ 72.48 | $ 150,760 |
| Durham-Chapel Hill, NC | 1,670 | 5.35 | 2.83 | $ 68.02 | $ 141,470 |
| Memphis, TN-MS-AR | 3,130 | 5.18 | 2.74 | $ 40.81 | $ 84,880 |
| Nashville-Davidson--Murfreesboro--Franklin, TN | 5,030 | 5.15 | 2.73 | $ 38.30 | $ 79,670 |
| Provo-Orem, UT | 1,360 | 5.00 | 2.64 | $ 34.68 | $ 72,130 |
| Raleigh, NC | 3,030 | 4.79 | 2.53 | $ 52.35 | $ 108,900 |
| Knoxville, TN | 1,810 | 4.71 | 2.49 | $ 36.72 | $ 76,380 |
| Tulsa, OK | 1,920 | 4.58 | 2.43 | $ 38.17 | $ 79,390 |
| Oklahoma City, OK | 2,700 | 4.47 | 2.37 | $ 37.67 | $ 78,350 |
| Madison, WI | 1,660 | 4.40 | 2.33 | $ 34.70 | $ 72,170 |
Top paying metropolitan areas for Sales Representatives, Wholesale and Manufacturing, Technical and Scientific Products:
| Metropolitan area | Employment (1) | Employment per thousand jobs | Location quotient (9) | Hourly mean wage | Annual mean wage (2) |
|---|---|---|---|---|---|
| San Jose-Sunnyvale-Santa Clara, CA | 8,420 | 7.88 | 4.17 | $ 72.48 | $ 150,760 |
| Durham-Chapel Hill, NC | 1,670 | 5.35 | 2.83 | $ 68.02 | $ 141,470 |
| Iowa City, IA | 120 | 1.40 | 0.74 | $ 66.77 | $ 138,870 |
| Rochester, NY | 1,190 | 2.52 | 1.34 | $ 63.92 | $ 132,950 |
| Yakima, WA | 50 | 0.54 | 0.28 | $ 63.25 | $ 131,550 |
| Washington-Arlington-Alexandria, DC-VA-MD-WV | 4,840 | 1.65 | 0.87 | $ 62.64 | $ 130,290 |
| Olympia-Tumwater, WA | 250 | 2.19 | 1.16 | $ 61.21 | $ 127,310 |
| Ames, IA | 80 | 1.76 | 0.93 | $ 60.57 | $ 125,990 |
| Casper, WY | 60 | 1.68 | 0.89 | $ 60.38 | $ 125,590 |
| Seattle-Tacoma-Bellevue, WA | 6,460 | 3.37 | 1.78 | $ 59.77 | $ 124,330 |
Nonmetropolitan areas with the highest employment in Sales Representatives, Wholesale and Manufacturing, Technical and Scientific Products:
| Nonmetropolitan area | Employment (1) | Employment per thousand jobs | Location quotient (9) | Hourly mean wage | Annual mean wage (2) |
|---|---|---|---|---|---|
| East South Dakota nonmetropolitan area | 410 | 3.26 | 1.72 | $ 45.98 | $ 95,640 |
| West Tennessee nonmetropolitan area | 410 | 3.26 | 1.73 | $ 34.84 | $ 72,460 |
| Southeast Oklahoma nonmetropolitan area | 320 | 1.99 | 1.05 | $ 32.63 | $ 67,870 |
| North Central Tennessee nonmetropolitan area | 260 | 2.36 | 1.25 | $ 31.34 | $ 65,190 |
| South Central Tennessee nonmetropolitan area | 240 | 2.28 | 1.21 | $ 32.85 | $ 68,330 |
Nonmetropolitan areas with the highest concentration of jobs and location quotients in Sales Representatives, Wholesale and Manufacturing, Technical and Scientific Products:
| Nonmetropolitan area | Employment (1) | Employment per thousand jobs | Location quotient (9) | Hourly mean wage | Annual mean wage (2) |
|---|---|---|---|---|---|
| West Tennessee nonmetropolitan area | 410 | 3.26 | 1.73 | $ 34.84 | $ 72,460 |
| East South Dakota nonmetropolitan area | 410 | 3.26 | 1.72 | $ 45.98 | $ 95,640 |
| Southwest Oklahoma nonmetropolitan area | 160 | 2.81 | 1.49 | $ 27.14 | $ 56,440 |
| North Central Tennessee nonmetropolitan area | 260 | 2.36 | 1.25 | $ 31.34 | $ 65,190 |
| Northwest Oklahoma nonmetropolitan area | 210 | 2.32 | 1.23 | $ 31.59 | $ 65,700 |
Top paying nonmetropolitan areas for Sales Representatives, Wholesale and Manufacturing, Technical and Scientific Products:
| Nonmetropolitan area | Employment (1) | Employment per thousand jobs | Location quotient (9) | Hourly mean wage | Annual mean wage (2) |
|---|---|---|---|---|---|
| Eastern Wyoming nonmetropolitan area | 80 | 1.03 | 0.55 | $ 57.49 | $ 119,580 |
| Central Oregon nonmetropolitan area | 30 | 0.57 | 0.30 | $ 54.03 | $ 112,390 |
| Coast Oregon nonmetropolitan area | 50 | 0.47 | 0.25 | $ 53.81 | $ 111,930 |
| Capital/Northern New York nonmetropolitan area | 60 | 0.44 | 0.23 | $ 53.81 | $ 111,920 |
| Western Washington nonmetropolitan area | 40 | 0.31 | 0.16 | $ 53.58 | $ 111,440 |
These estimates are calculated with data collected from employers in all industry sectors, all metropolitan and nonmetropolitan areas, and all states and the District of Columbia. The top employment and wage figures are provided above. The complete list is available in the downloadable XLS files.
The percentile wage estimate is the value of a wage below which a certain percent of workers fall. The median wage is the 50th percentile wage estimate—50 percent of workers earn less than the median and 50 percent of workers earn more than the median. More about percentile wages.
(1) Estimates for detailed occupations do not sum to the totals because the totals include occupations not shown separately. Estimates do not include self-employed workers.
(2) Annual wages have been calculated by multiplying the hourly mean wage by a "year-round, full-time" hours figure of 2,080 hours; for those occupations where there is not an hourly wage published, the annual wage has been directly calculated from the reported survey data.
(3) The relative standard error (RSE) is a measure of the reliability of a survey statistic. The smaller the relative standard error, the more precise the estimate.
(8) Estimate not released.
(9) The location quotient is the ratio of the area concentration of occupational employment to the national average concentration. A location quotient greater than one indicates the occupation has a higher share of employment than average, and a location quotient less than one indicates the occupation is less prevalent in the area than average.
Other OEWS estimates and related information:
May 2021 National Occupational Employment and Wage Estimates
May 2021 State Occupational Employment and Wage Estimates
May 2021 Metropolitan and Nonmetropolitan Area Occupational Employment and Wage Estimates
May 2021 National Industry-Specific Occupational Employment and Wage Estimates
Last Modified Date: March 31, 2022