
An official website of the United States government
An official website of the United States government
The .gov means it's official.
Federal government websites often end in .gov or .mil. Before sharing sensitive information,
make sure you're on a federal government site.
The site is secure.
The
https:// ensures that you are connecting to the official website and that any
information you provide is encrypted and transmitted securely.
Rent, buy, or sell property for clients. Perform duties such as study property listings, interview prospective clients, accompany clients to property site, discuss conditions of sale, and draw up real estate contracts. Includes agents who represent buyer.
Employment estimate and mean wage estimates for Real Estate Sales Agents:
| Employment (1) | Employment RSE (3) |
Mean hourly wage |
Mean annual wage (2) |
Wage RSE (3) |
|---|---|---|---|---|
| 175,920 | 3.8 % | $ 29.56 | $ 61,480 | 1.8 % |
Percentile wage estimates for Real Estate Sales Agents:
| Percentile | 10% | 25% | 50% (Median) |
75% | 90% |
|---|---|---|---|---|---|
| Hourly Wage | $ 13.59 | $ 17.25 | $ 23.24 | $ 36.51 | $ 49.12 |
| Annual Wage (2) | $ 28,270 | $ 35,880 | $ 48,340 | $ 75,940 | $ 102,170 |
Industries with the highest published employment and wages for Real Estate Sales Agents are provided. For a list of all industries with employment in Real Estate Sales Agents, see the Create Customized Tables function.
Industries with the highest levels of employment in Real Estate Sales Agents:
| Industry | Employment (1) | Percent of industry employment | Hourly mean wage | Annual mean wage (2) |
|---|---|---|---|---|
| Real Estate | 141,630 | 8.47 | $ 27.94 | $ 58,120 |
| Residential Building Construction | 9,980 | 1.19 | $ 33.48 | $ 69,640 |
| Federal Executive Branch (OEWS Designation) | 3,050 | 0.14 | $ 40.83 | $ 84,930 |
| Management of Companies and Enterprises | 2,830 | 0.11 | $ 42.01 | $ 87,370 |
| Employment Services | 2,480 | 0.07 | $ 22.88 | $ 47,590 |
Industries with the highest concentration of employment in Real Estate Sales Agents:
| Industry | Employment (1) | Percent of industry employment | Hourly mean wage | Annual mean wage (2) |
|---|---|---|---|---|
| Real Estate | 141,630 | 8.47 | $ 27.94 | $ 58,120 |
| Land Subdivision | 1,270 | 3.82 | $ 39.79 | $ 82,770 |
| Oil and Gas Extraction | 1,370 | 1.29 | $ 59.02 | $ 122,760 |
| Residential Building Construction | 9,980 | 1.19 | $ 33.48 | $ 69,640 |
| Other Investment Pools and Funds | 130 | 1.03 | $ 21.17 | $ 44,030 |
Top paying industries for Real Estate Sales Agents:
| Industry | Employment (1) | Percent of industry employment | Hourly mean wage | Annual mean wage (2) |
|---|---|---|---|---|
| Oil and Gas Extraction | 1,370 | 1.29 | $ 59.02 | $ 122,760 |
| Natural Gas Distribution | 230 | 0.21 | $ 57.13 | $ 118,830 |
| Pipeline Transportation of Natural Gas | 30 | 0.11 | $ 50.14 | $ 104,280 |
| Insurance Carriers | 60 | (7) | $ 44.73 | $ 93,040 |
| Electric Power Generation, Transmission and Distribution | 380 | 0.10 | $ 44.63 | $ 92,840 |
States and areas with the highest published employment, location quotients, and wages for Real Estate Sales Agents are provided. For a list of all areas with employment in Real Estate Sales Agents, see the Create Customized Tables function.
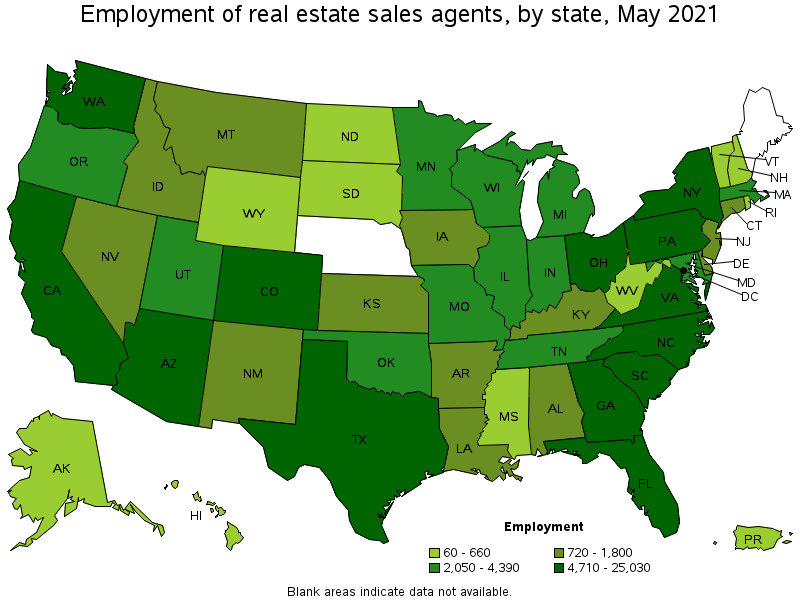
States with the highest employment level in Real Estate Sales Agents:
| State | Employment (1) | Employment per thousand jobs | Location quotient (9) | Hourly mean wage | Annual mean wage (2) |
|---|---|---|---|---|---|
| Florida | 25,030 | 2.91 | 2.33 | $ 27.14 | $ 56,460 |
| Texas | 22,720 | 1.86 | 1.49 | $ 28.49 | $ 59,250 |
| California | 14,800 | 0.90 | 0.72 | $ 36.75 | $ 76,440 |
| Virginia | 8,030 | 2.14 | 1.71 | $ 33.27 | $ 69,190 |
| Colorado | 7,630 | 2.91 | 2.33 | $ 34.21 | $ 71,160 |
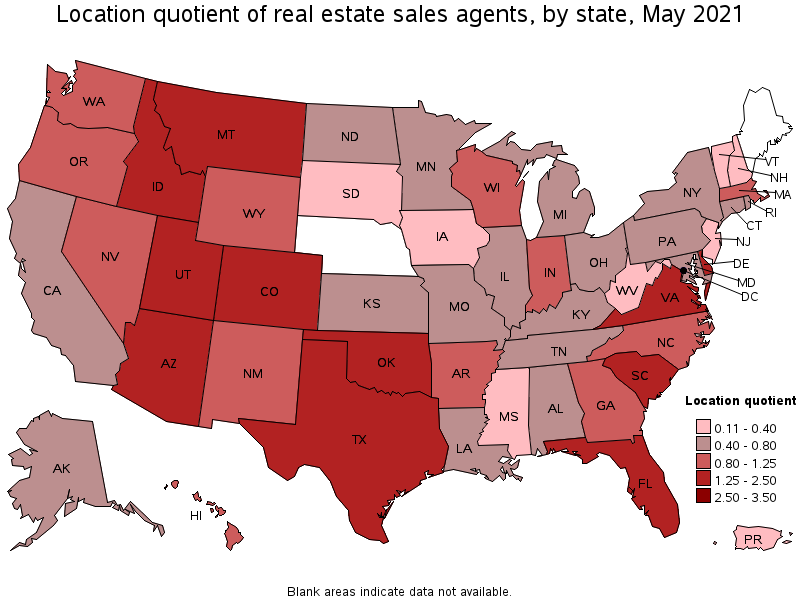
States with the highest concentration of jobs and location quotients in Real Estate Sales Agents:
| State | Employment (1) | Employment per thousand jobs | Location quotient (9) | Hourly mean wage | Annual mean wage (2) |
|---|---|---|---|---|---|
| Colorado | 7,630 | 2.91 | 2.33 | $ 34.21 | $ 71,160 |
| Florida | 25,030 | 2.91 | 2.33 | $ 27.14 | $ 56,460 |
| South Carolina | 5,450 | 2.64 | 2.11 | $ 25.94 | $ 53,960 |
| Delaware | 1,020 | 2.34 | 1.87 | $ 25.72 | $ 53,490 |
| Arizona | 6,680 | 2.32 | 1.86 | $ 24.21 | $ 50,370 |
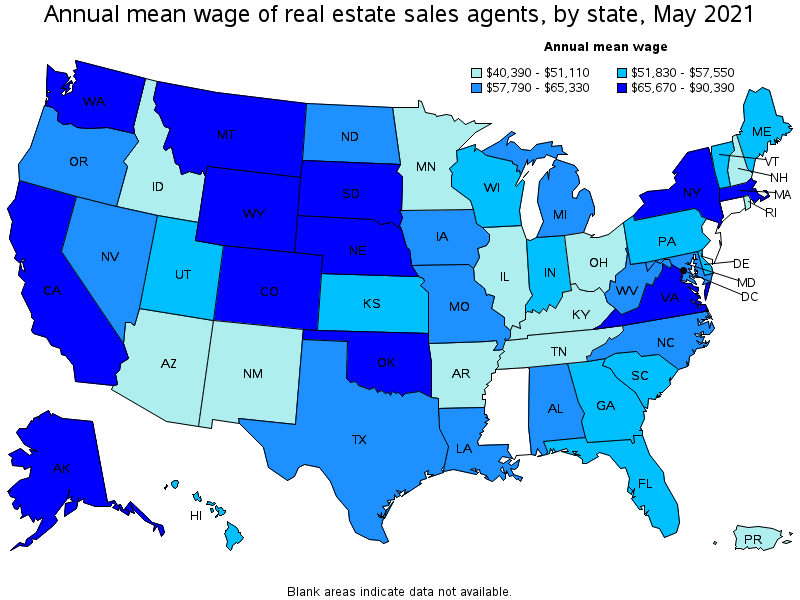
Top paying states for Real Estate Sales Agents:
| State | Employment (1) | Employment per thousand jobs | Location quotient (9) | Hourly mean wage | Annual mean wage (2) |
|---|---|---|---|---|---|
| Massachusetts | 3,370 | 0.99 | 0.80 | $ 43.46 | $ 90,390 |
| New York | 6,660 | 0.77 | 0.62 | $ 38.95 | $ 81,020 |
| Wyoming | 330 | 1.26 | 1.01 | $ 38.74 | $ 80,580 |
| District of Columbia | 400 | 0.61 | 0.49 | $ 37.36 | $ 77,710 |
| California | 14,800 | 0.90 | 0.72 | $ 36.75 | $ 76,440 |
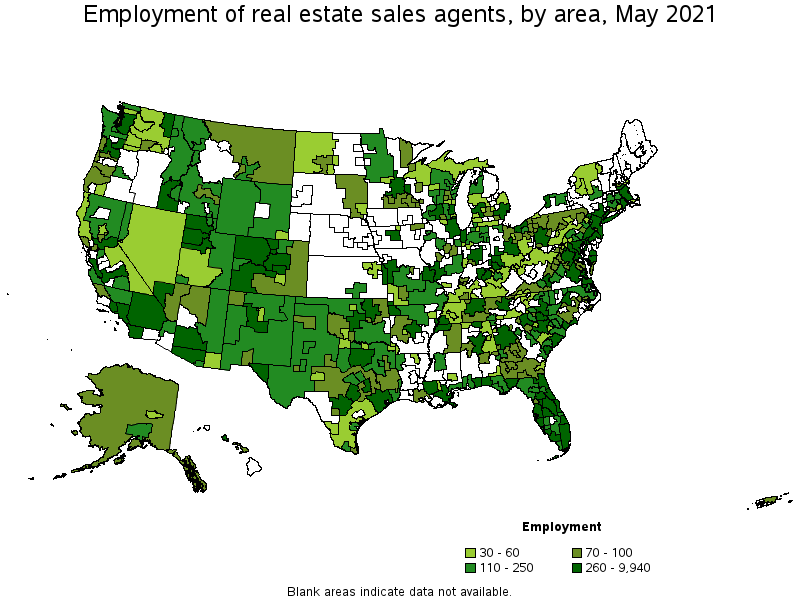
Metropolitan areas with the highest employment level in Real Estate Sales Agents:
| Metropolitan area | Employment (1) | Employment per thousand jobs | Location quotient (9) | Hourly mean wage | Annual mean wage (2) |
|---|---|---|---|---|---|
| Miami-Fort Lauderdale-West Palm Beach, FL | 9,940 | 4.05 | 3.25 | $ 27.18 | $ 56,530 |
| Houston-The Woodlands-Sugar Land, TX | 7,290 | 2.52 | 2.01 | $ 28.02 | $ 58,290 |
| Dallas-Fort Worth-Arlington, TX | 7,200 | 2.01 | 1.61 | $ 29.16 | $ 60,650 |
| New York-Newark-Jersey City, NY-NJ-PA | 7,120 | 0.82 | 0.66 | $ 41.66 | $ 86,650 |
| Los Angeles-Long Beach-Anaheim, CA | 6,960 | 1.22 | 0.98 | $ 35.97 | $ 74,820 |
| Phoenix-Mesa-Scottsdale, AZ | 5,590 | 2.64 | 2.11 | $ 24.19 | $ 50,310 |
| Denver-Aurora-Lakewood, CO | 4,180 | 2.86 | 2.29 | $ 36.10 | $ 75,090 |
| Washington-Arlington-Alexandria, DC-VA-MD-WV | 4,100 | 1.40 | 1.12 | $ 35.85 | $ 74,570 |
| Atlanta-Sandy Springs-Roswell, GA | 3,580 | 1.38 | 1.11 | $ 28.33 | $ 58,930 |
| Chicago-Naperville-Elgin, IL-IN-WI | 3,430 | 0.81 | 0.65 | $ 23.35 | $ 48,570 |
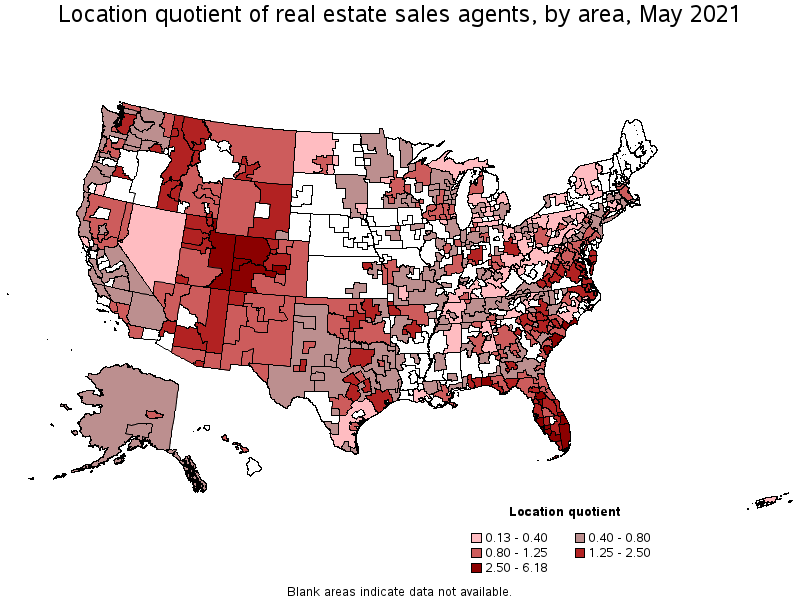
Metropolitan areas with the highest concentration of jobs and location quotients in Real Estate Sales Agents:
| Metropolitan area | Employment (1) | Employment per thousand jobs | Location quotient (9) | Hourly mean wage | Annual mean wage (2) |
|---|---|---|---|---|---|
| The Villages, FL | 260 | 7.71 | 6.18 | $ 23.93 | $ 49,770 |
| Hilton Head Island-Bluffton-Beaufort, SC | 460 | 6.14 | 4.92 | $ 29.14 | $ 60,600 |
| Naples-Immokalee-Marco Island, FL | 880 | 6.00 | 4.81 | (8) | (8) |
| Punta Gorda, FL | 240 | 4.99 | 4.00 | $ 33.63 | $ 69,940 |
| Cape Coral-Fort Myers, FL | 1,260 | 4.74 | 3.80 | $ 19.79 | $ 41,160 |
| Myrtle Beach-Conway-North Myrtle Beach, SC-NC | 710 | 4.34 | 3.48 | $ 25.66 | $ 53,380 |
| North Port-Sarasota-Bradenton, FL | 1,220 | 4.15 | 3.32 | $ 22.70 | $ 47,220 |
| Miami-Fort Lauderdale-West Palm Beach, FL | 9,940 | 4.05 | 3.25 | $ 27.18 | $ 56,530 |
| Sebastian-Vero Beach, FL | 210 | 4.05 | 3.24 | $ 26.69 | $ 55,520 |
| Grand Junction, CO | 250 | 3.96 | 3.17 | $ 32.36 | $ 67,300 |
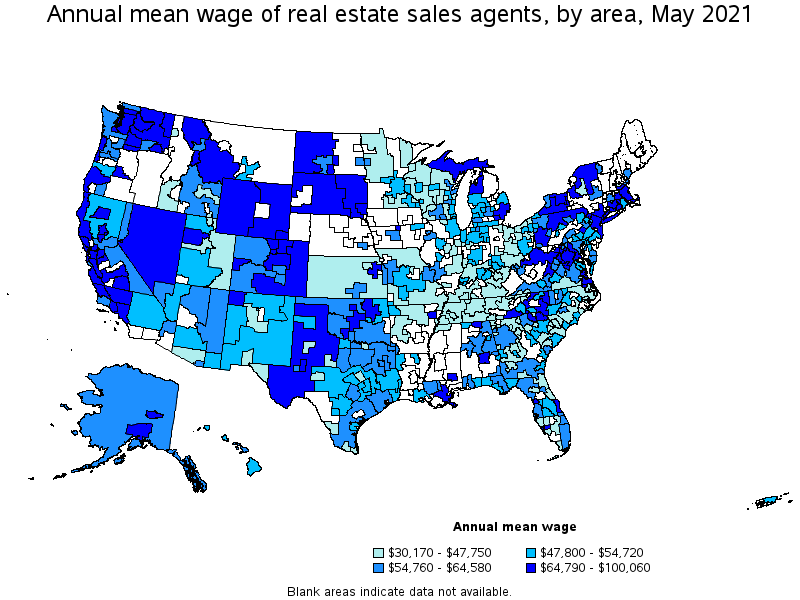
Top paying metropolitan areas for Real Estate Sales Agents:
| Metropolitan area | Employment (1) | Employment per thousand jobs | Location quotient (9) | Hourly mean wage | Annual mean wage (2) |
|---|---|---|---|---|---|
| Midland, TX | 250 | 2.66 | 2.13 | $ 48.11 | $ 100,060 |
| Bridgeport-Stamford-Norwalk, CT | 440 | 1.18 | 0.94 | $ 48.02 | $ 99,880 |
| Worcester, MA-CT | 170 | 0.63 | 0.50 | $ 44.90 | $ 93,400 |
| Greeley, CO | 150 | 1.50 | 1.20 | $ 44.48 | $ 92,520 |
| Boston-Cambridge-Nashua, MA-NH | 2,910 | 1.13 | 0.90 | $ 44.46 | $ 92,480 |
| Jonesboro, AR | 50 | 0.83 | 0.66 | $ 44.02 | $ 91,560 |
| New York-Newark-Jersey City, NY-NJ-PA | 7,120 | 0.82 | 0.66 | $ 41.66 | $ 86,650 |
| Redding, CA | (8) | (8) | (8) | $ 40.06 | $ 83,320 |
| Barnstable Town, MA | 60 | 0.65 | 0.52 | $ 39.49 | $ 82,140 |
| Hartford-West Hartford-East Hartford, CT | 250 | 0.46 | 0.37 | $ 39.03 | $ 81,180 |
Nonmetropolitan areas with the highest employment in Real Estate Sales Agents:
| Nonmetropolitan area | Employment (1) | Employment per thousand jobs | Location quotient (9) | Hourly mean wage | Annual mean wage (2) |
|---|---|---|---|---|---|
| Northwest Colorado nonmetropolitan area | 700 | 6.01 | 4.81 | $ 28.66 | $ 59,610 |
| Southwest Colorado nonmetropolitan area | 330 | 3.37 | 2.70 | $ 30.73 | $ 63,930 |
| Eastern Utah nonmetropolitan area | 250 | 3.14 | 2.52 | $ 19.73 | $ 41,040 |
| West Montana nonmetropolitan area | 220 | 2.90 | 2.32 | $ 36.49 | $ 75,890 |
| South Florida nonmetropolitan area | 210 | 2.82 | 2.26 | $ 19.44 | $ 40,440 |
Nonmetropolitan areas with the highest concentration of jobs and location quotients in Real Estate Sales Agents:
| Nonmetropolitan area | Employment (1) | Employment per thousand jobs | Location quotient (9) | Hourly mean wage | Annual mean wage (2) |
|---|---|---|---|---|---|
| Northwest Colorado nonmetropolitan area | 700 | 6.01 | 4.81 | $ 28.66 | $ 59,610 |
| Southwest Colorado nonmetropolitan area | 330 | 3.37 | 2.70 | $ 30.73 | $ 63,930 |
| Eastern Utah nonmetropolitan area | 250 | 3.14 | 2.52 | $ 19.73 | $ 41,040 |
| West Montana nonmetropolitan area | 220 | 2.90 | 2.32 | $ 36.49 | $ 75,890 |
| South Florida nonmetropolitan area | 210 | 2.82 | 2.26 | $ 19.44 | $ 40,440 |
Top paying nonmetropolitan areas for Real Estate Sales Agents:
| Nonmetropolitan area | Employment (1) | Employment per thousand jobs | Location quotient (9) | Hourly mean wage | Annual mean wage (2) |
|---|---|---|---|---|---|
| Eastern Wyoming nonmetropolitan area | 130 | 1.64 | 1.31 | $ 44.11 | $ 91,760 |
| Southwest Montana nonmetropolitan area | (8) | (8) | (8) | $ 43.98 | $ 91,490 |
| East South Dakota nonmetropolitan area | 70 | 0.53 | 0.42 | $ 37.63 | $ 78,280 |
| Upper Peninsula of Michigan nonmetropolitan area | 40 | 0.35 | 0.28 | $ 37.22 | $ 77,410 |
| Coast Oregon nonmetropolitan area | 80 | 0.76 | 0.61 | $ 37.08 | $ 77,130 |
These estimates are calculated with data collected from employers in all industry sectors, all metropolitan and nonmetropolitan areas, and all states and the District of Columbia. The top employment and wage figures are provided above. The complete list is available in the downloadable XLS files.
The percentile wage estimate is the value of a wage below which a certain percent of workers fall. The median wage is the 50th percentile wage estimate—50 percent of workers earn less than the median and 50 percent of workers earn more than the median. More about percentile wages.
(1) Estimates for detailed occupations do not sum to the totals because the totals include occupations not shown separately. Estimates do not include self-employed workers.
(2) Annual wages have been calculated by multiplying the hourly mean wage by a "year-round, full-time" hours figure of 2,080 hours; for those occupations where there is not an hourly wage published, the annual wage has been directly calculated from the reported survey data.
(3) The relative standard error (RSE) is a measure of the reliability of a survey statistic. The smaller the relative standard error, the more precise the estimate.
(7) The value is less than .005 percent of industry employment.
(8) Estimate not released.
(9) The location quotient is the ratio of the area concentration of occupational employment to the national average concentration. A location quotient greater than one indicates the occupation has a higher share of employment than average, and a location quotient less than one indicates the occupation is less prevalent in the area than average.
Other OEWS estimates and related information:
May 2021 National Occupational Employment and Wage Estimates
May 2021 State Occupational Employment and Wage Estimates
May 2021 Metropolitan and Nonmetropolitan Area Occupational Employment and Wage Estimates
May 2021 National Industry-Specific Occupational Employment and Wage Estimates
Last Modified Date: March 31, 2022