
An official website of the United States government
An official website of the United States government
The .gov means it's official.
Federal government websites often end in .gov or .mil. Before sharing sensitive information,
make sure you're on a federal government site.
The site is secure.
The
https:// ensures that you are connecting to the official website and that any
information you provide is encrypted and transmitted securely.
Sell business goods or services, the selling of which requires a technical background equivalent to a baccalaureate degree in engineering. Excludes �Engineers� (17-2011 through 17-2199) whose primary function is not marketing or sales.
Employment estimate and mean wage estimates for Sales Engineers:
| Employment (1) | Employment RSE (3) |
Mean hourly wage |
Mean annual wage (2) |
Wage RSE (3) |
|---|---|---|---|---|
| 59,550 | 2.9 % | $ 57.03 | $ 118,630 | 0.9 % |
Percentile wage estimates for Sales Engineers:
| Percentile | 10% | 25% | 50% (Median) |
75% | 90% |
|---|---|---|---|---|---|
| Hourly Wage | $ 29.95 | $ 38.41 | $ 49.86 | $ 74.57 | $ 87.91 |
| Annual Wage (2) | $ 62,300 | $ 79,900 | $ 103,710 | $ 155,110 | $ 182,850 |
Industries with the highest published employment and wages for Sales Engineers are provided. For a list of all industries with employment in Sales Engineers, see the Create Customized Tables function.
Industries with the highest levels of employment in Sales Engineers:
| Industry | Employment (1) | Percent of industry employment | Hourly mean wage | Annual mean wage (2) |
|---|---|---|---|---|
| Computer Systems Design and Related Services | 11,140 | 0.49 | $ 63.67 | $ 132,430 |
| Merchant Wholesalers, Durable Goods (4232, 4233, 4235, 4236, 4237, and 4239 only) | 4,470 | 0.33 | $ 55.47 | $ 115,370 |
| Professional and Commercial Equipment and Supplies Merchant Wholesalers | 4,280 | 0.64 | $ 61.96 | $ 128,870 |
| Software Publishers | 3,750 | 0.71 | $ 63.21 | $ 131,480 |
| Wholesale Electronic Markets and Agents and Brokers | 3,260 | 0.69 | $ 57.99 | $ 120,620 |
Industries with the highest concentration of employment in Sales Engineers:
| Industry | Employment (1) | Percent of industry employment | Hourly mean wage | Annual mean wage (2) |
|---|---|---|---|---|
| Computer and Peripheral Equipment Manufacturing | 2,120 | 1.36 | $ 67.98 | $ 141,400 |
| Software Publishers | 3,750 | 0.71 | $ 63.21 | $ 131,480 |
| Wholesale Electronic Markets and Agents and Brokers | 3,260 | 0.69 | $ 57.99 | $ 120,620 |
| Professional and Commercial Equipment and Supplies Merchant Wholesalers | 4,280 | 0.64 | $ 61.96 | $ 128,870 |
| Semiconductor and Other Electronic Component Manufacturing | 1,890 | 0.53 | $ 63.36 | $ 131,780 |
Top paying industries for Sales Engineers:
| Industry | Employment (1) | Percent of industry employment | Hourly mean wage | Annual mean wage (2) |
|---|---|---|---|---|
| Highway, Street, and Bridge Construction | 50 | 0.01 | $ 107.56 | $ 223,720 |
| Merchant Wholesalers, Nondurable Goods (4241, 4247, and 4249 only) | 80 | 0.01 | $ 77.41 | $ 161,020 |
| Architectural, Engineering, and Related Services | 2,560 | 0.17 | $ 68.84 | $ 143,190 |
| Computer and Peripheral Equipment Manufacturing | 2,120 | 1.36 | $ 67.98 | $ 141,400 |
| Other Information Services | 430 | 0.12 | $ 66.82 | $ 138,990 |
States and areas with the highest published employment, location quotients, and wages for Sales Engineers are provided. For a list of all areas with employment in Sales Engineers, see the Create Customized Tables function.
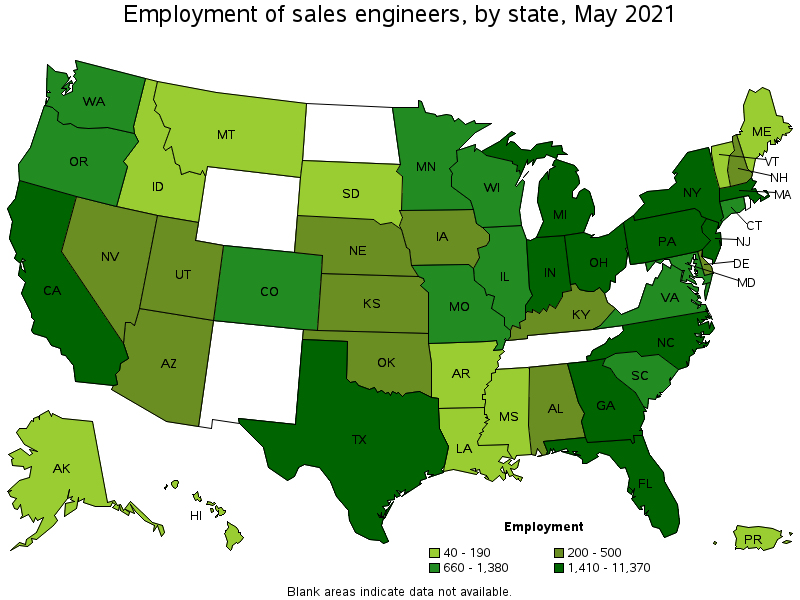
States with the highest employment level in Sales Engineers:
| State | Employment (1) | Employment per thousand jobs | Location quotient (9) | Hourly mean wage | Annual mean wage (2) |
|---|---|---|---|---|---|
| Texas | 11,370 | 0.93 | 2.20 | $ 56.97 | $ 118,490 |
| California | 10,390 | 0.63 | 1.49 | $ 65.44 | $ 136,120 |
| Massachusetts | 4,100 | 1.21 | 2.86 | $ 53.83 | $ 111,960 |
| New York | 2,890 | 0.33 | 0.79 | $ 60.28 | $ 125,380 |
| Pennsylvania | 2,720 | 0.49 | 1.15 | $ 49.11 | $ 102,150 |
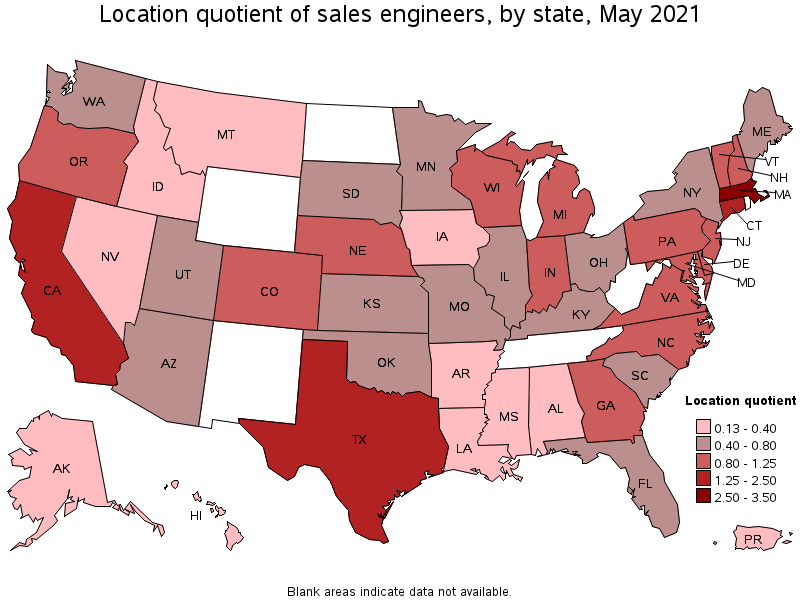
States with the highest concentration of jobs and location quotients in Sales Engineers:
| State | Employment (1) | Employment per thousand jobs | Location quotient (9) | Hourly mean wage | Annual mean wage (2) |
|---|---|---|---|---|---|
| Massachusetts | 4,100 | 1.21 | 2.86 | $ 53.83 | $ 111,960 |
| Texas | 11,370 | 0.93 | 2.20 | $ 56.97 | $ 118,490 |
| Connecticut | 1,010 | 0.64 | 1.52 | $ 46.82 | $ 97,380 |
| California | 10,390 | 0.63 | 1.49 | $ 65.44 | $ 136,120 |
| Maryland | 1,300 | 0.51 | 1.21 | $ 72.57 | $ 150,950 |
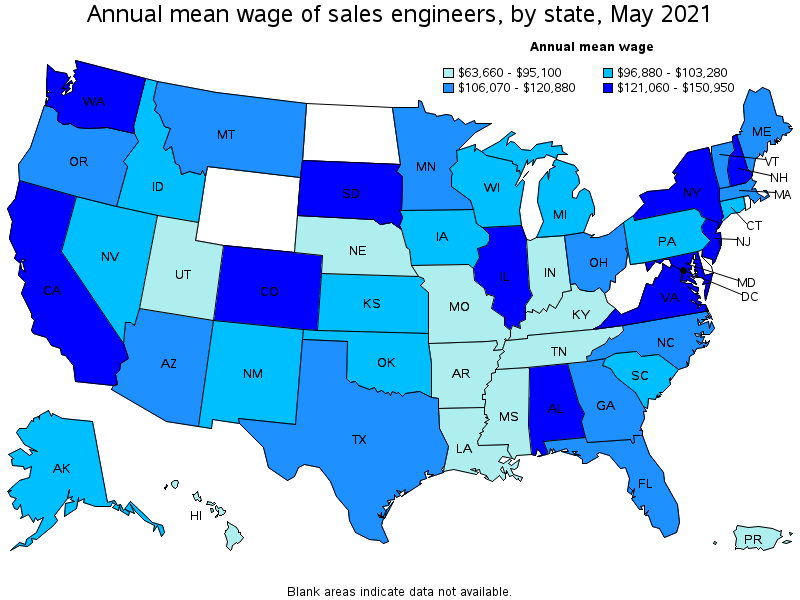
Top paying states for Sales Engineers:
| State | Employment (1) | Employment per thousand jobs | Location quotient (9) | Hourly mean wage | Annual mean wage (2) |
|---|---|---|---|---|---|
| Maryland | 1,300 | 0.51 | 1.21 | $ 72.57 | $ 150,950 |
| Colorado | 1,290 | 0.49 | 1.17 | $ 66.06 | $ 137,400 |
| California | 10,390 | 0.63 | 1.49 | $ 65.44 | $ 136,120 |
| Virginia | 1,380 | 0.37 | 0.87 | $ 65.16 | $ 135,530 |
| Washington | 870 | 0.27 | 0.64 | $ 63.89 | $ 132,890 |
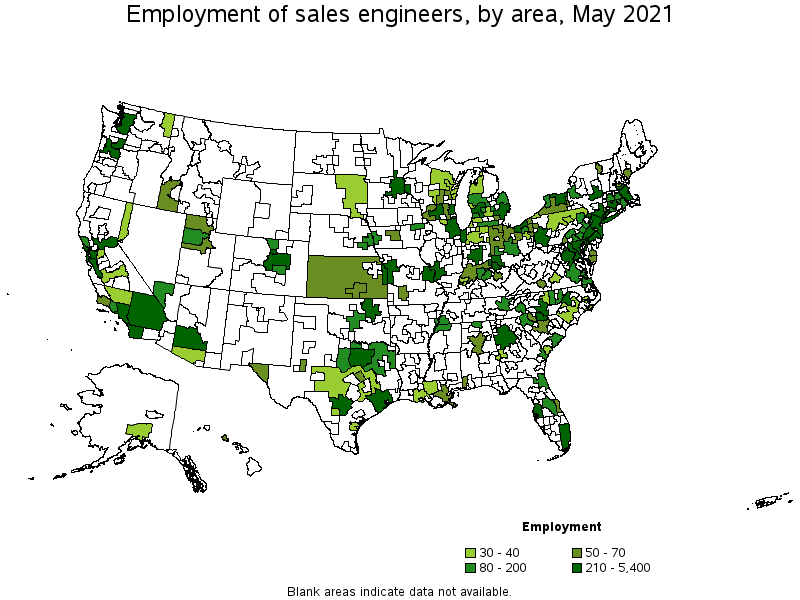
Metropolitan areas with the highest employment level in Sales Engineers:
| Metropolitan area | Employment (1) | Employment per thousand jobs | Location quotient (9) | Hourly mean wage | Annual mean wage (2) |
|---|---|---|---|---|---|
| Dallas-Fort Worth-Arlington, TX | 5,400 | 1.50 | 3.56 | $ 55.72 | $ 115,900 |
| San Jose-Sunnyvale-Santa Clara, CA | 3,920 | 3.67 | 8.68 | $ 76.11 | $ 158,320 |
| Boston-Cambridge-Nashua, MA-NH | 3,570 | 1.38 | 3.26 | $ 55.02 | $ 114,450 |
| New York-Newark-Jersey City, NY-NJ-PA | 3,050 | 0.35 | 0.83 | $ 65.47 | $ 136,170 |
| Los Angeles-Long Beach-Anaheim, CA | 2,220 | 0.39 | 0.92 | $ 55.72 | $ 115,900 |
| Houston-The Woodlands-Sugar Land, TX | 2,060 | 0.71 | 1.68 | $ 57.77 | $ 120,170 |
| San Francisco-Oakland-Hayward, CA | 1,810 | 0.81 | 1.91 | $ 70.27 | $ 146,150 |
| Atlanta-Sandy Springs-Roswell, GA | 1,670 | 0.65 | 1.53 | $ 60.79 | $ 126,440 |
| Philadelphia-Camden-Wilmington, PA-NJ-DE-MD | 1,220 | 0.46 | 1.09 | $ 59.12 | $ 122,980 |
| Washington-Arlington-Alexandria, DC-VA-MD-WV | 1,170 | 0.40 | 0.94 | $ 73.18 | $ 152,200 |
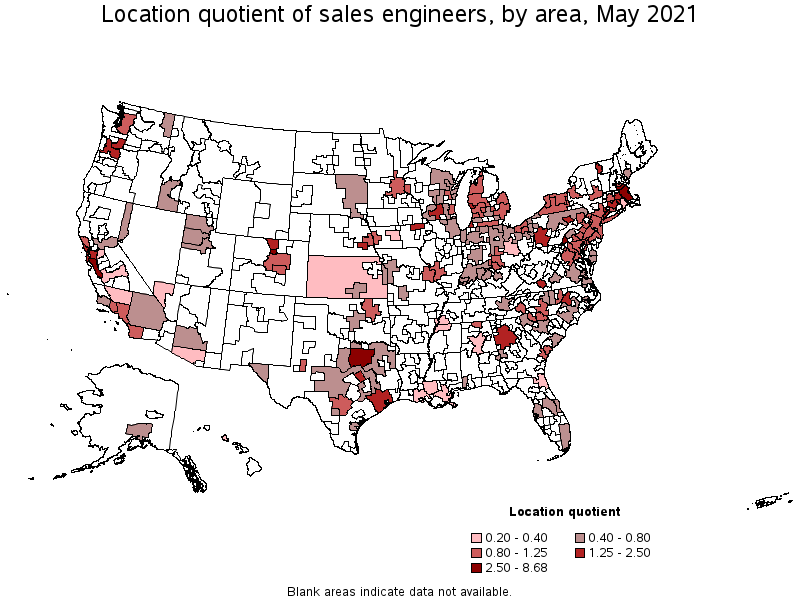
Metropolitan areas with the highest concentration of jobs and location quotients in Sales Engineers:
| Metropolitan area | Employment (1) | Employment per thousand jobs | Location quotient (9) | Hourly mean wage | Annual mean wage (2) |
|---|---|---|---|---|---|
| San Jose-Sunnyvale-Santa Clara, CA | 3,920 | 3.67 | 8.68 | $ 76.11 | $ 158,320 |
| Dallas-Fort Worth-Arlington, TX | 5,400 | 1.50 | 3.56 | $ 55.72 | $ 115,900 |
| Boston-Cambridge-Nashua, MA-NH | 3,570 | 1.38 | 3.26 | $ 55.02 | $ 114,450 |
| Boulder, CO | 240 | 1.30 | 3.07 | $ 70.19 | $ 145,990 |
| Chambersburg-Waynesboro, PA | 70 | 1.19 | 2.81 | $ 49.75 | $ 103,470 |
| Danbury, CT | 70 | 0.97 | 2.30 | $ 47.35 | $ 98,490 |
| Blacksburg-Christiansburg-Radford, VA | 60 | 0.81 | 1.92 | $ 51.58 | $ 107,280 |
| San Francisco-Oakland-Hayward, CA | 1,810 | 0.81 | 1.91 | $ 70.27 | $ 146,150 |
| Madison, WI | 270 | 0.72 | 1.69 | $ 49.59 | $ 103,160 |
| Bridgeport-Stamford-Norwalk, CT | 270 | 0.71 | 1.69 | $ 50.53 | $ 105,090 |
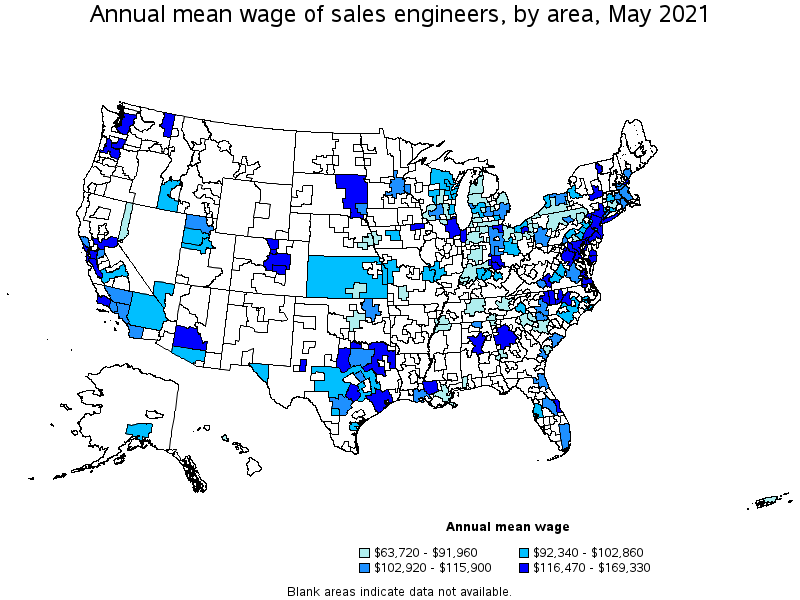
Top paying metropolitan areas for Sales Engineers:
| Metropolitan area | Employment (1) | Employment per thousand jobs | Location quotient (9) | Hourly mean wage | Annual mean wage (2) |
|---|---|---|---|---|---|
| Salisbury, MD-DE | 50 | 0.32 | 0.76 | $ 81.41 | $ 169,330 |
| Birmingham-Hoover, AL | 60 | 0.13 | 0.32 | $ 76.32 | $ 158,740 |
| San Jose-Sunnyvale-Santa Clara, CA | 3,920 | 3.67 | 8.68 | $ 76.11 | $ 158,320 |
| Washington-Arlington-Alexandria, DC-VA-MD-WV | 1,170 | 0.40 | 0.94 | $ 73.18 | $ 152,200 |
| Toledo, OH | 70 | 0.24 | 0.58 | $ 70.86 | $ 147,390 |
| Baltimore-Columbia-Towson, MD | 490 | 0.39 | 0.91 | $ 70.63 | $ 146,900 |
| San Francisco-Oakland-Hayward, CA | 1,810 | 0.81 | 1.91 | $ 70.27 | $ 146,150 |
| Boulder, CO | 240 | 1.30 | 3.07 | $ 70.19 | $ 145,990 |
| Fort Collins, CO | 90 | 0.59 | 1.40 | $ 69.28 | $ 144,090 |
| Palm Bay-Melbourne-Titusville, FL | 70 | 0.33 | 0.77 | $ 68.53 | $ 142,530 |
Nonmetropolitan areas with the highest employment in Sales Engineers:
| Nonmetropolitan area | Employment (1) | Employment per thousand jobs | Location quotient (9) | Hourly mean wage | Annual mean wage (2) |
|---|---|---|---|---|---|
| Balance of Lower Peninsula of Michigan nonmetropolitan area | 90 | 0.37 | 0.88 | $ 41.51 | $ 86,340 |
| North Texas Region of Texas nonmetropolitan area | 80 | 0.31 | 0.74 | $ 56.00 | $ 116,470 |
| West Northwestern Ohio nonmetropolitan area | 70 | 0.28 | 0.65 | $ 49.85 | $ 103,680 |
| North Northeastern Ohio nonmetropolitan area (noncontiguous) | 60 | 0.20 | 0.48 | $ 43.11 | $ 89,660 |
| Southwest New York nonmetropolitan area | 60 | 0.37 | 0.88 | $ 37.53 | $ 78,050 |
Nonmetropolitan areas with the highest concentration of jobs and location quotients in Sales Engineers:
| Nonmetropolitan area | Employment (1) | Employment per thousand jobs | Location quotient (9) | Hourly mean wage | Annual mean wage (2) |
|---|---|---|---|---|---|
| Balance of Lower Peninsula of Michigan nonmetropolitan area | 90 | 0.37 | 0.88 | $ 41.51 | $ 86,340 |
| Southwest New York nonmetropolitan area | 60 | 0.37 | 0.88 | $ 37.53 | $ 78,050 |
| Northwest Lower Peninsula of Michigan nonmetropolitan area | 40 | 0.34 | 0.82 | $ 40.18 | $ 83,570 |
| North Texas Region of Texas nonmetropolitan area | 80 | 0.31 | 0.74 | $ 56.00 | $ 116,470 |
| East South Dakota nonmetropolitan area | 40 | 0.30 | 0.70 | $ 66.56 | $ 138,430 |
Top paying nonmetropolitan areas for Sales Engineers:
| Nonmetropolitan area | Employment (1) | Employment per thousand jobs | Location quotient (9) | Hourly mean wage | Annual mean wage (2) |
|---|---|---|---|---|---|
| East South Dakota nonmetropolitan area | 40 | 0.30 | 0.70 | $ 66.56 | $ 138,430 |
| North Texas Region of Texas nonmetropolitan area | 80 | 0.31 | 0.74 | $ 56.00 | $ 116,470 |
| West Northwestern Ohio nonmetropolitan area | 70 | 0.28 | 0.65 | $ 49.85 | $ 103,680 |
| Northeastern Wisconsin nonmetropolitan area | 30 | 0.17 | 0.40 | $ 49.25 | $ 102,430 |
| Hill Country Region of Texas nonmetropolitan area | 30 | 0.18 | 0.43 | $ 47.85 | $ 99,540 |
These estimates are calculated with data collected from employers in all industry sectors, all metropolitan and nonmetropolitan areas, and all states and the District of Columbia. The top employment and wage figures are provided above. The complete list is available in the downloadable XLS files.
The percentile wage estimate is the value of a wage below which a certain percent of workers fall. The median wage is the 50th percentile wage estimate—50 percent of workers earn less than the median and 50 percent of workers earn more than the median. More about percentile wages.
(1) Estimates for detailed occupations do not sum to the totals because the totals include occupations not shown separately. Estimates do not include self-employed workers.
(2) Annual wages have been calculated by multiplying the hourly mean wage by a "year-round, full-time" hours figure of 2,080 hours; for those occupations where there is not an hourly wage published, the annual wage has been directly calculated from the reported survey data.
(3) The relative standard error (RSE) is a measure of the reliability of a survey statistic. The smaller the relative standard error, the more precise the estimate.
(9) The location quotient is the ratio of the area concentration of occupational employment to the national average concentration. A location quotient greater than one indicates the occupation has a higher share of employment than average, and a location quotient less than one indicates the occupation is less prevalent in the area than average.
Other OEWS estimates and related information:
May 2021 National Occupational Employment and Wage Estimates
May 2021 State Occupational Employment and Wage Estimates
May 2021 Metropolitan and Nonmetropolitan Area Occupational Employment and Wage Estimates
May 2021 National Industry-Specific Occupational Employment and Wage Estimates
Last Modified Date: March 31, 2022