
An official website of the United States government
An official website of the United States government
The .gov means it's official.
Federal government websites often end in .gov or .mil. Before sharing sensitive information,
make sure you're on a federal government site.
The site is secure.
The
https:// ensures that you are connecting to the official website and that any
information you provide is encrypted and transmitted securely.
Solicit donations or orders for goods or services over the telephone.
Employment estimate and mean wage estimates for Telemarketers:
| Employment (1) | Employment RSE (3) |
Mean hourly wage |
Mean annual wage (2) |
Wage RSE (3) |
|---|---|---|---|---|
| 115,130 | 3.2 % | $ 14.74 | $ 30,670 | 1.3 % |
Percentile wage estimates for Telemarketers:
| Percentile | 10% | 25% | 50% (Median) |
75% | 90% |
|---|---|---|---|---|---|
| Hourly Wage | $ 9.36 | $ 11.28 | $ 13.90 | $ 16.58 | $ 21.73 |
| Annual Wage (2) | $ 19,470 | $ 23,470 | $ 28,910 | $ 34,480 | $ 45,190 |
Industries with the highest published employment and wages for Telemarketers are provided. For a list of all industries with employment in Telemarketers, see the Create Customized Tables function.
Industries with the highest levels of employment in Telemarketers:
| Industry | Employment (1) | Percent of industry employment | Hourly mean wage | Annual mean wage (2) |
|---|---|---|---|---|
| Business Support Services | 76,700 | 9.29 | $ 13.37 | $ 27,820 |
| Management, Scientific, and Technical Consulting Services | 5,760 | 0.37 | $ 15.15 | $ 31,520 |
| Credit Intermediation and Related Activities (5221 and 5223 only) | 3,650 | 0.18 | $ 18.09 | $ 37,620 |
| Telecommunications | 3,010 | 0.45 | $ 17.25 | $ 35,880 |
| Employment Services | 2,890 | 0.08 | $ 14.66 | $ 30,490 |
Industries with the highest concentration of employment in Telemarketers:
| Industry | Employment (1) | Percent of industry employment | Hourly mean wage | Annual mean wage (2) |
|---|---|---|---|---|
| Business Support Services | 76,700 | 9.29 | $ 13.37 | $ 27,820 |
| Direct Selling Establishments | 1,480 | 1.14 | $ 14.47 | $ 30,090 |
| Telecommunications | 3,010 | 0.45 | $ 17.25 | $ 35,880 |
| Management, Scientific, and Technical Consulting Services | 5,760 | 0.37 | $ 15.15 | $ 31,520 |
| Other Information Services | 1,070 | 0.29 | $ 20.19 | $ 42,000 |
Top paying industries for Telemarketers:
| Industry | Employment (1) | Percent of industry employment | Hourly mean wage | Annual mean wage (2) |
|---|---|---|---|---|
| Computer and Peripheral Equipment Manufacturing | (8) | (8) | $ 27.84 | $ 57,910 |
| Agencies, Brokerages, and Other Insurance Related Activities | (8) | (8) | $ 25.96 | $ 54,000 |
| Electronics and Appliance Stores | 130 | 0.03 | $ 23.80 | $ 49,510 |
| Machinery, Equipment, and Supplies Merchant Wholesalers | 200 | 0.03 | $ 23.77 | $ 49,440 |
| Computer Systems Design and Related Services | 540 | 0.02 | $ 23.61 | $ 49,110 |
States and areas with the highest published employment, location quotients, and wages for Telemarketers are provided. For a list of all areas with employment in Telemarketers, see the Create Customized Tables function.
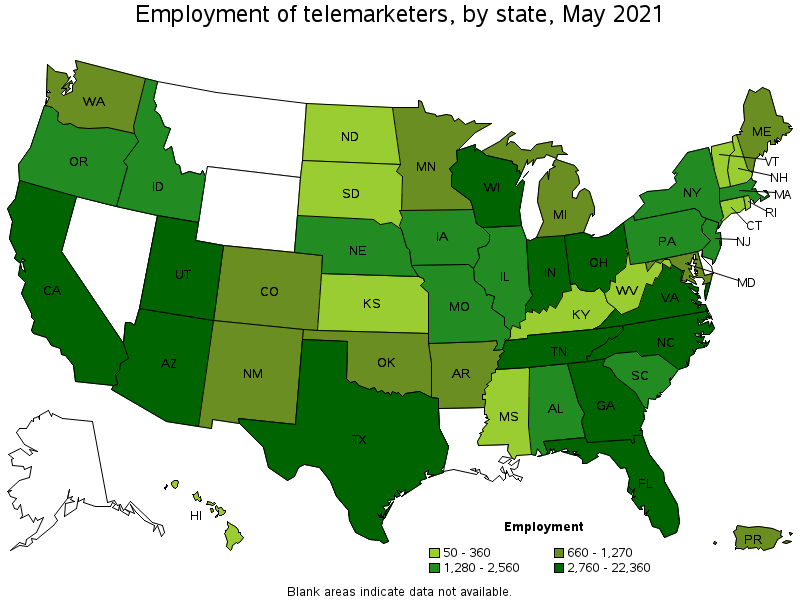
States with the highest employment level in Telemarketers:
| State | Employment (1) | Employment per thousand jobs | Location quotient (9) | Hourly mean wage | Annual mean wage (2) |
|---|---|---|---|---|---|
| Texas | 22,360 | 1.83 | 2.24 | $ 14.76 | $ 30,690 |
| Florida | 15,000 | 1.74 | 2.13 | $ 14.39 | $ 29,930 |
| Ohio | 8,150 | 1.57 | 1.92 | $ 13.59 | $ 28,280 |
| California | 7,030 | 0.43 | 0.52 | $ 17.20 | $ 35,780 |
| Utah | 4,340 | 2.79 | 3.42 | $ 14.39 | $ 29,940 |
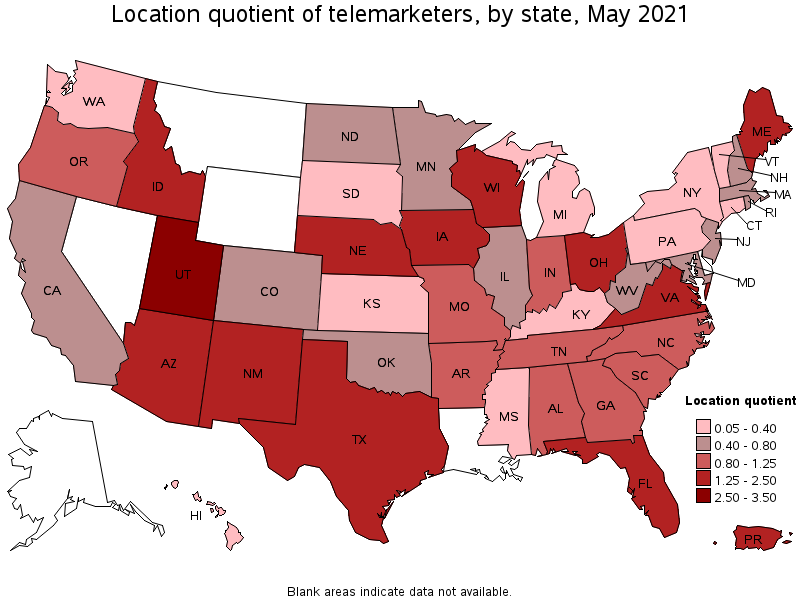
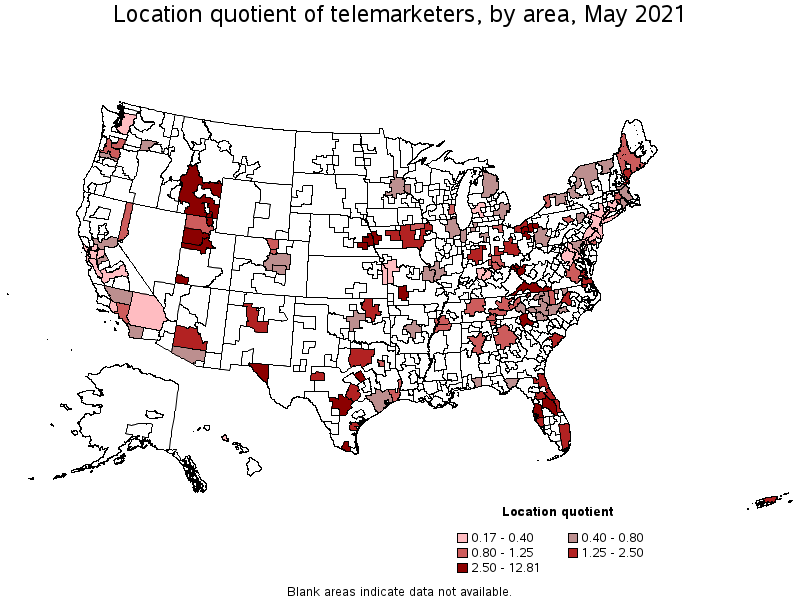
States with the highest concentration of jobs and location quotients in Telemarketers:
| State | Employment (1) | Employment per thousand jobs | Location quotient (9) | Hourly mean wage | Annual mean wage (2) |
|---|---|---|---|---|---|
| Utah | 4,340 | 2.79 | 3.42 | $ 14.39 | $ 29,940 |
| Nebraska | 1,930 | 2.02 | 2.47 | $ 11.44 | $ 23,800 |
| Texas | 22,360 | 1.83 | 2.24 | $ 14.76 | $ 30,690 |
| Florida | 15,000 | 1.74 | 2.13 | $ 14.39 | $ 29,930 |
| Idaho | 1,280 | 1.69 | 2.07 | $ 13.55 | $ 28,190 |
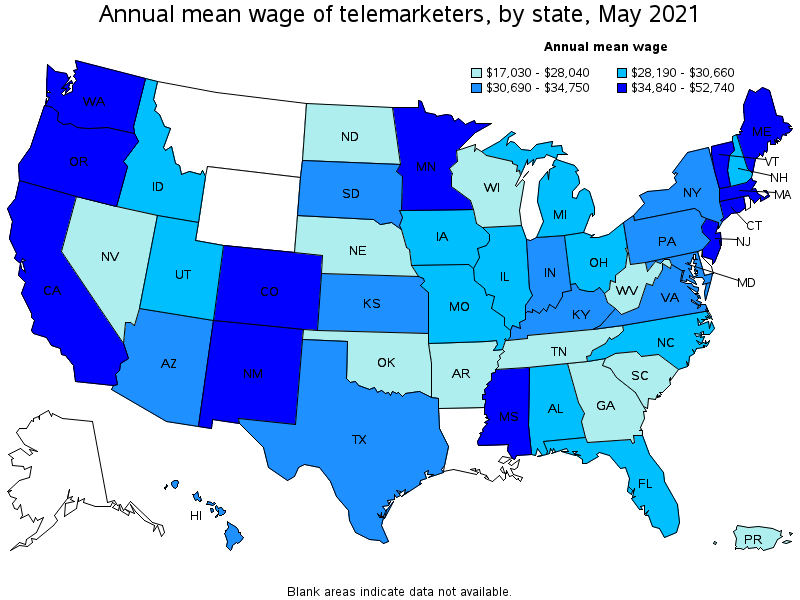
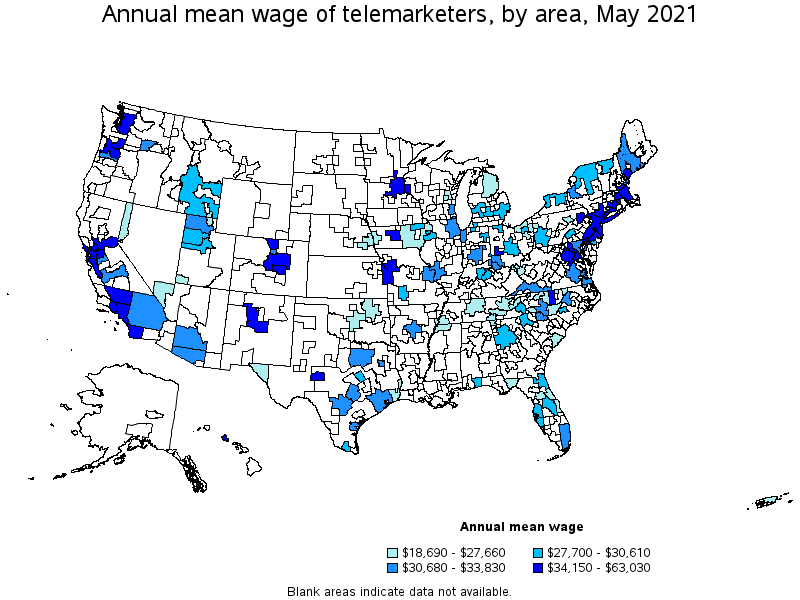
Top paying states for Telemarketers:
| State | Employment (1) | Employment per thousand jobs | Location quotient (9) | Hourly mean wage | Annual mean wage (2) |
|---|---|---|---|---|---|
| Connecticut | 300 | 0.19 | 0.23 | $ 25.35 | $ 52,740 |
| Minnesota | 1,010 | 0.37 | 0.45 | $ 21.53 | $ 44,780 |
| Washington | 1,030 | 0.32 | 0.39 | $ 19.79 | $ 41,150 |
| Massachusetts | 1,290 | 0.38 | 0.47 | $ 18.81 | $ 39,120 |
| New Jersey | 1,830 | 0.47 | 0.58 | $ 17.98 | $ 37,390 |
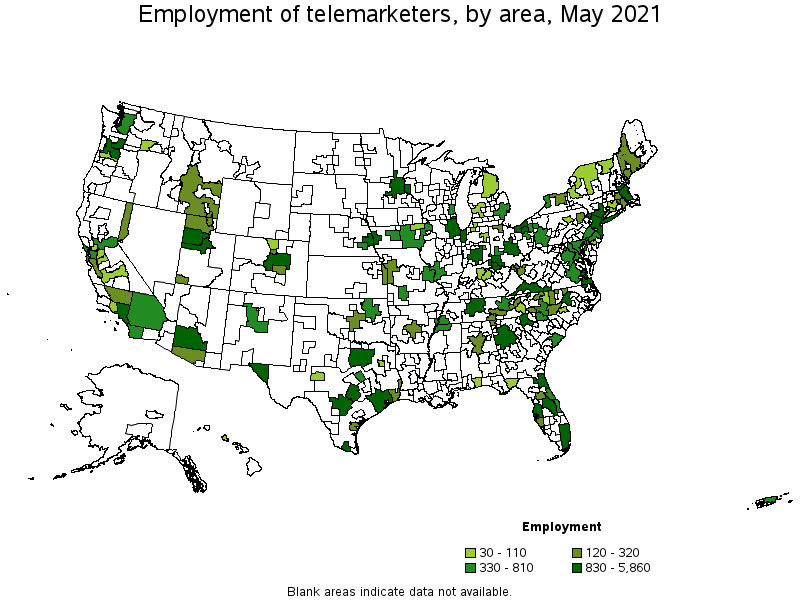
Metropolitan areas with the highest employment level in Telemarketers:
| Metropolitan area | Employment (1) | Employment per thousand jobs | Location quotient (9) | Hourly mean wage | Annual mean wage (2) |
|---|---|---|---|---|---|
| Dallas-Fort Worth-Arlington, TX | 5,860 | 1.63 | 2.00 | $ 15.89 | $ 33,040 |
| San Antonio-New Braunfels, TX | 4,180 | 4.19 | 5.13 | $ 15.28 | $ 31,790 |
| Miami-Fort Lauderdale-West Palm Beach, FL | 3,900 | 1.59 | 1.95 | $ 15.11 | $ 31,420 |
| Los Angeles-Long Beach-Anaheim, CA | 3,880 | 0.68 | 0.83 | $ 16.92 | $ 35,180 |
| Tampa-St. Petersburg-Clearwater, FL | 3,770 | 2.92 | 3.57 | $ 14.72 | $ 30,610 |
| Phoenix-Mesa-Scottsdale, AZ | 2,670 | 1.26 | 1.54 | $ 15.88 | $ 33,030 |
| Orlando-Kissimmee-Sanford, FL | 2,640 | 2.25 | 2.75 | $ 13.34 | $ 27,740 |
| Atlanta-Sandy Springs-Roswell, GA | 2,270 | 0.88 | 1.07 | $ 13.50 | $ 28,080 |
| Salt Lake City, UT | 2,260 | 3.04 | 3.72 | $ 14.70 | $ 30,580 |
| Columbus, OH | 2,070 | 2.02 | 2.47 | $ 13.68 | $ 28,460 |
Metropolitan areas with the highest concentration of jobs and location quotients in Telemarketers:
| Metropolitan area | Employment (1) | Employment per thousand jobs | Location quotient (9) | Hourly mean wage | Annual mean wage (2) |
|---|---|---|---|---|---|
| Provo-Orem, UT | 1,350 | 4.95 | 6.06 | $ 14.48 | $ 30,110 |
| El Paso, TX | 1,480 | 4.91 | 6.00 | $ 12.06 | $ 25,080 |
| Waco, TX | 500 | 4.32 | 5.28 | $ 13.64 | $ 28,370 |
| San Antonio-New Braunfels, TX | 4,180 | 4.19 | 5.13 | $ 15.28 | $ 31,790 |
| McAllen-Edinburg-Mission, TX | 1,060 | 4.04 | 4.94 | $ 13.37 | $ 27,820 |
| Canton-Massillon, OH | 620 | 3.89 | 4.76 | $ 13.30 | $ 27,660 |
| Muncie, IN | 150 | 3.52 | 4.30 | $ 14.81 | $ 30,800 |
| Springfield, MO | 640 | 3.12 | 3.82 | $ 13.38 | $ 27,830 |
| Akron, OH | 960 | 3.11 | 3.81 | $ 14.66 | $ 30,490 |
| Salt Lake City, UT | 2,260 | 3.04 | 3.72 | $ 14.70 | $ 30,580 |
Top paying metropolitan areas for Telemarketers:
| Metropolitan area | Employment (1) | Employment per thousand jobs | Location quotient (9) | Hourly mean wage | Annual mean wage (2) |
|---|---|---|---|---|---|
| Bridgeport-Stamford-Norwalk, CT | 90 | 0.25 | 0.31 | $ 30.30 | $ 63,030 |
| Hartford-West Hartford-East Hartford, CT | 90 | 0.17 | 0.21 | $ 23.62 | $ 49,120 |
| New Haven, CT | 40 | 0.15 | 0.19 | $ 23.41 | $ 48,680 |
| Seattle-Tacoma-Bellevue, WA | 600 | 0.31 | 0.39 | $ 23.09 | $ 48,030 |
| Minneapolis-St. Paul-Bloomington, MN-WI | 840 | 0.46 | 0.56 | $ 22.23 | $ 46,230 |
| Stockton-Lodi, CA | 80 | 0.30 | 0.36 | $ 21.25 | $ 44,190 |
| San Jose-Sunnyvale-Santa Clara, CA | 170 | 0.16 | 0.20 | $ 20.25 | $ 42,110 |
| San Francisco-Oakland-Hayward, CA | 560 | 0.25 | 0.30 | $ 19.78 | $ 41,140 |
| San Angelo, TX | 70 | 1.60 | 1.96 | $ 19.19 | $ 39,920 |
| New York-Newark-Jersey City, NY-NJ-PA | 1,870 | 0.22 | 0.26 | $ 19.04 | $ 39,610 |
Nonmetropolitan areas with the highest employment in Telemarketers:
| Nonmetropolitan area | Employment (1) | Employment per thousand jobs | Location quotient (9) | Hourly mean wage | Annual mean wage (2) |
|---|---|---|---|---|---|
| Southwest Virginia nonmetropolitan area | 1,190 | 10.47 | 12.81 | $ 14.76 | $ 30,700 |
| Southeast Iowa nonmetropolitan area | 370 | 1.75 | 2.14 | $ 12.22 | $ 25,410 |
| Southeast-Central Idaho nonmetropolitan area | 250 | 2.83 | 3.47 | $ 13.58 | $ 28,240 |
| Southwest Maine nonmetropolitan area | 180 | 0.97 | 1.19 | $ 16.18 | $ 33,660 |
| East Tennessee nonmetropolitan area | 120 | 0.92 | 1.13 | $ 13.26 | $ 27,570 |
Nonmetropolitan areas with the highest concentration of jobs and location quotients in Telemarketers:
| Nonmetropolitan area | Employment (1) | Employment per thousand jobs | Location quotient (9) | Hourly mean wage | Annual mean wage (2) |
|---|---|---|---|---|---|
| Southwest Virginia nonmetropolitan area | 1,190 | 10.47 | 12.81 | $ 14.76 | $ 30,700 |
| Southeast-Central Idaho nonmetropolitan area | 250 | 2.83 | 3.47 | $ 13.58 | $ 28,240 |
| Southeast Iowa nonmetropolitan area | 370 | 1.75 | 2.14 | $ 12.22 | $ 25,410 |
| Southwest Maine nonmetropolitan area | 180 | 0.97 | 1.19 | $ 16.18 | $ 33,660 |
| East Tennessee nonmetropolitan area | 120 | 0.92 | 1.13 | $ 13.26 | $ 27,570 |
Top paying nonmetropolitan areas for Telemarketers:
| Nonmetropolitan area | Employment (1) | Employment per thousand jobs | Location quotient (9) | Hourly mean wage | Annual mean wage (2) |
|---|---|---|---|---|---|
| Southwest Maine nonmetropolitan area | 180 | 0.97 | 1.19 | $ 16.18 | $ 33,660 |
| Southwest Virginia nonmetropolitan area | 1,190 | 10.47 | 12.81 | $ 14.76 | $ 30,700 |
| Capital/Northern New York nonmetropolitan area | 70 | 0.50 | 0.61 | $ 13.91 | $ 28,930 |
| Northern Vermont nonmetropolitan area | 40 | 0.57 | 0.70 | $ 13.81 | $ 28,730 |
| Southeast-Central Idaho nonmetropolitan area | 250 | 2.83 | 3.47 | $ 13.58 | $ 28,240 |
These estimates are calculated with data collected from employers in all industry sectors, all metropolitan and nonmetropolitan areas, and all states and the District of Columbia. The top employment and wage figures are provided above. The complete list is available in the downloadable XLS files.
The percentile wage estimate is the value of a wage below which a certain percent of workers fall. The median wage is the 50th percentile wage estimate—50 percent of workers earn less than the median and 50 percent of workers earn more than the median. More about percentile wages.
(1) Estimates for detailed occupations do not sum to the totals because the totals include occupations not shown separately. Estimates do not include self-employed workers.
(2) Annual wages have been calculated by multiplying the hourly mean wage by a "year-round, full-time" hours figure of 2,080 hours; for those occupations where there is not an hourly wage published, the annual wage has been directly calculated from the reported survey data.
(3) The relative standard error (RSE) is a measure of the reliability of a survey statistic. The smaller the relative standard error, the more precise the estimate.
(8) Estimate not released.
(9) The location quotient is the ratio of the area concentration of occupational employment to the national average concentration. A location quotient greater than one indicates the occupation has a higher share of employment than average, and a location quotient less than one indicates the occupation is less prevalent in the area than average.
Other OEWS estimates and related information:
May 2021 National Occupational Employment and Wage Estimates
May 2021 State Occupational Employment and Wage Estimates
May 2021 Metropolitan and Nonmetropolitan Area Occupational Employment and Wage Estimates
May 2021 National Industry-Specific Occupational Employment and Wage Estimates
Last Modified Date: March 31, 2022