
An official website of the United States government
An official website of the United States government
The .gov means it's official.
Federal government websites often end in .gov or .mil. Before sharing sensitive information,
make sure you're on a federal government site.
The site is secure.
The
https:// ensures that you are connecting to the official website and that any
information you provide is encrypted and transmitted securely.
Interview loan applicants to elicit information; investigate applicants� backgrounds and verify references; prepare loan request papers; and forward findings, reports, and documents to appraisal department. Review loan papers to ensure completeness, and complete transactions between loan establishment, borrowers, and sellers upon approval of loan.
Employment estimate and mean wage estimates for Loan Interviewers and Clerks:
| Employment (1) | Employment RSE (3) |
Mean hourly wage |
Mean annual wage (2) |
Wage RSE (3) |
|---|---|---|---|---|
| 238,610 | 1.2 % | $ 21.59 | $ 44,910 | 0.4 % |
Percentile wage estimates for Loan Interviewers and Clerks:
| Percentile | 10% | 25% | 50% (Median) |
75% | 90% |
|---|---|---|---|---|---|
| Hourly Wage | $ 14.33 | $ 17.79 | $ 22.09 | $ 23.63 | $ 29.27 |
| Annual Wage (2) | $ 29,800 | $ 37,000 | $ 45,940 | $ 49,140 | $ 60,870 |
Industries with the highest published employment and wages for Loan Interviewers and Clerks are provided. For a list of all industries with employment in Loan Interviewers and Clerks, see the Create Customized Tables function.
Industries with the highest levels of employment in Loan Interviewers and Clerks:
| Industry | Employment (1) | Percent of industry employment | Hourly mean wage | Annual mean wage (2) |
|---|---|---|---|---|
| Credit Intermediation and Related Activities (5221 and 5223 only) | 110,690 | 5.53 | $ 21.57 | $ 44,860 |
| Nondepository Credit Intermediation | 85,760 | 13.79 | $ 21.53 | $ 44,770 |
| Management of Companies and Enterprises | 14,600 | 0.57 | $ 22.31 | $ 46,390 |
| Insurance Carriers | 6,510 | 0.54 | $ 22.91 | $ 47,660 |
| Legal Services | 5,680 | 0.50 | $ 20.58 | $ 42,810 |
Industries with the highest concentration of employment in Loan Interviewers and Clerks:
| Industry | Employment (1) | Percent of industry employment | Hourly mean wage | Annual mean wage (2) |
|---|---|---|---|---|
| Nondepository Credit Intermediation | 85,760 | 13.79 | $ 21.53 | $ 44,770 |
| Credit Intermediation and Related Activities (5221 and 5223 only) | 110,690 | 5.53 | $ 21.57 | $ 44,860 |
| Management of Companies and Enterprises | 14,600 | 0.57 | $ 22.31 | $ 46,390 |
| Insurance Carriers | 6,510 | 0.54 | $ 22.91 | $ 47,660 |
| Legal Services | 5,680 | 0.50 | $ 20.58 | $ 42,810 |
Top paying industries for Loan Interviewers and Clerks:
| Industry | Employment (1) | Percent of industry employment | Hourly mean wage | Annual mean wage (2) |
|---|---|---|---|---|
| Other Professional, Scientific, and Technical Services | (8) | (8) | $ 25.05 | $ 52,110 |
| Securities, Commodity Contracts, and Other Financial Investments and Related Activities | 2,040 | 0.21 | $ 24.98 | $ 51,960 |
| Junior Colleges | 270 | 0.04 | $ 24.68 | $ 51,340 |
| Residential Building Construction | 310 | 0.04 | $ 24.34 | $ 50,630 |
| State Government, excluding schools and hospitals (OEWS Designation) | 50 | (7) | $ 23.50 | $ 48,870 |
States and areas with the highest published employment, location quotients, and wages for Loan Interviewers and Clerks are provided. For a list of all areas with employment in Loan Interviewers and Clerks, see the Create Customized Tables function.
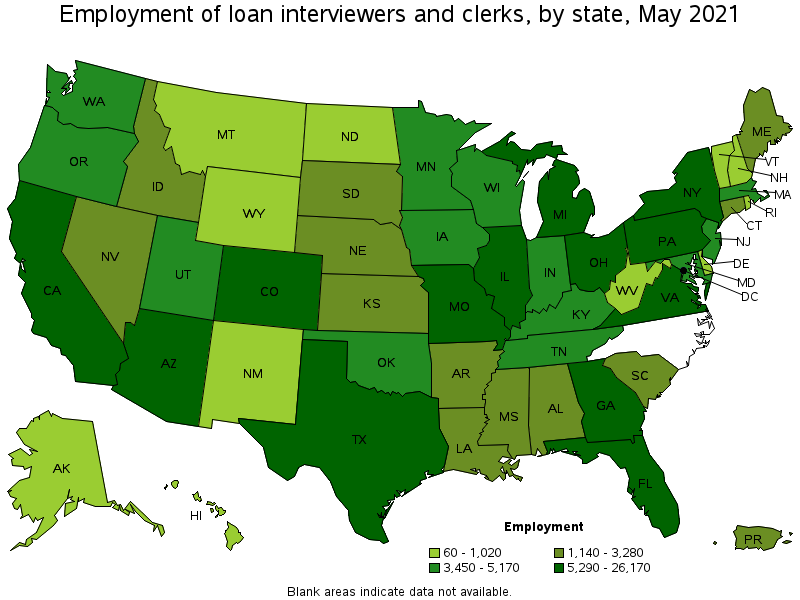
States with the highest employment level in Loan Interviewers and Clerks:
| State | Employment (1) | Employment per thousand jobs | Location quotient (9) | Hourly mean wage | Annual mean wage (2) |
|---|---|---|---|---|---|
| Texas | 26,170 | 2.14 | 1.26 | $ 21.31 | $ 44,320 |
| California | 21,710 | 1.31 | 0.78 | $ 24.05 | $ 50,010 |
| Florida | 12,780 | 1.49 | 0.88 | $ 21.32 | $ 44,340 |
| Arizona | 10,990 | 3.81 | 2.25 | $ 22.48 | $ 46,750 |
| Illinois | 10,790 | 1.92 | 1.13 | $ 21.72 | $ 45,170 |
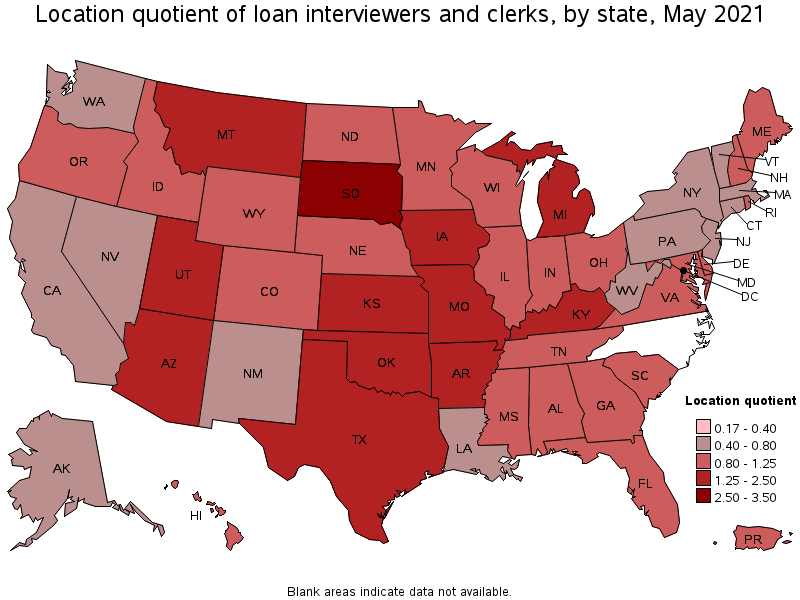
States with the highest concentration of jobs and location quotients in Loan Interviewers and Clerks:
| State | Employment (1) | Employment per thousand jobs | Location quotient (9) | Hourly mean wage | Annual mean wage (2) |
|---|---|---|---|---|---|
| South Dakota | 1,890 | 4.48 | 2.64 | $ 19.21 | $ 39,960 |
| Arizona | 10,990 | 3.81 | 2.25 | $ 22.48 | $ 46,750 |
| Missouri | 9,370 | 3.43 | 2.03 | $ 19.77 | $ 41,130 |
| Kansas | 3,280 | 2.45 | 1.45 | $ 21.74 | $ 45,220 |
| Iowa | 3,500 | 2.36 | 1.39 | $ 21.26 | $ 44,210 |
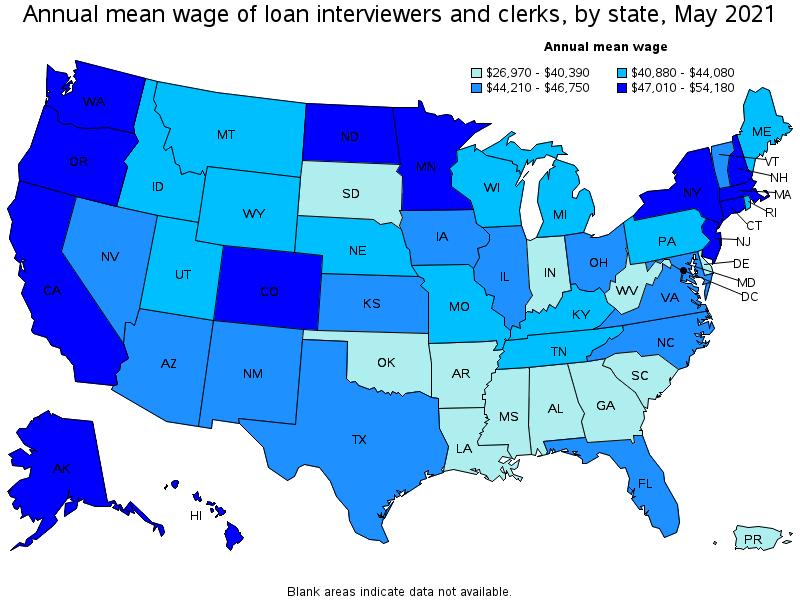
Top paying states for Loan Interviewers and Clerks:
| State | Employment (1) | Employment per thousand jobs | Location quotient (9) | Hourly mean wage | Annual mean wage (2) |
|---|---|---|---|---|---|
| District of Columbia | 190 | 0.29 | 0.17 | $ 26.05 | $ 54,180 |
| New York | 6,180 | 0.71 | 0.42 | $ 25.54 | $ 53,110 |
| Massachusetts | 3,940 | 1.16 | 0.69 | $ 24.89 | $ 51,760 |
| Washington | 4,070 | 1.27 | 0.75 | $ 24.66 | $ 51,290 |
| California | 21,710 | 1.31 | 0.78 | $ 24.05 | $ 50,010 |
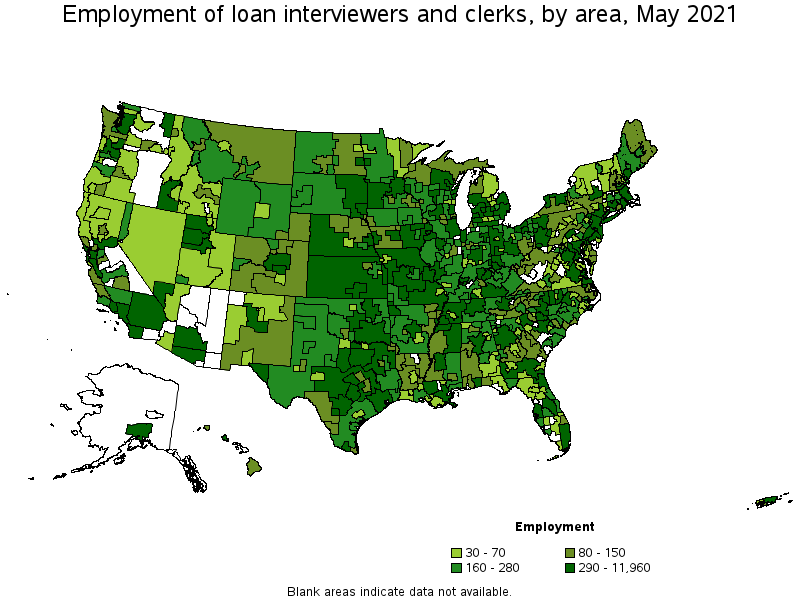
Metropolitan areas with the highest employment level in Loan Interviewers and Clerks:
| Metropolitan area | Employment (1) | Employment per thousand jobs | Location quotient (9) | Hourly mean wage | Annual mean wage (2) |
|---|---|---|---|---|---|
| Dallas-Fort Worth-Arlington, TX | 11,960 | 3.33 | 1.97 | $ 21.72 | $ 45,170 |
| Phoenix-Mesa-Scottsdale, AZ | 9,990 | 4.72 | 2.79 | $ 22.66 | $ 47,130 |
| Los Angeles-Long Beach-Anaheim, CA | 9,420 | 1.65 | 0.97 | $ 23.44 | $ 48,750 |
| Chicago-Naperville-Elgin, IL-IN-WI | 8,540 | 2.02 | 1.19 | $ 22.31 | $ 46,410 |
| New York-Newark-Jersey City, NY-NJ-PA | 6,440 | 0.74 | 0.44 | $ 26.59 | $ 55,310 |
| Atlanta-Sandy Springs-Roswell, GA | 5,720 | 2.21 | 1.30 | $ 18.96 | $ 39,440 |
| Detroit-Warren-Dearborn, MI | 5,380 | 2.99 | 1.76 | $ 21.93 | $ 45,610 |
| Washington-Arlington-Alexandria, DC-VA-MD-WV | 5,180 | 1.76 | 1.04 | $ 23.93 | $ 49,760 |
| Philadelphia-Camden-Wilmington, PA-NJ-DE-MD | 4,390 | 1.66 | 0.98 | $ 22.41 | $ 46,620 |
| Houston-The Woodlands-Sugar Land, TX | 3,700 | 1.28 | 0.75 | $ 22.11 | $ 45,990 |
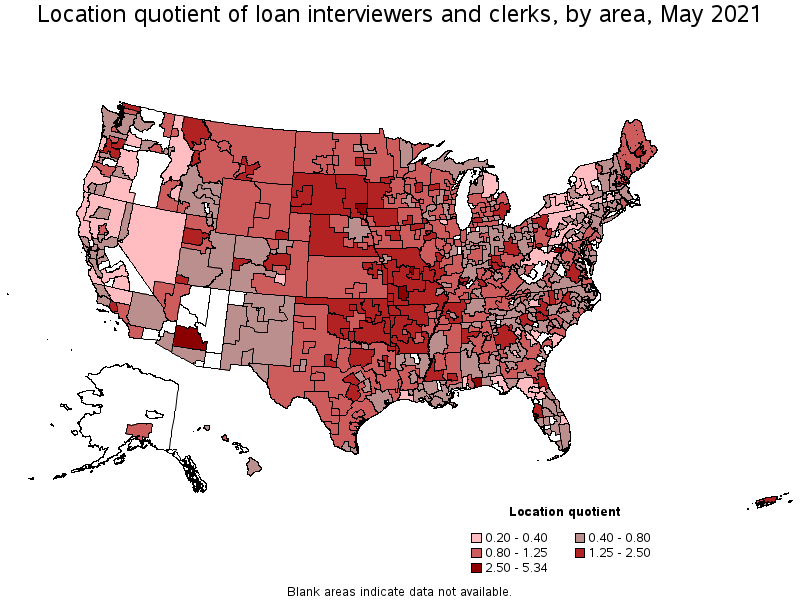
Metropolitan areas with the highest concentration of jobs and location quotients in Loan Interviewers and Clerks:
| Metropolitan area | Employment (1) | Employment per thousand jobs | Location quotient (9) | Hourly mean wage | Annual mean wage (2) |
|---|---|---|---|---|---|
| Columbia, MO | 840 | 9.04 | 5.34 | $ 22.36 | $ 46,500 |
| Springfield, MO | 1,180 | 5.71 | 3.37 | $ 16.81 | $ 34,960 |
| Sioux Falls, SD | 870 | 5.61 | 3.31 | $ 19.33 | $ 40,200 |
| Pensacola-Ferry Pass-Brent, FL | 900 | 5.13 | 3.03 | $ 20.40 | $ 42,440 |
| Lewiston-Auburn, ME | 230 | 4.80 | 2.84 | $ 20.23 | $ 42,080 |
| Phoenix-Mesa-Scottsdale, AZ | 9,990 | 4.72 | 2.79 | $ 22.66 | $ 47,130 |
| Winchester, VA-WV | 270 | 4.42 | 2.61 | $ 20.76 | $ 43,180 |
| Rapid City, SD | 250 | 3.70 | 2.19 | $ 19.00 | $ 39,530 |
| Kansas City, MO-KS | 3,570 | 3.52 | 2.08 | $ 22.37 | $ 46,520 |
| Wausau, WI | 240 | 3.47 | 2.05 | $ 17.75 | $ 36,920 |
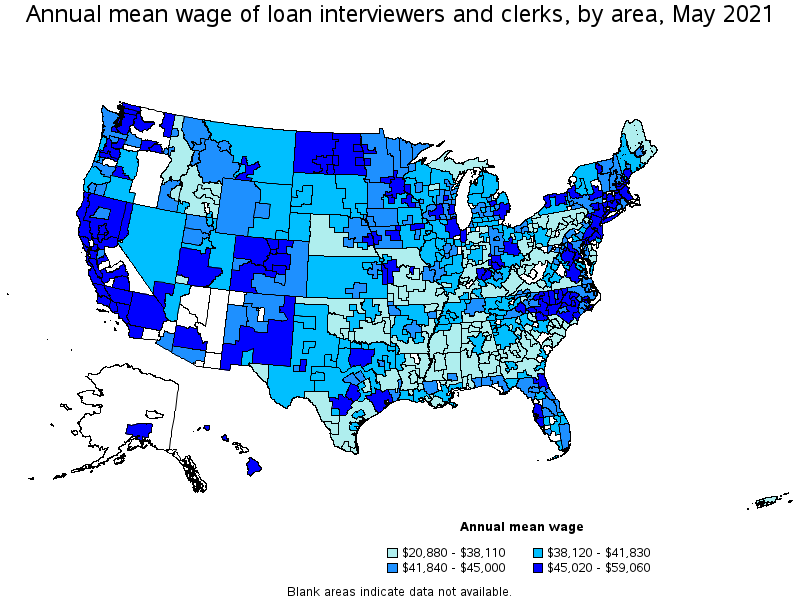
Top paying metropolitan areas for Loan Interviewers and Clerks:
| Metropolitan area | Employment (1) | Employment per thousand jobs | Location quotient (9) | Hourly mean wage | Annual mean wage (2) |
|---|---|---|---|---|---|
| Salinas, CA | 110 | 0.62 | 0.37 | $ 28.39 | $ 59,060 |
| San Francisco-Oakland-Hayward, CA | 2,440 | 1.09 | 0.64 | $ 27.95 | $ 58,140 |
| San Jose-Sunnyvale-Santa Clara, CA | 790 | 0.74 | 0.43 | $ 27.26 | $ 56,710 |
| New York-Newark-Jersey City, NY-NJ-PA | 6,440 | 0.74 | 0.44 | $ 26.59 | $ 55,310 |
| Danbury, CT | 80 | 1.07 | 0.63 | $ 25.95 | $ 53,980 |
| Seattle-Tacoma-Bellevue, WA | 2,280 | 1.19 | 0.70 | $ 25.86 | $ 53,800 |
| Mount Vernon-Anacortes, WA | 70 | 1.54 | 0.91 | $ 25.43 | $ 52,900 |
| Santa Rosa, CA | 150 | 0.80 | 0.47 | $ 25.42 | $ 52,880 |
| Boulder, CO | 140 | 0.78 | 0.46 | $ 25.41 | $ 52,850 |
| Boston-Cambridge-Nashua, MA-NH | 3,340 | 1.29 | 0.76 | $ 25.24 | $ 52,490 |
Nonmetropolitan areas with the highest employment in Loan Interviewers and Clerks:
| Nonmetropolitan area | Employment (1) | Employment per thousand jobs | Location quotient (9) | Hourly mean wage | Annual mean wage (2) |
|---|---|---|---|---|---|
| Kansas nonmetropolitan area | 610 | 1.62 | 0.96 | $ 19.51 | $ 40,580 |
| Southeast Missouri nonmetropolitan area | 490 | 3.10 | 1.83 | $ 17.25 | $ 35,880 |
| East South Dakota nonmetropolitan area | 490 | 3.85 | 2.27 | $ 19.26 | $ 40,050 |
| North Texas Region of Texas nonmetropolitan area | 400 | 1.50 | 0.88 | $ 19.37 | $ 40,290 |
| Northeastern Wisconsin nonmetropolitan area | 390 | 2.05 | 1.21 | $ 19.69 | $ 40,950 |
Nonmetropolitan areas with the highest concentration of jobs and location quotients in Loan Interviewers and Clerks:
| Nonmetropolitan area | Employment (1) | Employment per thousand jobs | Location quotient (9) | Hourly mean wage | Annual mean wage (2) |
|---|---|---|---|---|---|
| East South Dakota nonmetropolitan area | 490 | 3.85 | 2.27 | $ 19.26 | $ 40,050 |
| West South Dakota nonmetropolitan area | 220 | 3.75 | 2.22 | $ 18.86 | $ 39,220 |
| Southwest Missouri nonmetropolitan area | 260 | 3.67 | 2.17 | $ 16.73 | $ 34,800 |
| Southwest Oklahoma nonmetropolitan area | 190 | 3.32 | 1.96 | $ 18.01 | $ 37,450 |
| North Missouri nonmetropolitan area | 330 | 3.17 | 1.87 | $ 17.06 | $ 35,470 |
Top paying nonmetropolitan areas for Loan Interviewers and Clerks:
| Nonmetropolitan area | Employment (1) | Employment per thousand jobs | Location quotient (9) | Hourly mean wage | Annual mean wage (2) |
|---|---|---|---|---|---|
| Northwest Colorado nonmetropolitan area | 120 | 1.00 | 0.59 | $ 25.58 | $ 53,200 |
| West North Dakota nonmetropolitan area | 160 | 1.50 | 0.89 | $ 23.39 | $ 48,650 |
| North Valley-Northern Mountains Region of California nonmetropolitan area | 50 | 0.48 | 0.28 | $ 23.00 | $ 47,850 |
| Central Utah nonmetropolitan area | 40 | 0.72 | 0.43 | $ 22.71 | $ 47,240 |
| North Coast Region of California nonmetropolitan area | 60 | 0.62 | 0.37 | $ 22.67 | $ 47,150 |
These estimates are calculated with data collected from employers in all industry sectors, all metropolitan and nonmetropolitan areas, and all states and the District of Columbia. The top employment and wage figures are provided above. The complete list is available in the downloadable XLS files.
The percentile wage estimate is the value of a wage below which a certain percent of workers fall. The median wage is the 50th percentile wage estimate—50 percent of workers earn less than the median and 50 percent of workers earn more than the median. More about percentile wages.
(1) Estimates for detailed occupations do not sum to the totals because the totals include occupations not shown separately. Estimates do not include self-employed workers.
(2) Annual wages have been calculated by multiplying the hourly mean wage by a "year-round, full-time" hours figure of 2,080 hours; for those occupations where there is not an hourly wage published, the annual wage has been directly calculated from the reported survey data.
(3) The relative standard error (RSE) is a measure of the reliability of a survey statistic. The smaller the relative standard error, the more precise the estimate.
(7) The value is less than .005 percent of industry employment.
(8) Estimate not released.
(9) The location quotient is the ratio of the area concentration of occupational employment to the national average concentration. A location quotient greater than one indicates the occupation has a higher share of employment than average, and a location quotient less than one indicates the occupation is less prevalent in the area than average.
Other OEWS estimates and related information:
May 2021 National Occupational Employment and Wage Estimates
May 2021 State Occupational Employment and Wage Estimates
May 2021 Metropolitan and Nonmetropolitan Area Occupational Employment and Wage Estimates
May 2021 National Industry-Specific Occupational Employment and Wage Estimates
Last Modified Date: March 31, 2022