
An official website of the United States government
An official website of the United States government
The .gov means it's official.
Federal government websites often end in .gov or .mil. Before sharing sensitive information,
make sure you're on a federal government site.
The site is secure.
The
https:// ensures that you are connecting to the official website and that any
information you provide is encrypted and transmitted securely.
Receive and process incoming orders for materials, merchandise, classified ads, or services such as repairs, installations, or rental of facilities. Generally receives orders via mail, phone, fax, or other electronic means. Duties include informing customers of receipt, prices, shipping dates, and delays; preparing contracts; and handling complaints. Excludes �Dispatchers, Except Police, Fire, and Ambulance� (43-5032) who both dispatch and take orders for services.
Employment estimate and mean wage estimates for Order Clerks:
| Employment (1) | Employment RSE (3) |
Mean hourly wage |
Mean annual wage (2) |
Wage RSE (3) |
|---|---|---|---|---|
| 133,850 | 2.4 % | $ 20.11 | $ 41,820 | 0.7 % |
Percentile wage estimates for Order Clerks:
| Percentile | 10% | 25% | 50% (Median) |
75% | 90% |
|---|---|---|---|---|---|
| Hourly Wage | $ 13.81 | $ 14.44 | $ 18.23 | $ 22.94 | $ 28.66 |
| Annual Wage (2) | $ 28,730 | $ 30,040 | $ 37,920 | $ 47,700 | $ 59,620 |
Industries with the highest published employment and wages for Order Clerks are provided. For a list of all industries with employment in Order Clerks, see the Create Customized Tables function.
Industries with the highest levels of employment in Order Clerks:
| Industry | Employment (1) | Percent of industry employment | Hourly mean wage | Annual mean wage (2) |
|---|---|---|---|---|
| Electronic Shopping and Mail-Order Houses | 35,220 | 7.63 | $ 23.46 | $ 48,800 |
| Warehousing and Storage | 13,030 | 0.79 | $ 18.03 | $ 37,500 |
| Merchant Wholesalers, Durable Goods (4232, 4233, 4235, 4236, 4237, and 4239 only) | 10,800 | 0.79 | $ 20.20 | $ 42,010 |
| Professional and Commercial Equipment and Supplies Merchant Wholesalers | 3,980 | 0.60 | $ 19.90 | $ 41,380 |
| Merchant Wholesalers, Nondurable Goods (4244 and 4248 only) | 3,670 | 0.40 | $ 19.76 | $ 41,100 |
Industries with the highest concentration of employment in Order Clerks:
| Industry | Employment (1) | Percent of industry employment | Hourly mean wage | Annual mean wage (2) |
|---|---|---|---|---|
| Electronic Shopping and Mail-Order Houses | 35,220 | 7.63 | $ 23.46 | $ 48,800 |
| Apparel, Piece Goods, and Notions Merchant Wholesalers | 2,490 | 1.93 | $ 17.87 | $ 37,170 |
| Nonscheduled Air Transportation | 500 | 1.03 | $ 14.54 | $ 30,250 |
| Merchant Wholesalers, Durable Goods (4232, 4233, 4235, 4236, 4237, and 4239 only) | 10,800 | 0.79 | $ 20.20 | $ 42,010 |
| Warehousing and Storage | 13,030 | 0.79 | $ 18.03 | $ 37,500 |
Top paying industries for Order Clerks:
| Industry | Employment (1) | Percent of industry employment | Hourly mean wage | Annual mean wage (2) |
|---|---|---|---|---|
| Electric Power Generation, Transmission and Distribution | 230 | 0.06 | $ 29.88 | $ 62,140 |
| Natural Gas Distribution | (8) | (8) | $ 29.35 | $ 61,040 |
| Scientific Research and Development Services | 190 | 0.02 | $ 28.38 | $ 59,020 |
| Farm Product Raw Material Merchant Wholesalers | 110 | 0.16 | $ 26.90 | $ 55,950 |
| Navigational, Measuring, Electromedical, and Control Instruments Manufacturing | 890 | 0.22 | $ 26.00 | $ 54,080 |
States and areas with the highest published employment, location quotients, and wages for Order Clerks are provided. For a list of all areas with employment in Order Clerks, see the Create Customized Tables function.
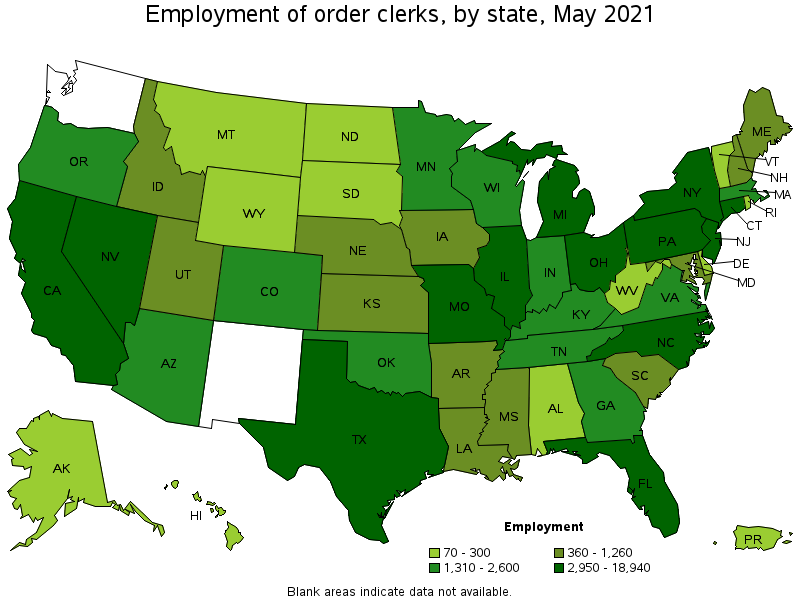
States with the highest employment level in Order Clerks:
| State | Employment (1) | Employment per thousand jobs | Location quotient (9) | Hourly mean wage | Annual mean wage (2) |
|---|---|---|---|---|---|
| California | 18,940 | 1.15 | 1.21 | $ 20.54 | $ 42,730 |
| Florida | 8,640 | 1.00 | 1.06 | $ 16.84 | $ 35,020 |
| New Jersey | 7,720 | 2.01 | 2.11 | $ 18.27 | $ 38,000 |
| Texas | 6,790 | 0.56 | 0.58 | $ 17.57 | $ 36,540 |
| Connecticut | 4,920 | 3.13 | 3.29 | $ 18.81 | $ 39,110 |
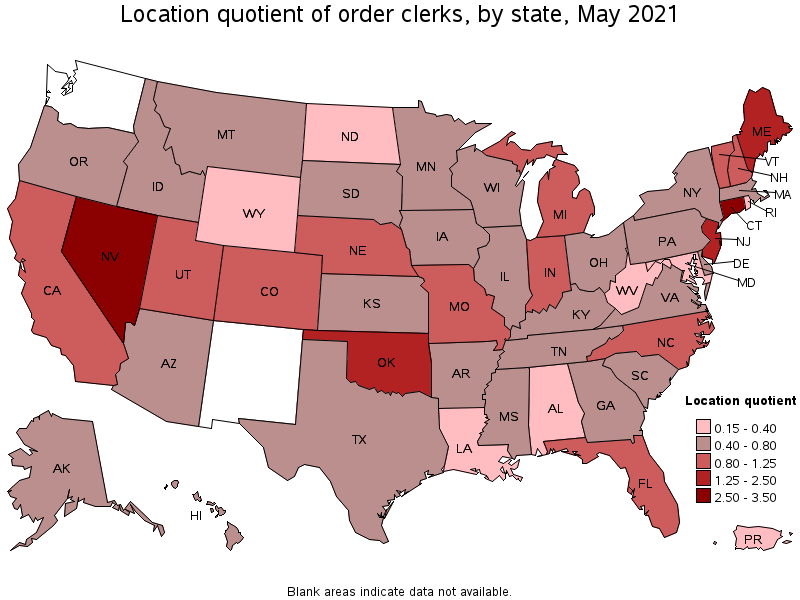
States with the highest concentration of jobs and location quotients in Order Clerks:
| State | Employment (1) | Employment per thousand jobs | Location quotient (9) | Hourly mean wage | Annual mean wage (2) |
|---|---|---|---|---|---|
| Connecticut | 4,920 | 3.13 | 3.29 | $ 18.81 | $ 39,110 |
| Nevada | 3,460 | 2.69 | 2.83 | $ 15.79 | $ 32,850 |
| New Jersey | 7,720 | 2.01 | 2.11 | $ 18.27 | $ 38,000 |
| Maine | 1,130 | 1.91 | 2.01 | $ 17.51 | $ 36,410 |
| Oklahoma | 2,420 | 1.55 | 1.64 | $ 16.18 | $ 33,660 |
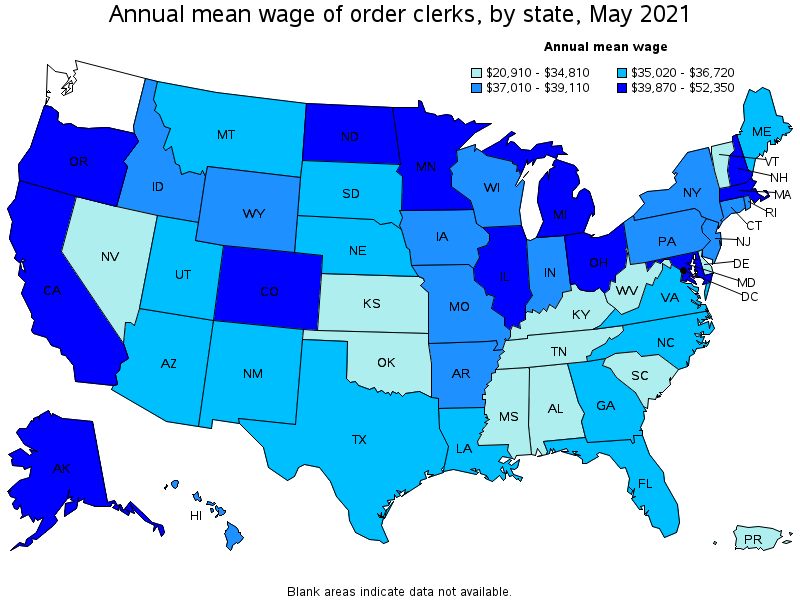
Top paying states for Order Clerks:
| State | Employment (1) | Employment per thousand jobs | Location quotient (9) | Hourly mean wage | Annual mean wage (2) |
|---|---|---|---|---|---|
| District of Columbia | (8) | (8) | (8) | $ 25.17 | $ 52,350 |
| Massachusetts | 1,350 | 0.40 | 0.42 | $ 23.03 | $ 47,910 |
| Colorado | 2,010 | 0.77 | 0.81 | $ 21.52 | $ 44,760 |
| Maryland | 860 | 0.34 | 0.36 | $ 21.25 | $ 44,200 |
| North Dakota | 100 | 0.24 | 0.26 | $ 21.13 | $ 43,940 |
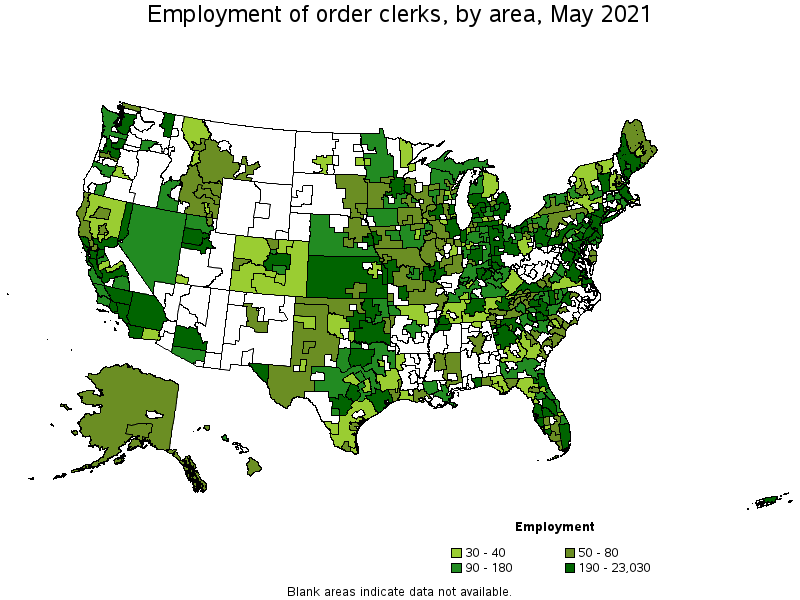
Metropolitan areas with the highest employment level in Order Clerks:
| Metropolitan area | Employment (1) | Employment per thousand jobs | Location quotient (9) | Hourly mean wage | Annual mean wage (2) |
|---|---|---|---|---|---|
| Seattle-Tacoma-Bellevue, WA | 23,030 | 12.01 | 12.64 | (8) | (8) |
| New York-Newark-Jersey City, NY-NJ-PA | 8,910 | 1.03 | 1.08 | $ 18.37 | $ 38,210 |
| Los Angeles-Long Beach-Anaheim, CA | 8,130 | 1.42 | 1.50 | $ 19.87 | $ 41,320 |
| Chicago-Naperville-Elgin, IL-IN-WI | 3,240 | 0.77 | 0.81 | $ 19.56 | $ 40,690 |
| Miami-Fort Lauderdale-West Palm Beach, FL | 3,090 | 1.26 | 1.33 | $ 15.96 | $ 33,200 |
| San Francisco-Oakland-Hayward, CA | 2,350 | 1.05 | 1.10 | $ 23.20 | $ 48,260 |
| Dallas-Fort Worth-Arlington, TX | 2,270 | 0.63 | 0.67 | $ 18.59 | $ 38,660 |
| Philadelphia-Camden-Wilmington, PA-NJ-DE-MD | 2,060 | 0.78 | 0.82 | $ 18.91 | $ 39,340 |
| Detroit-Warren-Dearborn, MI | 1,960 | 1.09 | 1.15 | $ 19.53 | $ 40,610 |
| Riverside-San Bernardino-Ontario, CA | 1,760 | 1.15 | 1.21 | $ 19.24 | $ 40,030 |
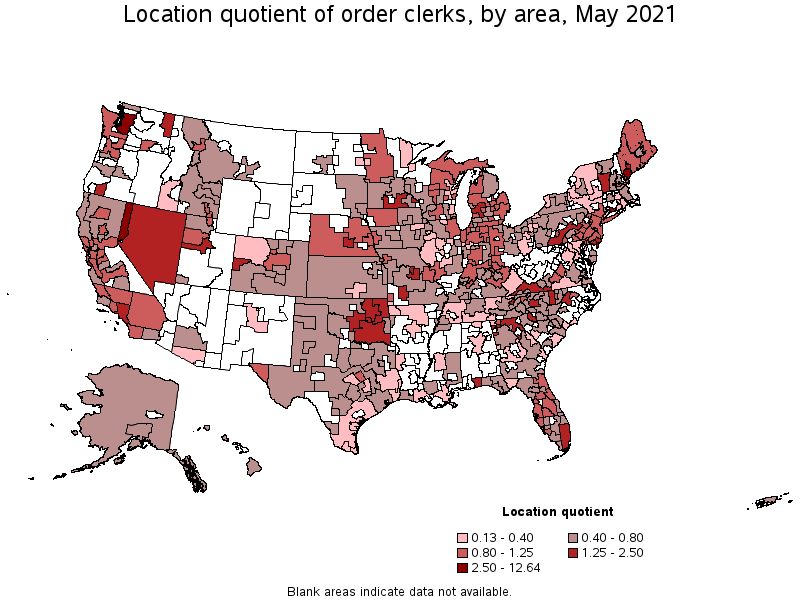
Metropolitan areas with the highest concentration of jobs and location quotients in Order Clerks:
| Metropolitan area | Employment (1) | Employment per thousand jobs | Location quotient (9) | Hourly mean wage | Annual mean wage (2) |
|---|---|---|---|---|---|
| Seattle-Tacoma-Bellevue, WA | 23,030 | 12.01 | 12.64 | (8) | (8) |
| Reno, NV | 850 | 3.62 | 3.81 | $ 16.30 | $ 33,910 |
| Portland-South Portland, ME | 700 | 3.54 | 3.73 | $ 17.68 | $ 36,770 |
| New Haven, CT | 930 | 3.39 | 3.57 | $ 19.30 | $ 40,140 |
| Ocean City, NJ | 110 | 2.69 | 2.83 | (8) | (8) |
| Jefferson City, MO | 160 | 2.24 | 2.36 | $ 15.52 | $ 32,280 |
| Hickory-Lenoir-Morganton, NC | 320 | 2.19 | 2.31 | $ 17.35 | $ 36,080 |
| Medford, OR | 170 | 2.02 | 2.13 | $ 14.93 | $ 31,060 |
| Vineland-Bridgeton, NJ | 120 | 2.01 | 2.11 | $ 19.26 | $ 40,060 |
| Springfield, MO | 390 | 1.87 | 1.97 | $ 17.02 | $ 35,410 |
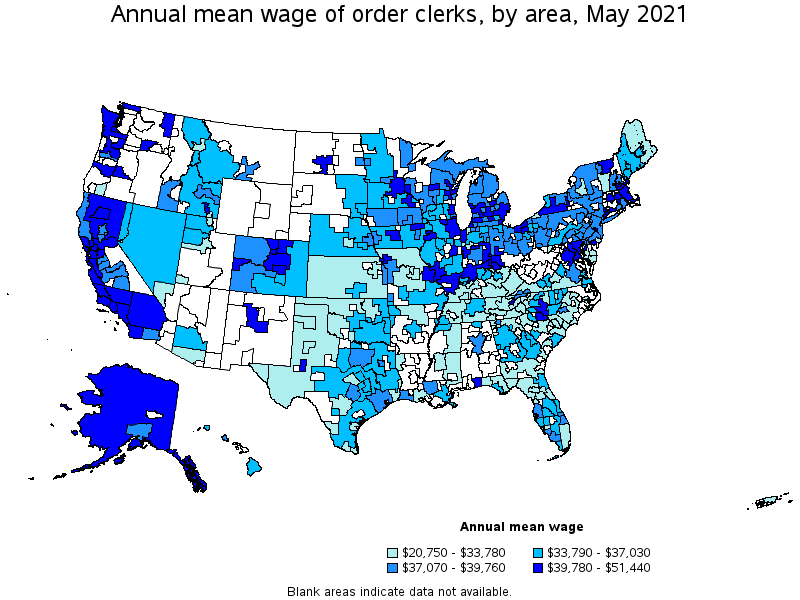
Top paying metropolitan areas for Order Clerks:
| Metropolitan area | Employment (1) | Employment per thousand jobs | Location quotient (9) | Hourly mean wage | Annual mean wage (2) |
|---|---|---|---|---|---|
| Bismarck, ND | 30 | 0.49 | 0.52 | $ 24.73 | $ 51,440 |
| Trenton, NJ | 250 | 1.11 | 1.16 | $ 24.54 | $ 51,040 |
| Bridgeport-Stamford-Norwalk, CT | 110 | 0.29 | 0.31 | $ 24.43 | $ 50,810 |
| San Jose-Sunnyvale-Santa Clara, CA | 980 | 0.92 | 0.97 | $ 24.27 | $ 50,480 |
| Boston-Cambridge-Nashua, MA-NH | 1,120 | 0.43 | 0.46 | $ 23.63 | $ 49,150 |
| San Francisco-Oakland-Hayward, CA | 2,350 | 1.05 | 1.10 | $ 23.20 | $ 48,260 |
| Pensacola-Ferry Pass-Brent, FL | 290 | 1.67 | 1.75 | $ 23.05 | $ 47,940 |
| Denver-Aurora-Lakewood, CO | 1,340 | 0.91 | 0.96 | $ 22.34 | $ 46,460 |
| Portsmouth, NH-ME | 100 | 1.13 | 1.19 | $ 22.14 | $ 46,040 |
| Danbury, CT | 50 | 0.63 | 0.66 | $ 22.11 | $ 45,980 |
Nonmetropolitan areas with the highest employment in Order Clerks:
| Nonmetropolitan area | Employment (1) | Employment per thousand jobs | Location quotient (9) | Hourly mean wage | Annual mean wage (2) |
|---|---|---|---|---|---|
| Southeast Oklahoma nonmetropolitan area | 260 | 1.58 | 1.67 | $ 16.76 | $ 34,860 |
| Southern Pennsylvania nonmetropolitan area | 250 | 1.38 | 1.46 | $ 17.01 | $ 35,370 |
| West Northwestern Ohio nonmetropolitan area | 240 | 1.01 | 1.07 | $ 18.42 | $ 38,310 |
| Balance of Lower Peninsula of Michigan nonmetropolitan area | 240 | 0.95 | 1.00 | $ 18.23 | $ 37,930 |
| North Georgia nonmetropolitan area | 210 | 1.26 | 1.33 | $ 15.28 | $ 31,770 |
Nonmetropolitan areas with the highest concentration of jobs and location quotients in Order Clerks:
| Nonmetropolitan area | Employment (1) | Employment per thousand jobs | Location quotient (9) | Hourly mean wage | Annual mean wage (2) |
|---|---|---|---|---|---|
| Southern Vermont nonmetropolitan area | 200 | 2.06 | 2.17 | $ 15.21 | $ 31,640 |
| Nevada nonmetropolitan area | 180 | 1.89 | 1.99 | $ 16.49 | $ 34,290 |
| Southwest Virginia nonmetropolitan area | 190 | 1.65 | 1.74 | $ 15.26 | $ 31,730 |
| Southeast Oklahoma nonmetropolitan area | 260 | 1.58 | 1.67 | $ 16.76 | $ 34,860 |
| Southern Pennsylvania nonmetropolitan area | 250 | 1.38 | 1.46 | $ 17.01 | $ 35,370 |
Top paying nonmetropolitan areas for Order Clerks:
| Nonmetropolitan area | Employment (1) | Employment per thousand jobs | Location quotient (9) | Hourly mean wage | Annual mean wage (2) |
|---|---|---|---|---|---|
| Alaska nonmetropolitan area | 50 | 0.53 | 0.56 | $ 22.55 | $ 46,900 |
| Southern Indiana nonmetropolitan area | 170 | 0.92 | 0.97 | $ 21.56 | $ 44,850 |
| South Illinois nonmetropolitan area | (8) | (8) | (8) | $ 21.46 | $ 44,630 |
| Northern Vermont nonmetropolitan area | 30 | 0.53 | 0.56 | $ 21.37 | $ 44,450 |
| Central Indiana nonmetropolitan area | 110 | 0.75 | 0.79 | $ 21.26 | $ 44,220 |
These estimates are calculated with data collected from employers in all industry sectors, all metropolitan and nonmetropolitan areas, and all states and the District of Columbia. The top employment and wage figures are provided above. The complete list is available in the downloadable XLS files.
The percentile wage estimate is the value of a wage below which a certain percent of workers fall. The median wage is the 50th percentile wage estimate—50 percent of workers earn less than the median and 50 percent of workers earn more than the median. More about percentile wages.
(1) Estimates for detailed occupations do not sum to the totals because the totals include occupations not shown separately. Estimates do not include self-employed workers.
(2) Annual wages have been calculated by multiplying the hourly mean wage by a "year-round, full-time" hours figure of 2,080 hours; for those occupations where there is not an hourly wage published, the annual wage has been directly calculated from the reported survey data.
(3) The relative standard error (RSE) is a measure of the reliability of a survey statistic. The smaller the relative standard error, the more precise the estimate.
(8) Estimate not released.
(9) The location quotient is the ratio of the area concentration of occupational employment to the national average concentration. A location quotient greater than one indicates the occupation has a higher share of employment than average, and a location quotient less than one indicates the occupation is less prevalent in the area than average.
Other OEWS estimates and related information:
May 2021 National Occupational Employment and Wage Estimates
May 2021 State Occupational Employment and Wage Estimates
May 2021 Metropolitan and Nonmetropolitan Area Occupational Employment and Wage Estimates
May 2021 National Industry-Specific Occupational Employment and Wage Estimates
Last Modified Date: March 31, 2022