
An official website of the United States government
An official website of the United States government
The .gov means it's official.
Federal government websites often end in .gov or .mil. Before sharing sensitive information,
make sure you're on a federal government site.
The site is secure.
The
https:// ensures that you are connecting to the official website and that any
information you provide is encrypted and transmitted securely.
Operate telephone, radio, or other communication systems to receive and communicate requests for emergency assistance at 9-1-1 public safety answering points and emergency operations centers. Take information from the public and other sources regarding crimes, threats, disturbances, acts of terrorism, fires, medical emergencies, and other public safety matters. May coordinate and provide information to law enforcement and emergency response personnel. May access sensitive databases and other information sources as needed. May provide additional instructions to callers based on knowledge of and certification in law enforcement, fire, or emergency medical procedures.
Employment estimate and mean wage estimates for Public Safety Telecommunicators:
| Employment (1) | Employment RSE (3) |
Mean hourly wage |
Mean annual wage (2) |
Wage RSE (3) |
|---|---|---|---|---|
| 97,050 | 1.2 % | $ 22.61 | $ 47,030 | 0.4 % |
Percentile wage estimates for Public Safety Telecommunicators:
| Percentile | 10% | 25% | 50% (Median) |
75% | 90% |
|---|---|---|---|---|---|
| Hourly Wage | $ 14.10 | $ 17.74 | $ 22.44 | $ 28.54 | $ 30.74 |
| Annual Wage (2) | $ 29,340 | $ 36,890 | $ 46,670 | $ 59,360 | $ 63,940 |
Industries with the highest published employment and wages for Public Safety Telecommunicators are provided. For a list of all industries with employment in Public Safety Telecommunicators, see the Create Customized Tables function.
Industries with the highest levels of employment in Public Safety Telecommunicators:
| Industry | Employment (1) | Percent of industry employment | Hourly mean wage | Annual mean wage (2) |
|---|---|---|---|---|
| Local Government, excluding schools and hospitals (OEWS Designation) | 79,350 | 1.48 | $ 22.96 | $ 47,750 |
| State Government, excluding schools and hospitals (OEWS Designation) | 5,350 | 0.24 | $ 24.94 | $ 51,870 |
| Other Ambulatory Health Care Services | 4,960 | 1.59 | $ 18.42 | $ 38,310 |
| General Medical and Surgical Hospitals | 2,630 | 0.05 | $ 19.98 | $ 41,560 |
| Colleges, Universities, and Professional Schools | 2,180 | 0.07 | $ 20.54 | $ 42,720 |
Industries with the highest concentration of employment in Public Safety Telecommunicators:
| Industry | Employment (1) | Percent of industry employment | Hourly mean wage | Annual mean wage (2) |
|---|---|---|---|---|
| Other Ambulatory Health Care Services | 4,960 | 1.59 | $ 18.42 | $ 38,310 |
| Local Government, excluding schools and hospitals (OEWS Designation) | 79,350 | 1.48 | $ 22.96 | $ 47,750 |
| State Government, excluding schools and hospitals (OEWS Designation) | 5,350 | 0.24 | $ 24.94 | $ 51,870 |
| Business Support Services | 580 | 0.07 | $ 19.07 | $ 39,660 |
| Junior Colleges | 430 | 0.07 | $ 19.21 | $ 39,960 |
Top paying industries for Public Safety Telecommunicators:
| Industry | Employment (1) | Percent of industry employment | Hourly mean wage | Annual mean wage (2) |
|---|---|---|---|---|
| State Government, excluding schools and hospitals (OEWS Designation) | 5,350 | 0.24 | $ 24.94 | $ 51,870 |
| Other Support Services | 160 | 0.06 | $ 24.34 | $ 50,640 |
| Local Government, excluding schools and hospitals (OEWS Designation) | 79,350 | 1.48 | $ 22.96 | $ 47,750 |
| Outpatient Care Centers | (8) | (8) | $ 21.82 | $ 45,380 |
| Management of Companies and Enterprises | 60 | (7) | $ 21.31 | $ 44,320 |
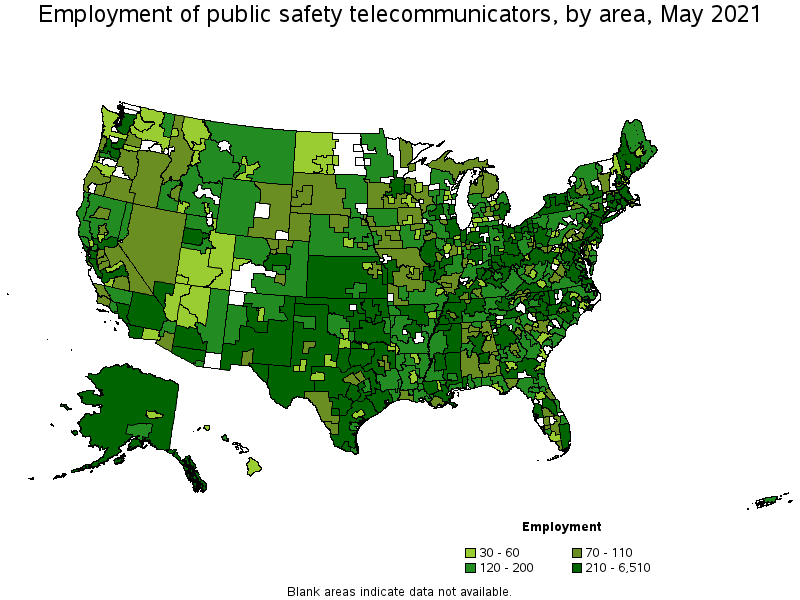
States and areas with the highest published employment, location quotients, and wages for Public Safety Telecommunicators are provided. For a list of all areas with employment in Public Safety Telecommunicators, see the Create Customized Tables function.
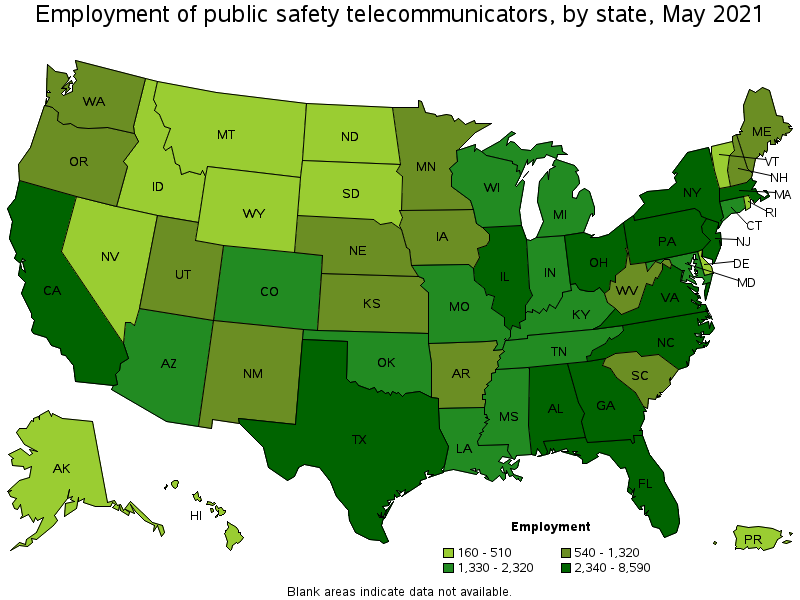
States with the highest employment level in Public Safety Telecommunicators:
| State | Employment (1) | Employment per thousand jobs | Location quotient (9) | Hourly mean wage | Annual mean wage (2) |
|---|---|---|---|---|---|
| Texas | 8,590 | 0.70 | 1.02 | $ 19.50 | $ 40,570 |
| California | 7,780 | 0.47 | 0.68 | $ 34.05 | $ 70,820 |
| New York | 5,820 | 0.67 | 0.97 | $ 26.43 | $ 54,970 |
| Florida | 5,000 | 0.58 | 0.84 | $ 21.84 | $ 45,430 |
| Ohio | 4,760 | 0.91 | 1.33 | $ 22.90 | $ 47,620 |
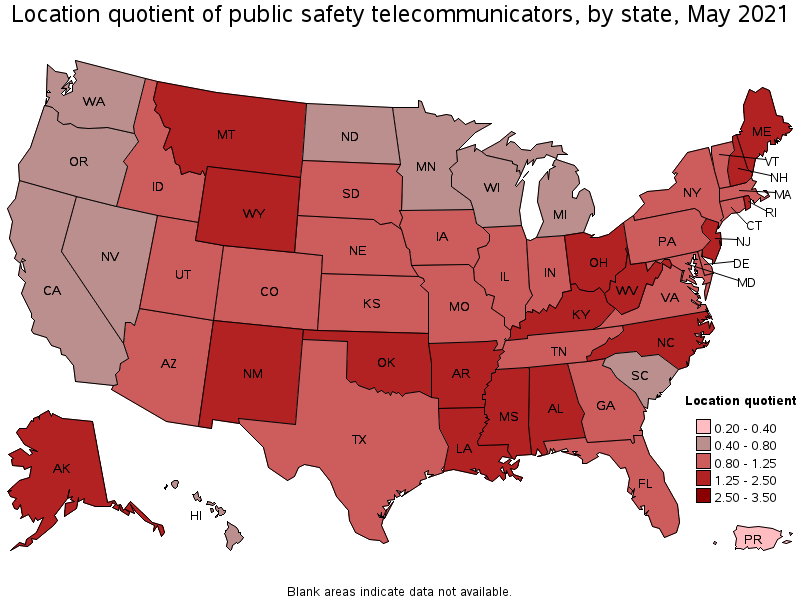
States with the highest concentration of jobs and location quotients in Public Safety Telecommunicators:
| State | Employment (1) | Employment per thousand jobs | Location quotient (9) | Hourly mean wage | Annual mean wage (2) |
|---|---|---|---|---|---|
| Mississippi | 1,520 | 1.38 | 2.01 | $ 14.18 | $ 29,480 |
| Alaska | 400 | 1.36 | 1.97 | $ 27.48 | $ 57,150 |
| West Virginia | 890 | 1.35 | 1.96 | $ 15.61 | $ 32,480 |
| Oklahoma | 2,060 | 1.32 | 1.92 | $ 16.77 | $ 34,890 |
| Alabama | 2,340 | 1.21 | 1.76 | $ 17.02 | $ 35,410 |
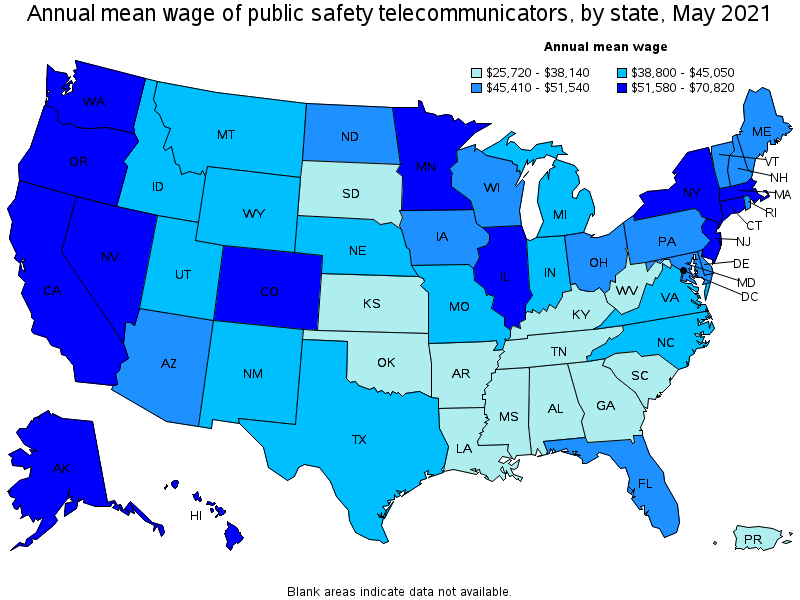
Top paying states for Public Safety Telecommunicators:
| State | Employment (1) | Employment per thousand jobs | Location quotient (9) | Hourly mean wage | Annual mean wage (2) |
|---|---|---|---|---|---|
| California | 7,780 | 0.47 | 0.68 | $ 34.05 | $ 70,820 |
| Washington | 1,320 | 0.41 | 0.60 | $ 30.69 | $ 63,840 |
| Oregon | 880 | 0.48 | 0.70 | $ 28.49 | $ 59,250 |
| Minnesota | 1,010 | 0.37 | 0.54 | $ 28.38 | $ 59,040 |
| Connecticut | 1,330 | 0.84 | 1.22 | $ 28.18 | $ 58,620 |
Metropolitan areas with the highest employment level in Public Safety Telecommunicators:
| Metropolitan area | Employment (1) | Employment per thousand jobs | Location quotient (9) | Hourly mean wage | Annual mean wage (2) |
|---|---|---|---|---|---|
| New York-Newark-Jersey City, NY-NJ-PA | 6,510 | 0.75 | 1.09 | $ 26.86 | $ 55,880 |
| Dallas-Fort Worth-Arlington, TX | 2,130 | 0.59 | 0.86 | $ 21.21 | $ 44,110 |
| Chicago-Naperville-Elgin, IL-IN-WI | 2,120 | 0.50 | 0.73 | $ 29.43 | $ 61,220 |
| Los Angeles-Long Beach-Anaheim, CA | 1,820 | 0.32 | 0.46 | $ 34.09 | $ 70,910 |
| Boston-Cambridge-Nashua, MA-NH | 1,670 | 0.65 | 0.94 | $ 25.67 | $ 53,390 |
| Houston-The Woodlands-Sugar Land, TX | 1,620 | 0.56 | 0.81 | $ 20.62 | $ 42,890 |
| Philadelphia-Camden-Wilmington, PA-NJ-DE-MD | 1,610 | 0.61 | 0.88 | $ 24.07 | $ 50,070 |
| Washington-Arlington-Alexandria, DC-VA-MD-WV | 1,480 | 0.50 | 0.73 | $ 25.48 | $ 53,010 |
| Miami-Fort Lauderdale-West Palm Beach, FL | 1,340 | 0.55 | 0.80 | $ 27.86 | $ 57,950 |
| Atlanta-Sandy Springs-Roswell, GA | 1,330 | 0.52 | 0.75 | $ 19.51 | $ 40,580 |
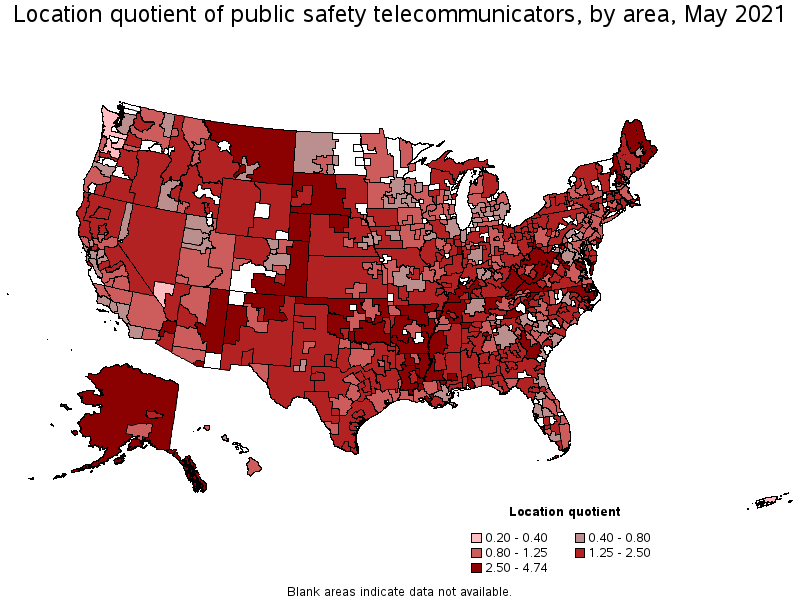
Metropolitan areas with the highest concentration of jobs and location quotients in Public Safety Telecommunicators:
| Metropolitan area | Employment (1) | Employment per thousand jobs | Location quotient (9) | Hourly mean wage | Annual mean wage (2) |
|---|---|---|---|---|---|
| Ocean City, NJ | 100 | 2.46 | 3.58 | $ 21.73 | $ 45,200 |
| Danville, IL | 60 | 2.25 | 3.27 | $ 19.37 | $ 40,290 |
| Hattiesburg, MS | 130 | 2.20 | 3.20 | $ 14.39 | $ 29,940 |
| Gadsden, AL | 70 | 2.08 | 3.01 | $ 15.82 | $ 32,900 |
| Florence-Muscle Shoals, AL | 100 | 2.01 | 2.92 | $ 16.98 | $ 35,310 |
| Kingston, NY | 100 | 1.93 | 2.80 | $ 22.62 | $ 47,050 |
| Atlantic City-Hammonton, NJ | 220 | 1.93 | 2.80 | $ 23.02 | $ 47,880 |
| Daphne-Fairhope-Foley, AL | 140 | 1.91 | 2.78 | $ 17.97 | $ 37,380 |
| Wheeling, WV-OH | 110 | 1.88 | 2.74 | $ 17.59 | $ 36,580 |
| Carbondale-Marion, IL | 90 | 1.70 | 2.47 | $ 22.37 | $ 46,520 |
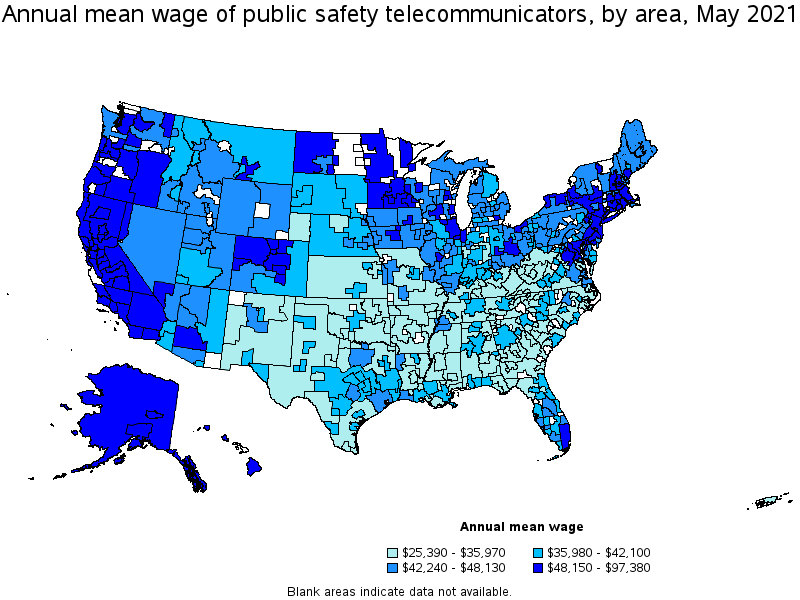
Top paying metropolitan areas for Public Safety Telecommunicators:
| Metropolitan area | Employment (1) | Employment per thousand jobs | Location quotient (9) | Hourly mean wage | Annual mean wage (2) |
|---|---|---|---|---|---|
| San Jose-Sunnyvale-Santa Clara, CA | 410 | 0.39 | 0.56 | $ 46.82 | $ 97,380 |
| San Francisco-Oakland-Hayward, CA | 1,030 | 0.46 | 0.67 | $ 44.61 | $ 92,790 |
| Oxnard-Thousand Oaks-Ventura, CA | 120 | 0.39 | 0.57 | $ 36.99 | $ 76,950 |
| Santa Maria-Santa Barbara, CA | 100 | 0.53 | 0.77 | $ 35.94 | $ 74,740 |
| Santa Cruz-Watsonville, CA | 90 | 0.92 | 1.33 | $ 35.52 | $ 73,870 |
| San Luis Obispo-Paso Robles-Arroyo Grande, CA | 80 | 0.68 | 0.99 | $ 35.47 | $ 73,770 |
| Santa Rosa, CA | 130 | 0.68 | 0.99 | $ 34.77 | $ 72,330 |
| Stockton-Lodi, CA | 100 | 0.39 | 0.56 | $ 34.67 | $ 72,120 |
| Los Angeles-Long Beach-Anaheim, CA | 1,820 | 0.32 | 0.46 | $ 34.09 | $ 70,910 |
| Seattle-Tacoma-Bellevue, WA | 620 | 0.32 | 0.47 | $ 34.06 | $ 70,840 |
Nonmetropolitan areas with the highest employment in Public Safety Telecommunicators:
| Nonmetropolitan area | Employment (1) | Employment per thousand jobs | Location quotient (9) | Hourly mean wage | Annual mean wage (2) |
|---|---|---|---|---|---|
| Kansas nonmetropolitan area | 580 | 1.54 | 2.24 | $ 16.20 | $ 33,690 |
| Southeast Oklahoma nonmetropolitan area | 420 | 2.57 | 3.73 | $ 16.31 | $ 33,920 |
| Piedmont North Carolina nonmetropolitan area | 350 | 1.44 | 2.09 | $ 17.29 | $ 35,970 |
| West Texas Region of Texas nonmetropolitan area | 310 | 1.66 | 2.40 | $ 16.58 | $ 34,480 |
| North Texas Region of Texas nonmetropolitan area | 290 | 1.10 | 1.59 | $ 16.85 | $ 35,050 |
Nonmetropolitan areas with the highest concentration of jobs and location quotients in Public Safety Telecommunicators:
| Nonmetropolitan area | Employment (1) | Employment per thousand jobs | Location quotient (9) | Hourly mean wage | Annual mean wage (2) |
|---|---|---|---|---|---|
| East-Central Montana nonmetropolitan area | 200 | 3.27 | 4.74 | $ 18.49 | $ 38,470 |
| Southwest Oklahoma nonmetropolitan area | 190 | 3.23 | 4.69 | $ 16.96 | $ 35,280 |
| Northeast Virginia nonmetropolitan area | 140 | 2.94 | 4.26 | $ 16.68 | $ 34,690 |
| Northwest Oklahoma nonmetropolitan area | 260 | 2.85 | 4.14 | $ 16.07 | $ 33,430 |
| Southeast Oklahoma nonmetropolitan area | 420 | 2.57 | 3.73 | $ 16.31 | $ 33,920 |
Top paying nonmetropolitan areas for Public Safety Telecommunicators:
| Nonmetropolitan area | Employment (1) | Employment per thousand jobs | Location quotient (9) | Hourly mean wage | Annual mean wage (2) |
|---|---|---|---|---|---|
| West North Dakota nonmetropolitan area | 50 | 0.50 | 0.73 | $ 27.26 | $ 56,710 |
| Eastern Sierra-Mother Lode Region of California nonmetropolitan area | 100 | 1.70 | 2.47 | $ 26.16 | $ 54,400 |
| North Coast Region of California nonmetropolitan area | 140 | 1.43 | 2.08 | $ 25.68 | $ 53,420 |
| Southeast Minnesota nonmetropolitan area | 70 | 0.47 | 0.68 | $ 25.14 | $ 52,280 |
| Southwest Minnesota nonmetropolitan area | 70 | 0.58 | 0.85 | $ 25.11 | $ 52,220 |
These estimates are calculated with data collected from employers in all industry sectors, all metropolitan and nonmetropolitan areas, and all states and the District of Columbia. The top employment and wage figures are provided above. The complete list is available in the downloadable XLS files.
The percentile wage estimate is the value of a wage below which a certain percent of workers fall. The median wage is the 50th percentile wage estimate—50 percent of workers earn less than the median and 50 percent of workers earn more than the median. More about percentile wages.
(1) Estimates for detailed occupations do not sum to the totals because the totals include occupations not shown separately. Estimates do not include self-employed workers.
(2) Annual wages have been calculated by multiplying the hourly mean wage by a "year-round, full-time" hours figure of 2,080 hours; for those occupations where there is not an hourly wage published, the annual wage has been directly calculated from the reported survey data.
(3) The relative standard error (RSE) is a measure of the reliability of a survey statistic. The smaller the relative standard error, the more precise the estimate.
(7) The value is less than .005 percent of industry employment.
(8) Estimate not released.
(9) The location quotient is the ratio of the area concentration of occupational employment to the national average concentration. A location quotient greater than one indicates the occupation has a higher share of employment than average, and a location quotient less than one indicates the occupation is less prevalent in the area than average.
Other OEWS estimates and related information:
May 2021 National Occupational Employment and Wage Estimates
May 2021 State Occupational Employment and Wage Estimates
May 2021 Metropolitan and Nonmetropolitan Area Occupational Employment and Wage Estimates
May 2021 National Industry-Specific Occupational Employment and Wage Estimates
Last Modified Date: March 31, 2022