
An official website of the United States government
An official website of the United States government
The .gov means it's official.
Federal government websites often end in .gov or .mil. Before sharing sensitive information,
make sure you're on a federal government site.
The site is secure.
The
https:// ensures that you are connecting to the official website and that any
information you provide is encrypted and transmitted securely.
Provide high-level administrative support by conducting research, preparing statistical reports, and handling information requests, as well as performing routine administrative functions such as preparing correspondence, receiving visitors, arranging conference calls, and scheduling meetings. May also train and supervise lower-level clerical staff. Excludes �Secretaries� (43-6012 through 43-6014).
Employment estimate and mean wage estimates for Executive Secretaries and Executive Administrative Assistants:
| Employment (1) | Employment RSE (3) |
Mean hourly wage |
Mean annual wage (2) |
Wage RSE (3) |
|---|---|---|---|---|
| 466,910 | 1.1 % | $ 32.15 | $ 66,870 | 0.3 % |
Percentile wage estimates for Executive Secretaries and Executive Administrative Assistants:
| Percentile | 10% | 25% | 50% (Median) |
75% | 90% |
|---|---|---|---|---|---|
| Hourly Wage | $ 18.57 | $ 23.43 | $ 29.84 | $ 37.55 | $ 47.25 |
| Annual Wage (2) | $ 38,620 | $ 48,720 | $ 62,060 | $ 78,110 | $ 98,280 |
Industries with the highest published employment and wages for Executive Secretaries and Executive Administrative Assistants are provided. For a list of all industries with employment in Executive Secretaries and Executive Administrative Assistants, see the Create Customized Tables function.
Industries with the highest levels of employment in Executive Secretaries and Executive Administrative Assistants:
| Industry | Employment (1) | Percent of industry employment | Hourly mean wage | Annual mean wage (2) |
|---|---|---|---|---|
| Colleges, Universities, and Professional Schools | 39,870 | 1.34 | $ 29.59 | $ 61,540 |
| Local Government, excluding schools and hospitals (OEWS Designation) | 36,340 | 0.68 | $ 31.99 | $ 66,540 |
| Management of Companies and Enterprises | 29,610 | 1.17 | $ 35.77 | $ 74,400 |
| State Government, excluding schools and hospitals (OEWS Designation) | 28,350 | 1.29 | $ 28.30 | $ 58,870 |
| Elementary and Secondary Schools | 24,740 | 0.31 | $ 30.39 | $ 63,200 |
Industries with the highest concentration of employment in Executive Secretaries and Executive Administrative Assistants:
| Industry | Employment (1) | Percent of industry employment | Hourly mean wage | Annual mean wage (2) |
|---|---|---|---|---|
| Agents and Managers for Artists, Athletes, Entertainers, and Other Public Figures | 630 | 2.67 | $ 31.48 | $ 65,480 |
| Grantmaking and Giving Services | 3,460 | 2.48 | $ 33.79 | $ 70,290 |
| Securities, Commodity Contracts, and Other Financial Investments and Related Activities | 20,840 | 2.17 | $ 39.82 | $ 82,830 |
| Independent Artists, Writers, and Performers | 890 | 1.97 | $ 32.07 | $ 66,700 |
| Lessors of Nonfinancial Intangible Assets (except Copyrighted Works) | 350 | 1.80 | $ 33.87 | $ 70,450 |
Top paying industries for Executive Secretaries and Executive Administrative Assistants:
| Industry | Employment (1) | Percent of industry employment | Hourly mean wage | Annual mean wage (2) |
|---|---|---|---|---|
| Computer and Peripheral Equipment Manufacturing | 1,480 | 0.95 | $ 45.84 | $ 95,350 |
| Inland Water Transportation | 90 | 0.34 | $ 42.71 | $ 88,840 |
| Other Information Services | 1,780 | 0.49 | $ 42.10 | $ 87,570 |
| Data Processing, Hosting, and Related Services | 1,530 | 0.40 | $ 40.65 | $ 84,560 |
| Monetary Authorities-Central Bank | 340 | 1.65 | $ 40.49 | $ 84,230 |
States and areas with the highest published employment, location quotients, and wages for Executive Secretaries and Executive Administrative Assistants are provided. For a list of all areas with employment in Executive Secretaries and Executive Administrative Assistants, see the Create Customized Tables function.
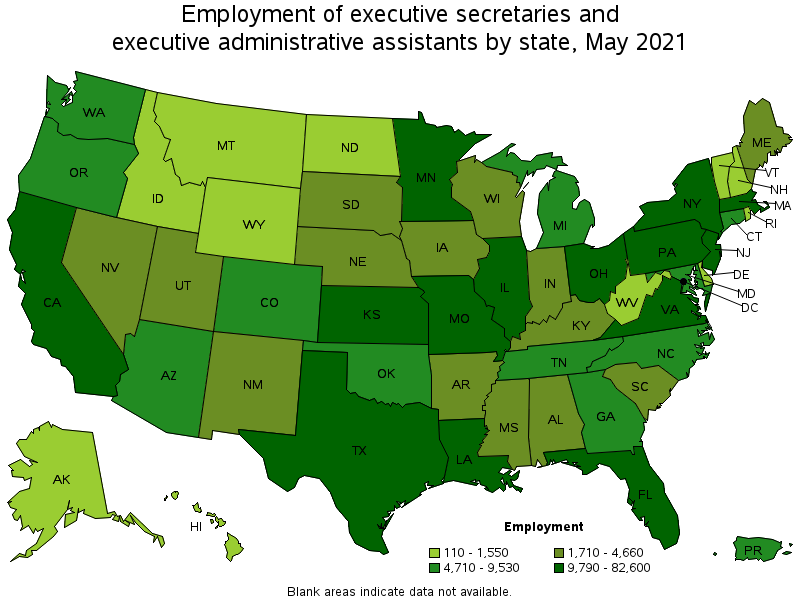
States with the highest employment level in Executive Secretaries and Executive Administrative Assistants:
| State | Employment (1) | Employment per thousand jobs | Location quotient (9) | Hourly mean wage | Annual mean wage (2) |
|---|---|---|---|---|---|
| New York | 82,600 | 9.53 | 2.87 | $ 38.25 | $ 79,560 |
| California | 57,520 | 3.48 | 1.05 | $ 36.17 | $ 75,230 |
| Texas | 33,820 | 2.77 | 0.83 | $ 30.79 | $ 64,040 |
| Florida | 22,490 | 2.61 | 0.79 | $ 25.39 | $ 52,800 |
| Illinois | 21,730 | 3.87 | 1.17 | $ 29.91 | $ 62,210 |
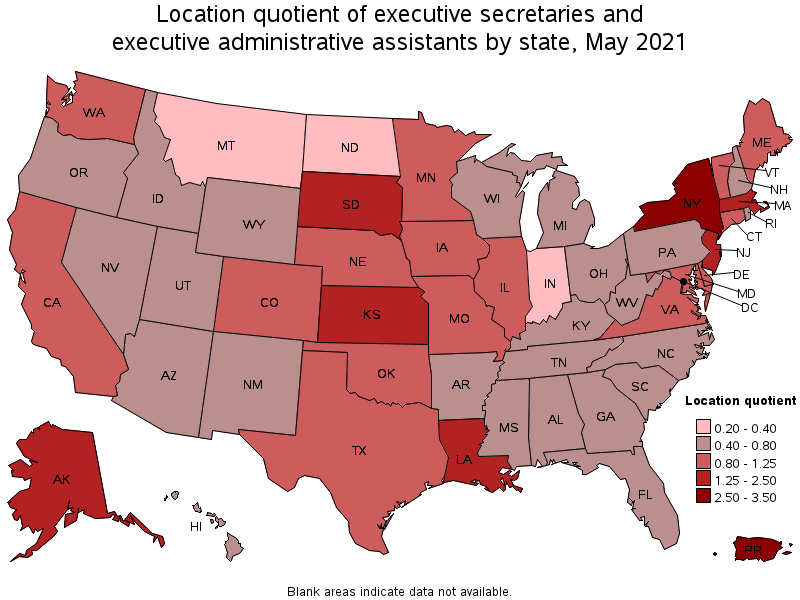
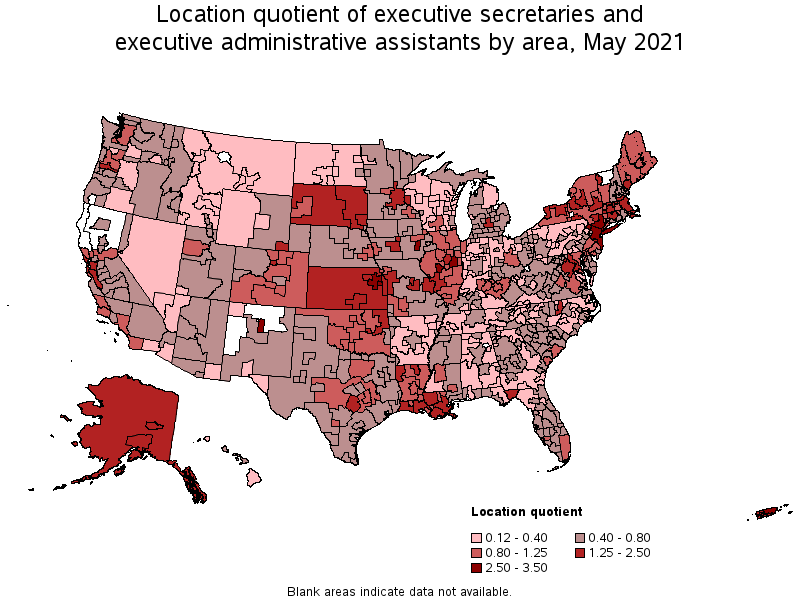
States with the highest concentration of jobs and location quotients in Executive Secretaries and Executive Administrative Assistants:
| State | Employment (1) | Employment per thousand jobs | Location quotient (9) | Hourly mean wage | Annual mean wage (2) |
|---|---|---|---|---|---|
| New York | 82,600 | 9.53 | 2.87 | $ 38.25 | $ 79,560 |
| District of Columbia | 5,340 | 8.07 | 2.43 | $ 38.20 | $ 79,460 |
| Kansas | 9,980 | 7.45 | 2.25 | $ 24.40 | $ 50,740 |
| Massachusetts | 19,230 | 5.67 | 1.71 | $ 33.64 | $ 69,970 |
| Louisiana | 9,790 | 5.46 | 1.65 | $ 23.99 | $ 49,900 |
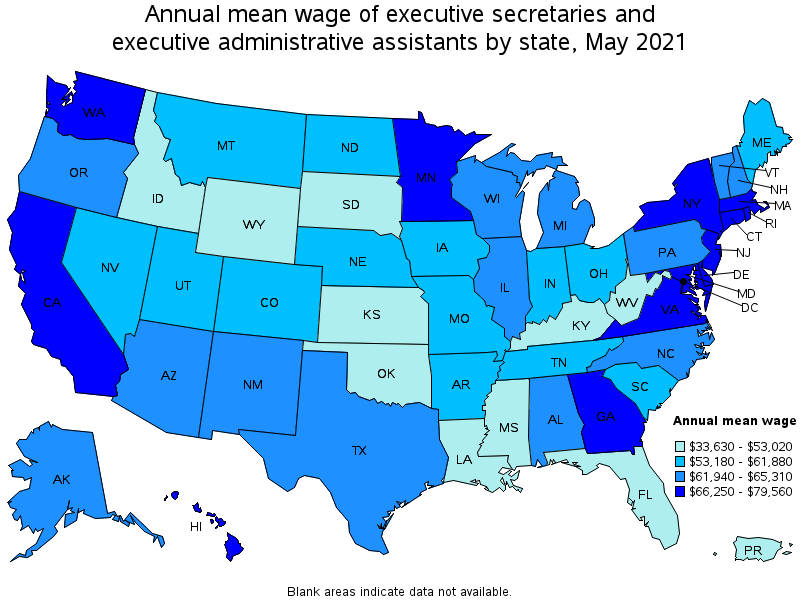
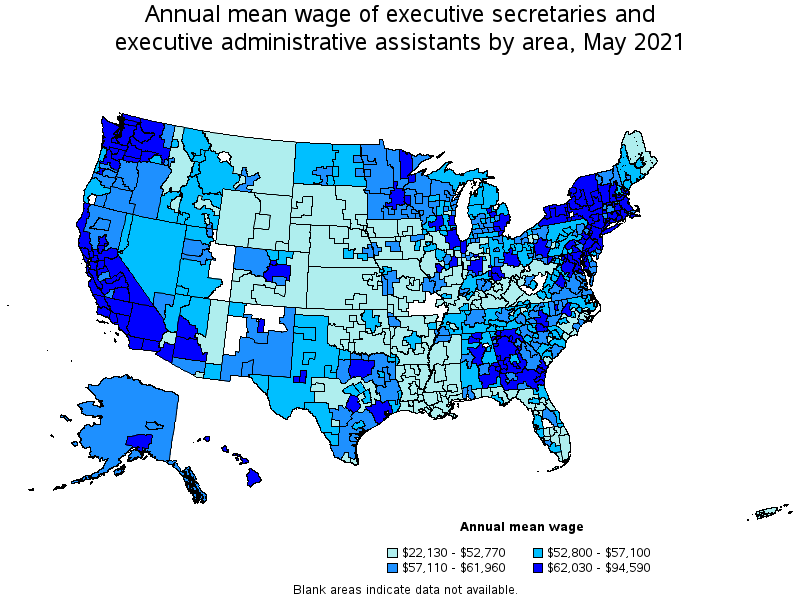
Top paying states for Executive Secretaries and Executive Administrative Assistants:
| State | Employment (1) | Employment per thousand jobs | Location quotient (9) | Hourly mean wage | Annual mean wage (2) |
|---|---|---|---|---|---|
| New York | 82,600 | 9.53 | 2.87 | $ 38.25 | $ 79,560 |
| District of Columbia | 5,340 | 8.07 | 2.43 | $ 38.20 | $ 79,460 |
| Hawaii | 890 | 1.63 | 0.49 | $ 36.31 | $ 75,530 |
| California | 57,520 | 3.48 | 1.05 | $ 36.17 | $ 75,230 |
| Connecticut | 5,840 | 3.71 | 1.12 | $ 36.09 | $ 75,070 |
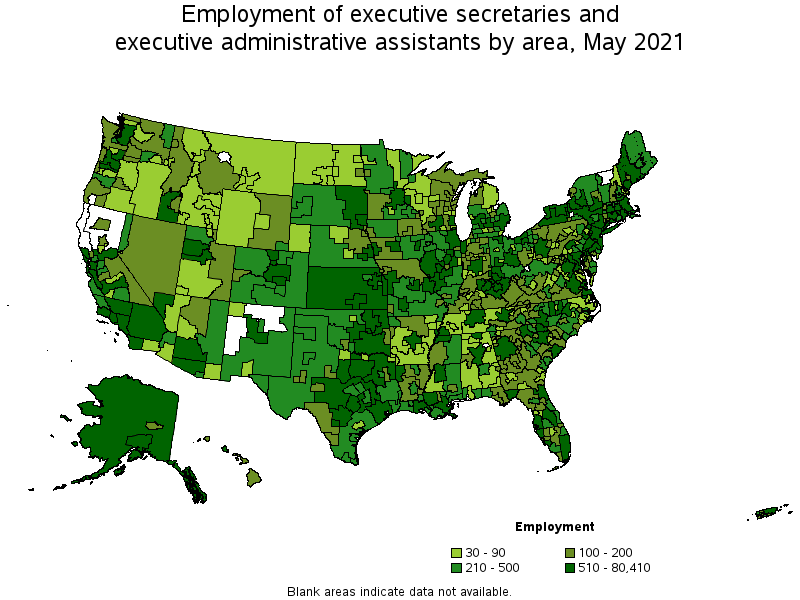
Metropolitan areas with the highest employment level in Executive Secretaries and Executive Administrative Assistants:
| Metropolitan area | Employment (1) | Employment per thousand jobs | Location quotient (9) | Hourly mean wage | Annual mean wage (2) |
|---|---|---|---|---|---|
| New York-Newark-Jersey City, NY-NJ-PA | 80,410 | 9.27 | 2.80 | $ 38.49 | $ 80,060 |
| Los Angeles-Long Beach-Anaheim, CA | 20,960 | 3.67 | 1.11 | $ 33.21 | $ 69,090 |
| Chicago-Naperville-Elgin, IL-IN-WI | 15,510 | 3.66 | 1.11 | $ 31.08 | $ 64,650 |
| Boston-Cambridge-Nashua, MA-NH | 15,070 | 5.83 | 1.76 | $ 34.76 | $ 72,290 |
| Washington-Arlington-Alexandria, DC-VA-MD-WV | 13,850 | 4.72 | 1.43 | $ 37.60 | $ 78,200 |
| San Francisco-Oakland-Hayward, CA | 12,160 | 5.42 | 1.64 | $ 42.03 | $ 87,420 |
| Dallas-Fort Worth-Arlington, TX | 9,480 | 2.64 | 0.80 | $ 32.56 | $ 67,730 |
| Miami-Fort Lauderdale-West Palm Beach, FL | 8,330 | 3.40 | 1.02 | $ 23.88 | $ 49,660 |
| Minneapolis-St. Paul-Bloomington, MN-WI | 8,010 | 4.40 | 1.33 | $ 32.73 | $ 68,090 |
| Austin-Round Rock, TX | 7,710 | 7.18 | 2.17 | $ 30.60 | $ 63,640 |
Metropolitan areas with the highest concentration of jobs and location quotients in Executive Secretaries and Executive Administrative Assistants:
| Metropolitan area | Employment (1) | Employment per thousand jobs | Location quotient (9) | Hourly mean wage | Annual mean wage (2) |
|---|---|---|---|---|---|
| Springfield, IL | 1,060 | 10.97 | 3.31 | $ 29.92 | $ 62,240 |
| Topeka, KS | 1,050 | 9.86 | 2.98 | $ 22.03 | $ 45,810 |
| Lawrence, KS | 450 | 9.79 | 2.96 | $ 24.55 | $ 51,070 |
| New York-Newark-Jersey City, NY-NJ-PA | 80,410 | 9.27 | 2.80 | $ 38.49 | $ 80,060 |
| Champaign-Urbana, IL | 840 | 8.54 | 2.58 | $ 31.42 | $ 65,360 |
| Santa Fe, NM | 480 | 8.45 | 2.55 | $ 29.84 | $ 62,060 |
| Iowa City, IA | 730 | 8.33 | 2.51 | $ 26.33 | $ 54,760 |
| Manhattan, KS | 290 | 7.88 | 2.38 | $ 22.94 | $ 47,710 |
| Albany-Schenectady-Troy, NY | 3,050 | 7.27 | 2.19 | $ 34.43 | $ 71,610 |
| Austin-Round Rock, TX | 7,710 | 7.18 | 2.17 | $ 30.60 | $ 63,640 |
Top paying metropolitan areas for Executive Secretaries and Executive Administrative Assistants:
| Metropolitan area | Employment (1) | Employment per thousand jobs | Location quotient (9) | Hourly mean wage | Annual mean wage (2) |
|---|---|---|---|---|---|
| San Jose-Sunnyvale-Santa Clara, CA | 4,830 | 4.52 | 1.36 | $ 45.48 | $ 94,590 |
| Bridgeport-Stamford-Norwalk, CT | 1,480 | 3.94 | 1.19 | $ 42.19 | $ 87,760 |
| San Francisco-Oakland-Hayward, CA | 12,160 | 5.42 | 1.64 | $ 42.03 | $ 87,420 |
| New York-Newark-Jersey City, NY-NJ-PA | 80,410 | 9.27 | 2.80 | $ 38.49 | $ 80,060 |
| Washington-Arlington-Alexandria, DC-VA-MD-WV | 13,850 | 4.72 | 1.43 | $ 37.60 | $ 78,200 |
| Urban Honolulu, HI | 670 | 1.70 | 0.51 | $ 37.19 | $ 77,350 |
| Napa, CA | 190 | 2.70 | 0.81 | $ 36.89 | $ 76,730 |
| Midland, TX | 200 | 2.13 | 0.64 | $ 36.43 | $ 75,780 |
| Corvallis, OR | 80 | 2.14 | 0.65 | $ 36.02 | $ 74,910 |
| Vallejo-Fairfield, CA | 250 | 1.94 | 0.59 | $ 35.61 | $ 74,060 |
Nonmetropolitan areas with the highest employment in Executive Secretaries and Executive Administrative Assistants:
| Nonmetropolitan area | Employment (1) | Employment per thousand jobs | Location quotient (9) | Hourly mean wage | Annual mean wage (2) |
|---|---|---|---|---|---|
| Kansas nonmetropolitan area | 2,700 | 7.18 | 2.17 | $ 22.22 | $ 46,210 |
| Southwest Maine nonmetropolitan area | 750 | 4.09 | 1.23 | $ 25.39 | $ 52,800 |
| Southwest New York nonmetropolitan area | 650 | 3.87 | 1.17 | $ 33.31 | $ 69,290 |
| Alaska nonmetropolitan area | 640 | 6.60 | 1.99 | $ 29.67 | $ 61,720 |
| Hill Country Region of Texas nonmetropolitan area | 620 | 3.26 | 0.98 | $ 25.16 | $ 52,330 |
Nonmetropolitan areas with the highest concentration of jobs and location quotients in Executive Secretaries and Executive Administrative Assistants:
| Nonmetropolitan area | Employment (1) | Employment per thousand jobs | Location quotient (9) | Hourly mean wage | Annual mean wage (2) |
|---|---|---|---|---|---|
| Kansas nonmetropolitan area | 2,700 | 7.18 | 2.17 | $ 22.22 | $ 46,210 |
| West South Dakota nonmetropolitan area | 420 | 7.08 | 2.14 | $ 20.58 | $ 42,800 |
| Alaska nonmetropolitan area | 640 | 6.60 | 1.99 | $ 29.67 | $ 61,720 |
| Massachusetts nonmetropolitan area | 280 | 4.91 | 1.48 | $ 31.44 | $ 65,390 |
| Northeast Oklahoma nonmetropolitan area | 510 | 4.48 | 1.35 | $ 19.81 | $ 41,210 |
Top paying nonmetropolitan areas for Executive Secretaries and Executive Administrative Assistants:
| Nonmetropolitan area | Employment (1) | Employment per thousand jobs | Location quotient (9) | Hourly mean wage | Annual mean wage (2) |
|---|---|---|---|---|---|
| Hawaii / Kauai nonmetropolitan area | 100 | 1.14 | 0.34 | $ 34.86 | $ 72,500 |
| Southwest New York nonmetropolitan area | 650 | 3.87 | 1.17 | $ 33.31 | $ 69,290 |
| Central East New York nonmetropolitan area | 510 | 3.39 | 1.02 | $ 33.06 | $ 68,760 |
| Eastern Sierra-Mother Lode Region of California nonmetropolitan area | 130 | 2.19 | 0.66 | $ 32.15 | $ 66,880 |
| Capital/Northern New York nonmetropolitan area | 450 | 3.34 | 1.01 | $ 31.67 | $ 65,870 |
These estimates are calculated with data collected from employers in all industry sectors, all metropolitan and nonmetropolitan areas, and all states and the District of Columbia. The top employment and wage figures are provided above. The complete list is available in the downloadable XLS files.
The percentile wage estimate is the value of a wage below which a certain percent of workers fall. The median wage is the 50th percentile wage estimate—50 percent of workers earn less than the median and 50 percent of workers earn more than the median. More about percentile wages.
(1) Estimates for detailed occupations do not sum to the totals because the totals include occupations not shown separately. Estimates do not include self-employed workers.
(2) Annual wages have been calculated by multiplying the hourly mean wage by a "year-round, full-time" hours figure of 2,080 hours; for those occupations where there is not an hourly wage published, the annual wage has been directly calculated from the reported survey data.
(3) The relative standard error (RSE) is a measure of the reliability of a survey statistic. The smaller the relative standard error, the more precise the estimate.
(9) The location quotient is the ratio of the area concentration of occupational employment to the national average concentration. A location quotient greater than one indicates the occupation has a higher share of employment than average, and a location quotient less than one indicates the occupation is less prevalent in the area than average.
Other OEWS estimates and related information:
May 2021 National Occupational Employment and Wage Estimates
May 2021 State Occupational Employment and Wage Estimates
May 2021 Metropolitan and Nonmetropolitan Area Occupational Employment and Wage Estimates
May 2021 National Industry-Specific Occupational Employment and Wage Estimates
Last Modified Date: March 31, 2022