
An official website of the United States government
An official website of the United States government
The .gov means it's official.
Federal government websites often end in .gov or .mil. Before sharing sensitive information,
make sure you're on a federal government site.
The site is secure.
The
https:// ensures that you are connecting to the official website and that any
information you provide is encrypted and transmitted securely.
Perform routine administrative functions such as drafting correspondence, scheduling appointments, organizing and maintaining paper and electronic files, or providing information to callers. Excludes legal, medical, and executive secretaries (43-6011 through 43-6013).
Employment estimate and mean wage estimates for Secretaries and Administrative Assistants, Except Legal, Medical, and Executive:
| Employment (1) | Employment RSE (3) |
Mean hourly wage |
Mean annual wage (2) |
Wage RSE (3) |
|---|---|---|---|---|
| 1,825,980 | 0.5 % | $ 19.75 | $ 41,080 | 0.1 % |
Percentile wage estimates for Secretaries and Administrative Assistants, Except Legal, Medical, and Executive:
| Percentile | 10% | 25% | 50% (Median) |
75% | 90% |
|---|---|---|---|---|---|
| Hourly Wage | $ 13.56 | $ 14.52 | $ 18.21 | $ 22.87 | $ 28.61 |
| Annual Wage (2) | $ 28,200 | $ 30,210 | $ 37,880 | $ 47,570 | $ 59,500 |
Industries with the highest published employment and wages for Secretaries and Administrative Assistants, Except Legal, Medical, and Executive are provided. For a list of all industries with employment in Secretaries and Administrative Assistants, Except Legal, Medical, and Executive, see the Create Customized Tables function.
Industries with the highest levels of employment in Secretaries and Administrative Assistants, Except Legal, Medical, and Executive:
| Industry | Employment (1) | Percent of industry employment | Hourly mean wage | Annual mean wage (2) |
|---|---|---|---|---|
| Elementary and Secondary Schools | 223,680 | 2.76 | $ 19.22 | $ 39,970 |
| Local Government, excluding schools and hospitals (OEWS Designation) | 109,810 | 2.04 | $ 22.02 | $ 45,810 |
| Colleges, Universities, and Professional Schools | 103,190 | 3.46 | $ 20.55 | $ 42,750 |
| Real Estate | 69,100 | 4.13 | $ 18.29 | $ 38,050 |
| Employment Services | 58,610 | 1.68 | $ 18.93 | $ 39,380 |
Industries with the highest concentration of employment in Secretaries and Administrative Assistants, Except Legal, Medical, and Executive:
| Industry | Employment (1) | Percent of industry employment | Hourly mean wage | Annual mean wage (2) |
|---|---|---|---|---|
| Agents and Managers for Artists, Athletes, Entertainers, and Other Public Figures | 3,550 | 15.12 | $ 19.87 | $ 41,340 |
| Religious Organizations | 14,040 | 7.83 | $ 17.97 | $ 37,380 |
| Death Care Services | 7,590 | 5.74 | $ 16.70 | $ 34,730 |
| Other Investment Pools and Funds | 670 | 5.33 | $ 19.21 | $ 39,950 |
| Business, Professional, Labor, Political, and Similar Organizations | 21,130 | 5.15 | $ 20.56 | $ 42,760 |
Top paying industries for Secretaries and Administrative Assistants, Except Legal, Medical, and Executive:
| Industry | Employment (1) | Percent of industry employment | Hourly mean wage | Annual mean wage (2) |
|---|---|---|---|---|
| Postal Service (federal government) | 780 | 0.12 | $ 29.85 | $ 62,080 |
| Monetary Authorities-Central Bank | 200 | 0.94 | $ 28.50 | $ 59,280 |
| Federal Executive Branch (OEWS Designation) | 9,350 | 0.44 | $ 26.26 | $ 54,630 |
| Metal Ore Mining | 260 | 0.63 | $ 25.73 | $ 53,510 |
| Natural Gas Distribution | 900 | 0.82 | $ 25.46 | $ 52,950 |
States and areas with the highest published employment, location quotients, and wages for Secretaries and Administrative Assistants, Except Legal, Medical, and Executive are provided. For a list of all areas with employment in Secretaries and Administrative Assistants, Except Legal, Medical, and Executive, see the Create Customized Tables function.
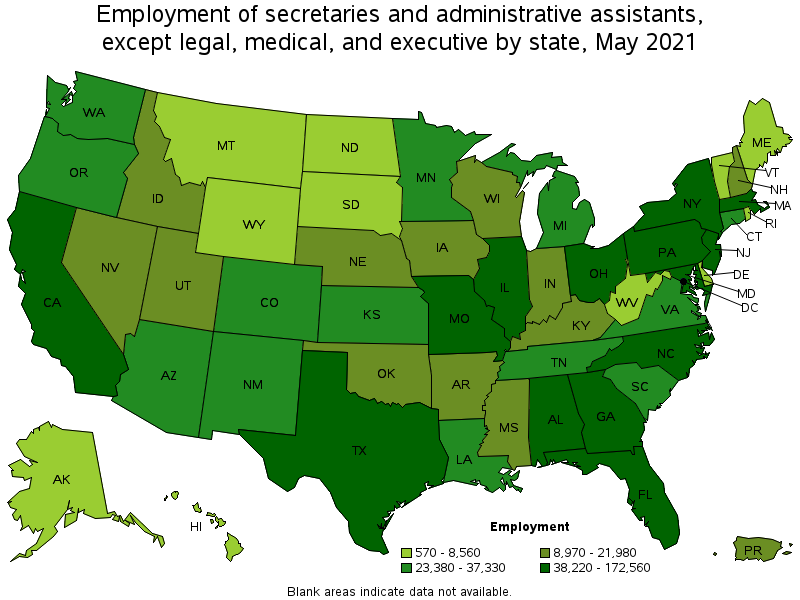
States with the highest employment level in Secretaries and Administrative Assistants, Except Legal, Medical, and Executive:
| State | Employment (1) | Employment per thousand jobs | Location quotient (9) | Hourly mean wage | Annual mean wage (2) |
|---|---|---|---|---|---|
| California | 172,560 | 10.44 | 0.81 | $ 23.04 | $ 47,930 |
| New York | 157,250 | 18.14 | 1.40 | $ 21.43 | $ 44,570 |
| Texas | 155,450 | 12.71 | 0.98 | $ 18.32 | $ 38,110 |
| Florida | 113,450 | 13.18 | 1.02 | $ 18.24 | $ 37,930 |
| Pennsylvania | 85,310 | 15.28 | 1.18 | $ 19.02 | $ 39,570 |
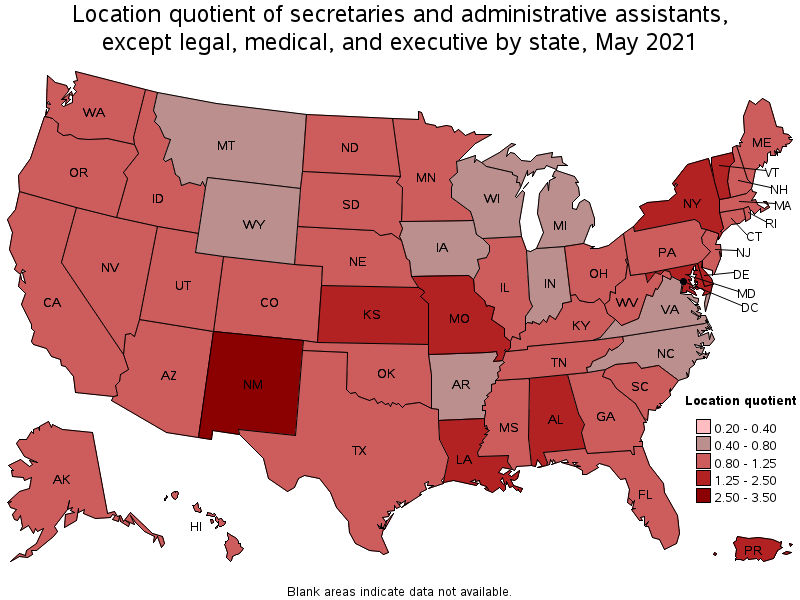
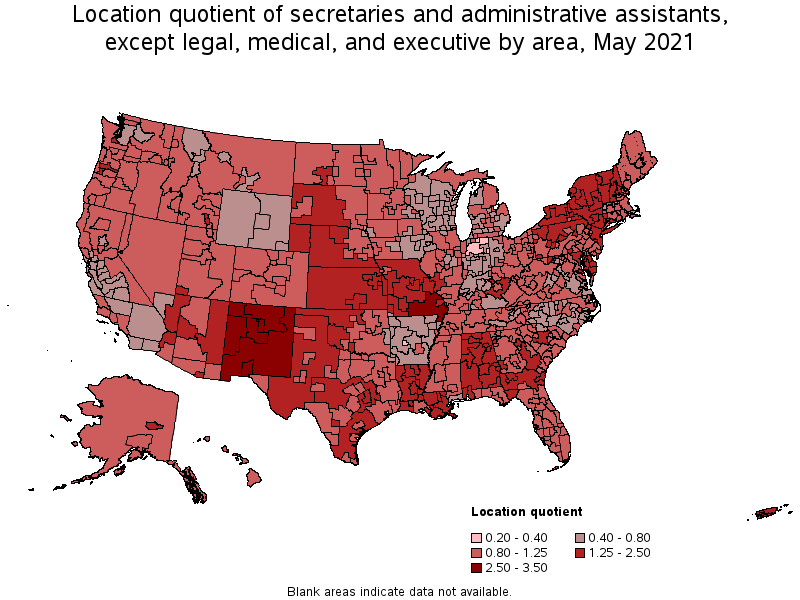
States with the highest concentration of jobs and location quotients in Secretaries and Administrative Assistants, Except Legal, Medical, and Executive:
| State | Employment (1) | Employment per thousand jobs | Location quotient (9) | Hourly mean wage | Annual mean wage (2) |
|---|---|---|---|---|---|
| New Mexico | 27,640 | 35.59 | 2.75 | $ 18.52 | $ 38,520 |
| Alabama | 45,890 | 23.80 | 1.84 | $ 18.02 | $ 37,490 |
| Kansas | 27,750 | 20.72 | 1.60 | $ 16.99 | $ 35,340 |
| District of Columbia | 13,340 | 20.14 | 1.55 | $ 24.85 | $ 51,690 |
| Missouri | 54,050 | 19.81 | 1.53 | $ 17.32 | $ 36,020 |
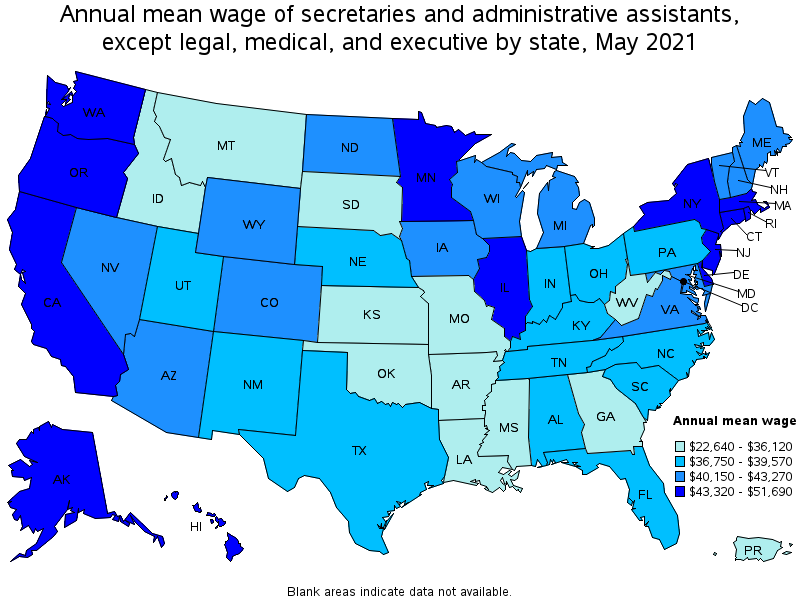
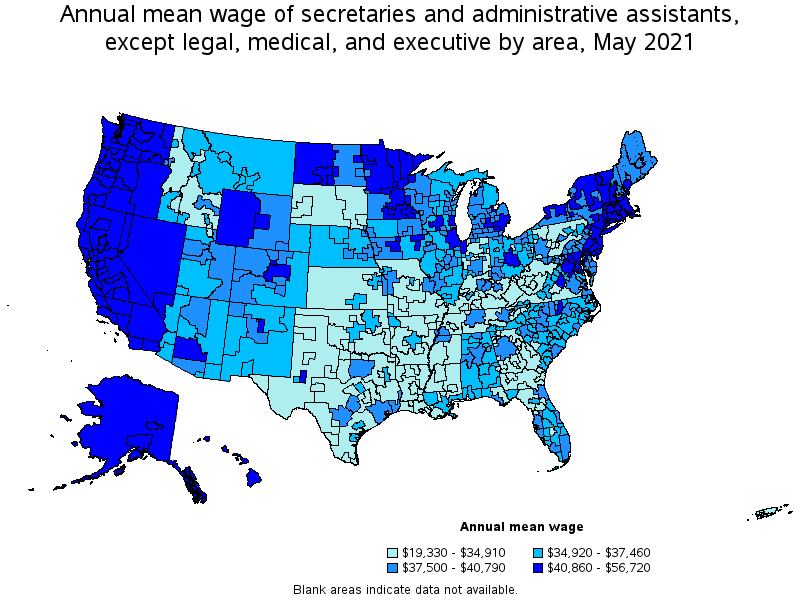
Top paying states for Secretaries and Administrative Assistants, Except Legal, Medical, and Executive:
| State | Employment (1) | Employment per thousand jobs | Location quotient (9) | Hourly mean wage | Annual mean wage (2) |
|---|---|---|---|---|---|
| District of Columbia | 13,340 | 20.14 | 1.55 | $ 24.85 | $ 51,690 |
| Massachusetts | 38,220 | 11.26 | 0.87 | $ 23.95 | $ 49,820 |
| Connecticut | 24,960 | 15.86 | 1.22 | $ 23.67 | $ 49,230 |
| Washington | 33,400 | 10.42 | 0.80 | $ 23.16 | $ 48,170 |
| California | 172,560 | 10.44 | 0.81 | $ 23.04 | $ 47,930 |
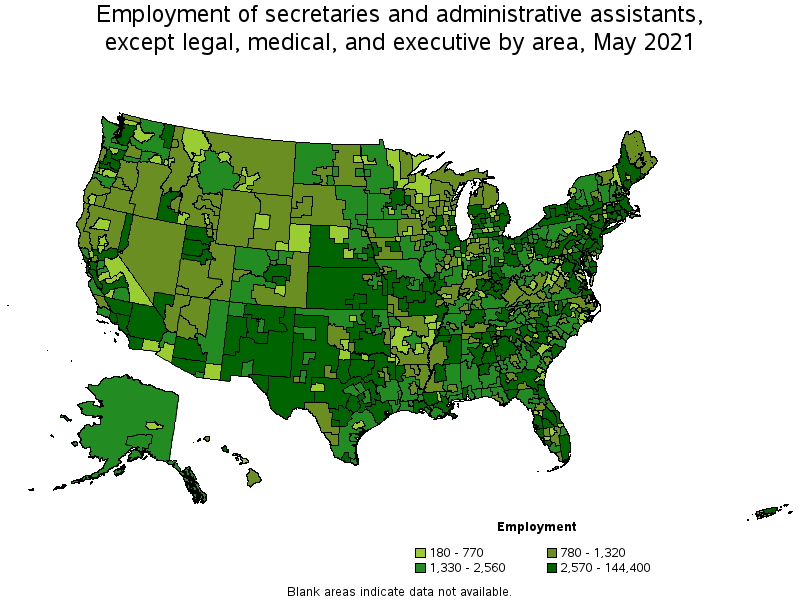
Metropolitan areas with the highest employment level in Secretaries and Administrative Assistants, Except Legal, Medical, and Executive:
| Metropolitan area | Employment (1) | Employment per thousand jobs | Location quotient (9) | Hourly mean wage | Annual mean wage (2) |
|---|---|---|---|---|---|
| New York-Newark-Jersey City, NY-NJ-PA | 144,400 | 16.64 | 1.28 | $ 22.13 | $ 46,040 |
| Los Angeles-Long Beach-Anaheim, CA | 65,350 | 11.43 | 0.88 | $ 22.40 | $ 46,580 |
| Chicago-Naperville-Elgin, IL-IN-WI | 45,760 | 10.81 | 0.83 | $ 21.92 | $ 45,600 |
| Dallas-Fort Worth-Arlington, TX | 40,520 | 11.29 | 0.87 | $ 19.42 | $ 40,400 |
| Philadelphia-Camden-Wilmington, PA-NJ-DE-MD | 39,950 | 15.05 | 1.16 | $ 20.92 | $ 43,520 |
| Miami-Fort Lauderdale-West Palm Beach, FL | 37,980 | 15.49 | 1.19 | $ 18.95 | $ 39,410 |
| Washington-Arlington-Alexandria, DC-VA-MD-WV | 37,550 | 12.80 | 0.99 | $ 23.41 | $ 48,680 |
| Houston-The Woodlands-Sugar Land, TX | 36,690 | 12.66 | 0.98 | $ 18.96 | $ 39,430 |
| Atlanta-Sandy Springs-Roswell, GA | 36,060 | 13.93 | 1.08 | $ 18.54 | $ 38,550 |
| Boston-Cambridge-Nashua, MA-NH | 29,310 | 11.34 | 0.87 | $ 24.38 | $ 50,700 |
Metropolitan areas with the highest concentration of jobs and location quotients in Secretaries and Administrative Assistants, Except Legal, Medical, and Executive:
| Metropolitan area | Employment (1) | Employment per thousand jobs | Location quotient (9) | Hourly mean wage | Annual mean wage (2) |
|---|---|---|---|---|---|
| Santa Fe, NM | 2,090 | 37.19 | 2.87 | $ 19.99 | $ 41,590 |
| Las Cruces, NM | 2,490 | 36.49 | 2.82 | $ 17.34 | $ 36,070 |
| Albuquerque, NM | 12,550 | 34.44 | 2.66 | $ 19.08 | $ 39,690 |
| Farmington, NM | 1,410 | 34.29 | 2.65 | $ 18.41 | $ 38,300 |
| Carson City, NV | 1,010 | 33.82 | 2.61 | $ 19.85 | $ 41,280 |
| Jefferson City, MO | 2,130 | 29.32 | 2.26 | $ 15.43 | $ 32,100 |
| Ithaca, NY | 1,350 | 29.04 | 2.24 | $ 22.86 | $ 47,540 |
| Montgomery, AL | 3,960 | 25.76 | 1.99 | $ 17.65 | $ 36,720 |
| Daphne-Fairhope-Foley, AL | 1,920 | 25.75 | 1.99 | $ 18.00 | $ 37,440 |
| Mobile, AL | 4,130 | 25.40 | 1.96 | $ 17.72 | $ 36,860 |
Top paying metropolitan areas for Secretaries and Administrative Assistants, Except Legal, Medical, and Executive:
| Metropolitan area | Employment (1) | Employment per thousand jobs | Location quotient (9) | Hourly mean wage | Annual mean wage (2) |
|---|---|---|---|---|---|
| San Francisco-Oakland-Hayward, CA | 22,030 | 9.83 | 0.76 | $ 27.27 | $ 56,720 |
| San Jose-Sunnyvale-Santa Clara, CA | 9,900 | 9.27 | 0.71 | $ 26.31 | $ 54,730 |
| Bridgeport-Stamford-Norwalk, CT | 5,890 | 15.69 | 1.21 | $ 26.18 | $ 54,450 |
| Seattle-Tacoma-Bellevue, WA | 17,750 | 9.26 | 0.71 | $ 24.41 | $ 50,770 |
| Boston-Cambridge-Nashua, MA-NH | 29,310 | 11.34 | 0.87 | $ 24.38 | $ 50,700 |
| Santa Rosa, CA | 2,190 | 11.41 | 0.88 | $ 23.86 | $ 49,630 |
| Fairbanks, AK | 570 | 16.47 | 1.27 | $ 23.81 | $ 49,520 |
| Kahului-Wailuku-Lahaina, HI | 680 | 10.67 | 0.82 | $ 23.58 | $ 49,050 |
| New Haven, CT | 4,980 | 18.12 | 1.40 | $ 23.53 | $ 48,950 |
| Vallejo-Fairfield, CA | 1,250 | 9.62 | 0.74 | $ 23.51 | $ 48,900 |
Nonmetropolitan areas with the highest employment in Secretaries and Administrative Assistants, Except Legal, Medical, and Executive:
| Nonmetropolitan area | Employment (1) | Employment per thousand jobs | Location quotient (9) | Hourly mean wage | Annual mean wage (2) |
|---|---|---|---|---|---|
| Kansas nonmetropolitan area | 8,680 | 23.11 | 1.78 | $ 15.79 | $ 32,840 |
| Southeast Missouri nonmetropolitan area | 7,060 | 44.64 | 3.44 | $ 14.38 | $ 29,910 |
| Eastern New Mexico nonmetropolitan area | 5,220 | 35.75 | 2.76 | $ 17.77 | $ 36,960 |
| North Texas Region of Texas nonmetropolitan area | 3,840 | 14.43 | 1.11 | $ 16.24 | $ 33,780 |
| Hill Country Region of Texas nonmetropolitan area | 3,440 | 18.10 | 1.40 | $ 16.26 | $ 33,830 |
Nonmetropolitan areas with the highest concentration of jobs and location quotients in Secretaries and Administrative Assistants, Except Legal, Medical, and Executive:
| Nonmetropolitan area | Employment (1) | Employment per thousand jobs | Location quotient (9) | Hourly mean wage | Annual mean wage (2) |
|---|---|---|---|---|---|
| Southeast Missouri nonmetropolitan area | 7,060 | 44.64 | 3.44 | $ 14.38 | $ 29,910 |
| Northern New Mexico nonmetropolitan area | 2,840 | 37.15 | 2.87 | $ 17.49 | $ 36,380 |
| Eastern New Mexico nonmetropolitan area | 5,220 | 35.75 | 2.76 | $ 17.77 | $ 36,960 |
| Southwest Alabama nonmetropolitan area | 1,650 | 26.15 | 2.02 | $ 16.85 | $ 35,050 |
| Maryland nonmetropolitan area | 1,340 | 23.51 | 1.81 | $ 18.52 | $ 38,520 |
Top paying nonmetropolitan areas for Secretaries and Administrative Assistants, Except Legal, Medical, and Executive:
| Nonmetropolitan area | Employment (1) | Employment per thousand jobs | Location quotient (9) | Hourly mean wage | Annual mean wage (2) |
|---|---|---|---|---|---|
| Massachusetts nonmetropolitan area | 820 | 14.15 | 1.09 | $ 22.45 | $ 46,690 |
| Hawaii / Kauai nonmetropolitan area | 1,050 | 11.80 | 0.91 | $ 22.08 | $ 45,920 |
| Eastern Sierra-Mother Lode Region of California nonmetropolitan area | 660 | 11.47 | 0.89 | $ 21.71 | $ 45,170 |
| Connecticut nonmetropolitan area | 510 | 16.17 | 1.25 | $ 21.60 | $ 44,930 |
| Western Washington nonmetropolitan area | 1,590 | 13.33 | 1.03 | $ 21.53 | $ 44,780 |
These estimates are calculated with data collected from employers in all industry sectors, all metropolitan and nonmetropolitan areas, and all states and the District of Columbia. The top employment and wage figures are provided above. The complete list is available in the downloadable XLS files.
The percentile wage estimate is the value of a wage below which a certain percent of workers fall. The median wage is the 50th percentile wage estimate—50 percent of workers earn less than the median and 50 percent of workers earn more than the median. More about percentile wages.
(1) Estimates for detailed occupations do not sum to the totals because the totals include occupations not shown separately. Estimates do not include self-employed workers.
(2) Annual wages have been calculated by multiplying the hourly mean wage by a "year-round, full-time" hours figure of 2,080 hours; for those occupations where there is not an hourly wage published, the annual wage has been directly calculated from the reported survey data.
(3) The relative standard error (RSE) is a measure of the reliability of a survey statistic. The smaller the relative standard error, the more precise the estimate.
(9) The location quotient is the ratio of the area concentration of occupational employment to the national average concentration. A location quotient greater than one indicates the occupation has a higher share of employment than average, and a location quotient less than one indicates the occupation is less prevalent in the area than average.
Other OEWS estimates and related information:
May 2021 National Occupational Employment and Wage Estimates
May 2021 State Occupational Employment and Wage Estimates
May 2021 Metropolitan and Nonmetropolitan Area Occupational Employment and Wage Estimates
May 2021 National Industry-Specific Occupational Employment and Wage Estimates
Last Modified Date: March 31, 2022