
An official website of the United States government
An official website of the United States government
The .gov means it's official.
Federal government websites often end in .gov or .mil. Before sharing sensitive information,
make sure you're on a federal government site.
The site is secure.
The
https:// ensures that you are connecting to the official website and that any
information you provide is encrypted and transmitted securely.
Format typescript and graphic elements using computer software to produce publication-ready material.
Employment estimate and mean wage estimates for Desktop Publishers:
| Employment (1) | Employment RSE (3) |
Mean hourly wage |
Mean annual wage (2) |
Wage RSE (3) |
|---|---|---|---|---|
| 7,600 | 13.6 % | $ 24.49 | $ 50,930 | 6.9 % |
Percentile wage estimates for Desktop Publishers:
| Percentile | 10% | 25% | 50% (Median) |
75% | 90% |
|---|---|---|---|---|---|
| Hourly Wage | $ 13.35 | $ 14.85 | $ 22.55 | $ 30.66 | $ 38.28 |
| Annual Wage (2) | $ 27,770 | $ 30,880 | $ 46,910 | $ 63,760 | $ 79,630 |
Industries with the highest published employment and wages for Desktop Publishers are provided. For a list of all industries with employment in Desktop Publishers, see the Create Customized Tables function.
Industries with the highest levels of employment in Desktop Publishers:
| Industry | Employment (1) | Percent of industry employment | Hourly mean wage | Annual mean wage (2) |
|---|---|---|---|---|
| Newspaper, Periodical, Book, and Directory Publishers | 2,690 | 1.08 | $ 20.16 | $ 41,930 |
| Business Support Services | 520 | 0.06 | $ 17.03 | $ 35,420 |
| Other Information Services | 390 | 0.11 | $ 20.72 | $ 43,100 |
| Management, Scientific, and Technical Consulting Services | 300 | 0.02 | $ 33.00 | $ 68,630 |
| Data Processing, Hosting, and Related Services | 270 | 0.07 | $ 18.08 | $ 37,610 |
Industries with the highest concentration of employment in Desktop Publishers:
| Industry | Employment (1) | Percent of industry employment | Hourly mean wage | Annual mean wage (2) |
|---|---|---|---|---|
| Newspaper, Periodical, Book, and Directory Publishers | 2,690 | 1.08 | $ 20.16 | $ 41,930 |
| Other Information Services | 390 | 0.11 | $ 20.72 | $ 43,100 |
| Data Processing, Hosting, and Related Services | 270 | 0.07 | $ 18.08 | $ 37,610 |
| Printing and Related Support Activities | 220 | 0.06 | $ 22.62 | $ 47,040 |
| Business Support Services | 520 | 0.06 | $ 17.03 | $ 35,420 |
Top paying industries for Desktop Publishers:
| Industry | Employment (1) | Percent of industry employment | Hourly mean wage | Annual mean wage (2) |
|---|---|---|---|---|
| Merchant Wholesalers, Nondurable Goods (4241, 4247, and 4249 only) | 30 | 0.01 | $ 41.22 | $ 85,730 |
| Navigational, Measuring, Electromedical, and Control Instruments Manufacturing | 40 | 0.01 | $ 33.80 | $ 70,300 |
| Management, Scientific, and Technical Consulting Services | 300 | 0.02 | $ 33.00 | $ 68,630 |
| Specialized Design Services | (8) | (8) | $ 32.46 | $ 67,510 |
| Architectural, Engineering, and Related Services | 40 | (7) | $ 32.37 | $ 67,330 |
States and areas with the highest published employment, location quotients, and wages for Desktop Publishers are provided. For a list of all areas with employment in Desktop Publishers, see the Create Customized Tables function.
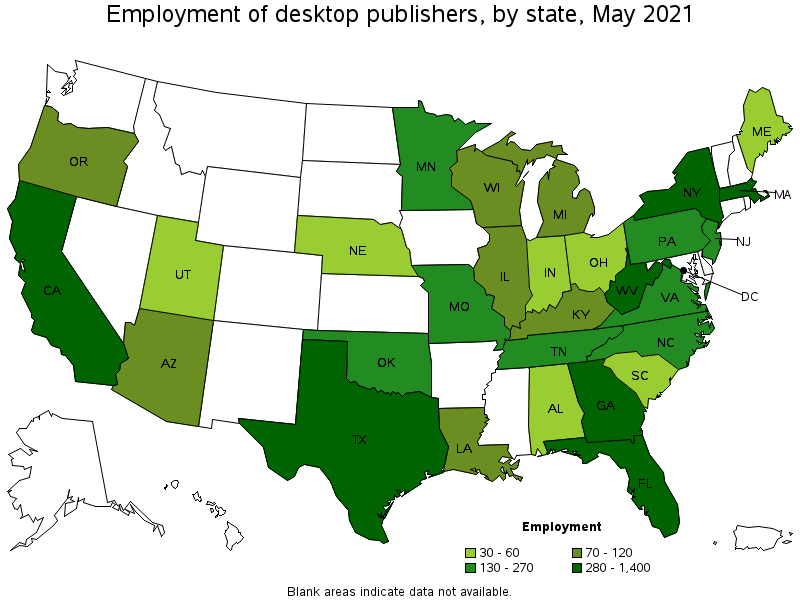
States with the highest employment level in Desktop Publishers:
| State | Employment (1) | Employment per thousand jobs | Location quotient (9) | Hourly mean wage | Annual mean wage (2) |
|---|---|---|---|---|---|
| Texas | 1,400 | 0.11 | 2.13 | $ 16.53 | $ 34,370 |
| New York | 910 | 0.11 | 1.95 | $ 32.59 | $ 67,780 |
| Georgia | 470 | 0.11 | 1.97 | $ 23.10 | $ 48,060 |
| California | 420 | 0.03 | 0.47 | $ 26.13 | $ 54,360 |
| Massachusetts | 330 | 0.10 | 1.82 | $ 31.71 | $ 65,950 |
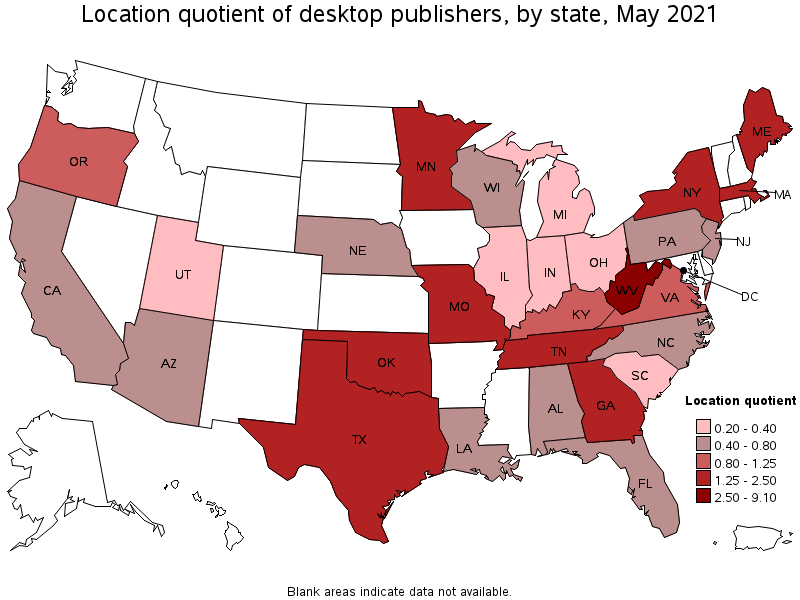
States with the highest concentration of jobs and location quotients in Desktop Publishers:
| State | Employment (1) | Employment per thousand jobs | Location quotient (9) | Hourly mean wage | Annual mean wage (2) |
|---|---|---|---|---|---|
| West Virginia | 320 | 0.49 | 9.10 | $ 15.80 | $ 32,850 |
| Texas | 1,400 | 0.11 | 2.13 | $ 16.53 | $ 34,370 |
| Georgia | 470 | 0.11 | 1.97 | $ 23.10 | $ 48,060 |
| New York | 910 | 0.11 | 1.95 | $ 32.59 | $ 67,780 |
| Minnesota | 270 | 0.10 | 1.86 | $ 25.71 | $ 53,480 |
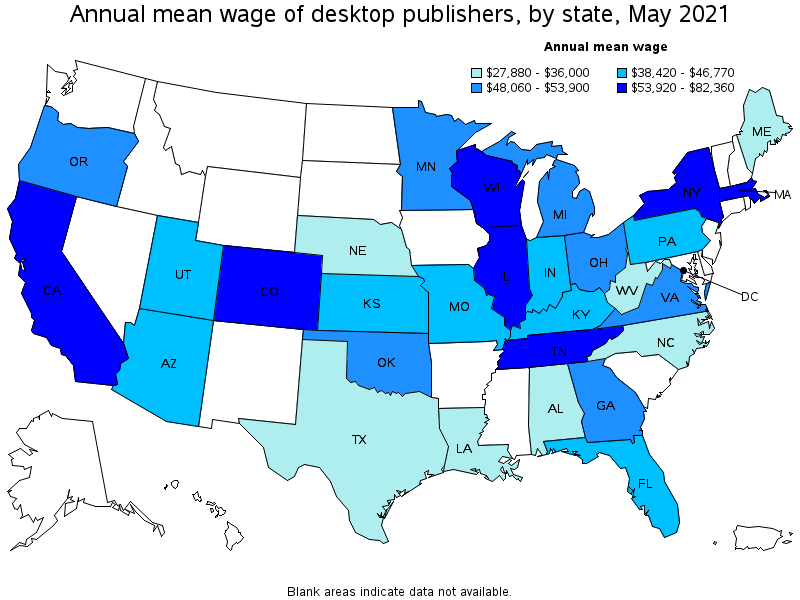
Top paying states for Desktop Publishers:
| State | Employment (1) | Employment per thousand jobs | Location quotient (9) | Hourly mean wage | Annual mean wage (2) |
|---|---|---|---|---|---|
| District of Columbia | 30 | 0.05 | 0.87 | $ 39.60 | $ 82,360 |
| Tennessee | 230 | 0.08 | 1.45 | $ 33.34 | $ 69,340 |
| New York | 910 | 0.11 | 1.95 | $ 32.59 | $ 67,780 |
| Massachusetts | 330 | 0.10 | 1.82 | $ 31.71 | $ 65,950 |
| Illinois | 70 | 0.01 | 0.23 | $ 30.21 | $ 62,830 |
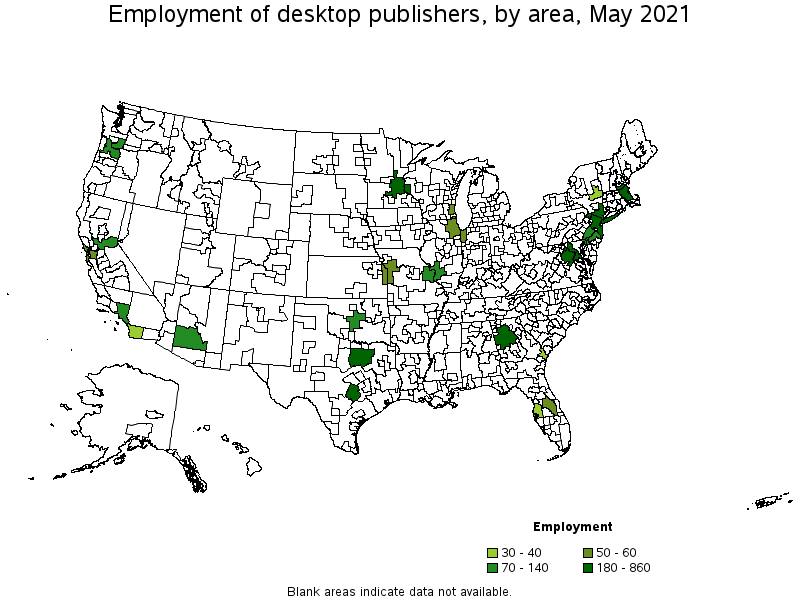
Metropolitan areas with the highest employment level in Desktop Publishers:
| Metropolitan area | Employment (1) | Employment per thousand jobs | Location quotient (9) | Hourly mean wage | Annual mean wage (2) |
|---|---|---|---|---|---|
| New York-Newark-Jersey City, NY-NJ-PA | 860 | 0.10 | 1.83 | $ 34.08 | $ 70,880 |
| Dallas-Fort Worth-Arlington, TX | 530 | 0.15 | 2.71 | (8) | (8) |
| Atlanta-Sandy Springs-Roswell, GA | 320 | 0.12 | 2.31 | $ 24.96 | $ 51,920 |
| Washington-Arlington-Alexandria, DC-VA-MD-WV | 270 | 0.09 | 1.71 | $ 33.10 | $ 68,860 |
| Minneapolis-St. Paul-Bloomington, MN-WI | 210 | 0.11 | 2.12 | $ 26.39 | $ 54,890 |
| Boston-Cambridge-Nashua, MA-NH | 210 | 0.08 | 1.47 | $ 31.92 | $ 66,400 |
| Austin-Round Rock, TX | 180 | 0.17 | 3.17 | (8) | (8) |
| Los Angeles-Long Beach-Anaheim, CA | 140 | 0.02 | 0.44 | $ 24.84 | $ 51,660 |
| Philadelphia-Camden-Wilmington, PA-NJ-DE-MD | 100 | 0.04 | 0.73 | $ 23.95 | $ 49,820 |
| Oklahoma City, OK | 90 | 0.15 | 2.77 | $ 26.30 | $ 54,690 |
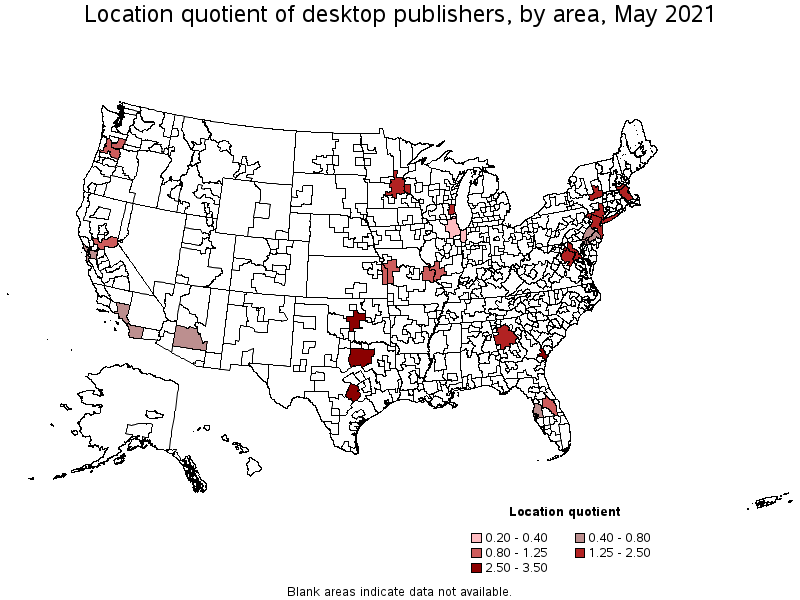
Metropolitan areas with the highest concentration of jobs and location quotients in Desktop Publishers:
| Metropolitan area | Employment (1) | Employment per thousand jobs | Location quotient (9) | Hourly mean wage | Annual mean wage (2) |
|---|---|---|---|---|---|
| Savannah, GA | 30 | 0.18 | 3.37 | $ 20.21 | $ 42,040 |
| Austin-Round Rock, TX | 180 | 0.17 | 3.17 | (8) | (8) |
| Oklahoma City, OK | 90 | 0.15 | 2.77 | $ 26.30 | $ 54,690 |
| Dallas-Fort Worth-Arlington, TX | 530 | 0.15 | 2.71 | (8) | (8) |
| Atlanta-Sandy Springs-Roswell, GA | 320 | 0.12 | 2.31 | $ 24.96 | $ 51,920 |
| Minneapolis-St. Paul-Bloomington, MN-WI | 210 | 0.11 | 2.12 | $ 26.39 | $ 54,890 |
| New York-Newark-Jersey City, NY-NJ-PA | 860 | 0.10 | 1.83 | $ 34.08 | $ 70,880 |
| Washington-Arlington-Alexandria, DC-VA-MD-WV | 270 | 0.09 | 1.71 | $ 33.10 | $ 68,860 |
| Albany-Schenectady-Troy, NY | 30 | 0.08 | 1.52 | (8) | (8) |
| Boston-Cambridge-Nashua, MA-NH | 210 | 0.08 | 1.47 | $ 31.92 | $ 66,400 |
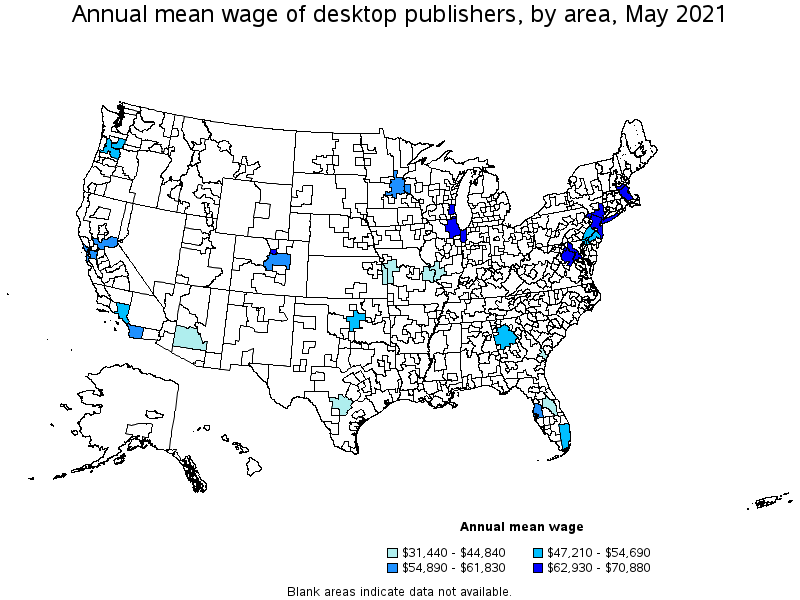
Top paying metropolitan areas for Desktop Publishers:
| Metropolitan area | Employment (1) | Employment per thousand jobs | Location quotient (9) | Hourly mean wage | Annual mean wage (2) |
|---|---|---|---|---|---|
| New York-Newark-Jersey City, NY-NJ-PA | 860 | 0.10 | 1.83 | $ 34.08 | $ 70,880 |
| Washington-Arlington-Alexandria, DC-VA-MD-WV | 270 | 0.09 | 1.71 | $ 33.10 | $ 68,860 |
| Boston-Cambridge-Nashua, MA-NH | 210 | 0.08 | 1.47 | $ 31.92 | $ 66,400 |
| Chicago-Naperville-Elgin, IL-IN-WI | 50 | 0.01 | 0.23 | $ 31.75 | $ 66,040 |
| Boulder, CO | (8) | (8) | (8) | $ 31.37 | $ 65,250 |
| Milwaukee-Waukesha-West Allis, WI | 60 | 0.08 | 1.43 | $ 30.25 | $ 62,930 |
| Sacramento--Roseville--Arden-Arcade, CA | 70 | 0.07 | 1.23 | $ 29.73 | $ 61,830 |
| Denver-Aurora-Lakewood, CO | (8) | (8) | (8) | $ 28.19 | $ 58,630 |
| San Francisco-Oakland-Hayward, CA | 50 | 0.02 | 0.43 | $ 27.23 | $ 56,630 |
| San Diego-Carlsbad, CA | 40 | 0.03 | 0.58 | $ 27.19 | $ 56,560 |
These estimates are calculated with data collected from employers in all industry sectors, all metropolitan and nonmetropolitan areas, and all states and the District of Columbia. The top employment and wage figures are provided above. The complete list is available in the downloadable XLS files.
The percentile wage estimate is the value of a wage below which a certain percent of workers fall. The median wage is the 50th percentile wage estimate—50 percent of workers earn less than the median and 50 percent of workers earn more than the median. More about percentile wages.
(1) Estimates for detailed occupations do not sum to the totals because the totals include occupations not shown separately. Estimates do not include self-employed workers.
(2) Annual wages have been calculated by multiplying the hourly mean wage by a "year-round, full-time" hours figure of 2,080 hours; for those occupations where there is not an hourly wage published, the annual wage has been directly calculated from the reported survey data.
(3) The relative standard error (RSE) is a measure of the reliability of a survey statistic. The smaller the relative standard error, the more precise the estimate.
(7) The value is less than .005 percent of industry employment.
(8) Estimate not released.
(9) The location quotient is the ratio of the area concentration of occupational employment to the national average concentration. A location quotient greater than one indicates the occupation has a higher share of employment than average, and a location quotient less than one indicates the occupation is less prevalent in the area than average.
Other OEWS estimates and related information:
May 2021 National Occupational Employment and Wage Estimates
May 2021 State Occupational Employment and Wage Estimates
May 2021 Metropolitan and Nonmetropolitan Area Occupational Employment and Wage Estimates
May 2021 National Industry-Specific Occupational Employment and Wage Estimates
Last Modified Date: March 31, 2022