
An official website of the United States government
An official website of the United States government
The .gov means it's official.
Federal government websites often end in .gov or .mil. Before sharing sensitive information,
make sure you're on a federal government site.
The site is secure.
The
https:// ensures that you are connecting to the official website and that any
information you provide is encrypted and transmitted securely.
All office and administrative support workers not listed separately.
Employment estimate and mean wage estimates for Office and Administrative Support Workers, All Other:
| Employment (1) | Employment RSE (3) |
Mean hourly wage |
Mean annual wage (2) |
Wage RSE (3) |
|---|---|---|---|---|
| 147,140 | 1.1 % | $ 20.47 | $ 42,580 | 0.4 % |
Percentile wage estimates for Office and Administrative Support Workers, All Other:
| Percentile | 10% | 25% | 50% (Median) |
75% | 90% |
|---|---|---|---|---|---|
| Hourly Wage | $ 12.00 | $ 14.33 | $ 18.22 | $ 23.36 | $ 29.68 |
| Annual Wage (2) | $ 24,960 | $ 29,800 | $ 37,900 | $ 48,590 | $ 61,730 |
Industries with the highest published employment and wages for Office and Administrative Support Workers, All Other are provided. For a list of all industries with employment in Office and Administrative Support Workers, All Other, see the Create Customized Tables function.
Industries with the highest levels of employment in Office and Administrative Support Workers, All Other:
| Industry | Employment (1) | Percent of industry employment | Hourly mean wage | Annual mean wage (2) |
|---|---|---|---|---|
| Local Government, excluding schools and hospitals (OEWS Designation) | 22,400 | 0.42 | $ 17.74 | $ 36,890 |
| Colleges, Universities, and Professional Schools | 21,110 | 0.71 | $ 21.67 | $ 45,070 |
| Federal Executive Branch (OEWS Designation) | 11,780 | 0.56 | $ 24.30 | $ 50,550 |
| Elementary and Secondary Schools | 8,320 | 0.10 | $ 16.42 | $ 34,160 |
| State Government, excluding schools and hospitals (OEWS Designation) | 7,310 | 0.33 | $ 21.29 | $ 44,280 |
Industries with the highest concentration of employment in Office and Administrative Support Workers, All Other:
| Industry | Employment (1) | Percent of industry employment | Hourly mean wage | Annual mean wage (2) |
|---|---|---|---|---|
| Junior Colleges | 4,380 | 0.71 | $ 17.24 | $ 35,850 |
| Colleges, Universities, and Professional Schools | 21,110 | 0.71 | $ 21.67 | $ 45,070 |
| Federal Executive Branch (OEWS Designation) | 11,780 | 0.56 | $ 24.30 | $ 50,550 |
| Local Government, excluding schools and hospitals (OEWS Designation) | 22,400 | 0.42 | $ 17.74 | $ 36,890 |
| Social Advocacy Organizations | 800 | 0.36 | $ 20.67 | $ 42,990 |
Top paying industries for Office and Administrative Support Workers, All Other:
| Industry | Employment (1) | Percent of industry employment | Hourly mean wage | Annual mean wage (2) |
|---|---|---|---|---|
| Fruit and Vegetable Preserving and Specialty Food Manufacturing | 60 | 0.03 | $ 33.37 | $ 69,410 |
| Foundation, Structure, and Building Exterior Contractors | (8) | (8) | $ 31.66 | $ 65,860 |
| Aerospace Product and Parts Manufacturing | 150 | 0.03 | $ 28.27 | $ 58,800 |
| Wholesale Electronic Markets and Agents and Brokers | 500 | 0.10 | $ 27.96 | $ 58,160 |
| Electric Power Generation, Transmission and Distribution | 110 | 0.03 | $ 26.98 | $ 56,120 |
States and areas with the highest published employment, location quotients, and wages for Office and Administrative Support Workers, All Other are provided. For a list of all areas with employment in Office and Administrative Support Workers, All Other, see the Create Customized Tables function.
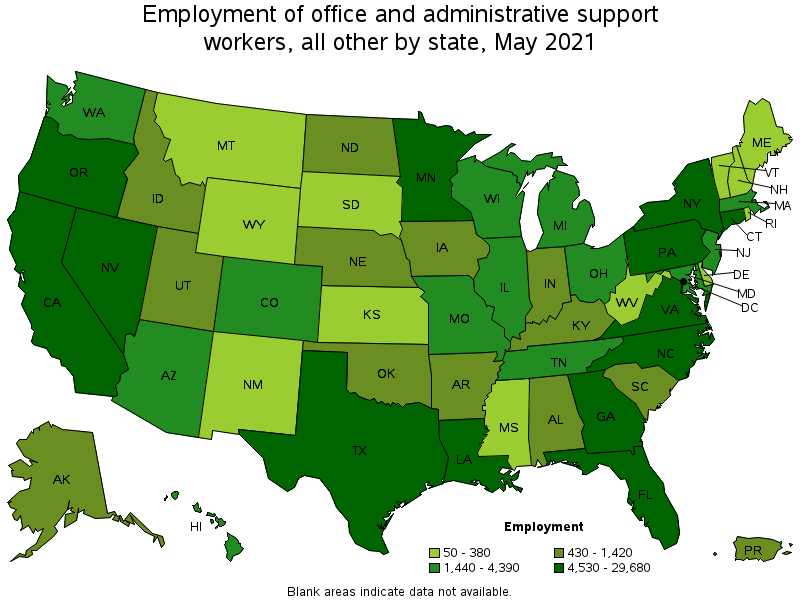
States with the highest employment level in Office and Administrative Support Workers, All Other:
| State | Employment (1) | Employment per thousand jobs | Location quotient (9) | Hourly mean wage | Annual mean wage (2) |
|---|---|---|---|---|---|
| California | 29,680 | 1.80 | 1.72 | $ 24.00 | $ 49,910 |
| Texas | 8,940 | 0.73 | 0.70 | $ 19.90 | $ 41,380 |
| Georgia | 6,890 | 1.57 | 1.51 | $ 19.03 | $ 39,580 |
| Florida | 6,660 | 0.77 | 0.74 | $ 19.79 | $ 41,170 |
| New York | 5,750 | 0.66 | 0.64 | $ 16.95 | $ 35,250 |
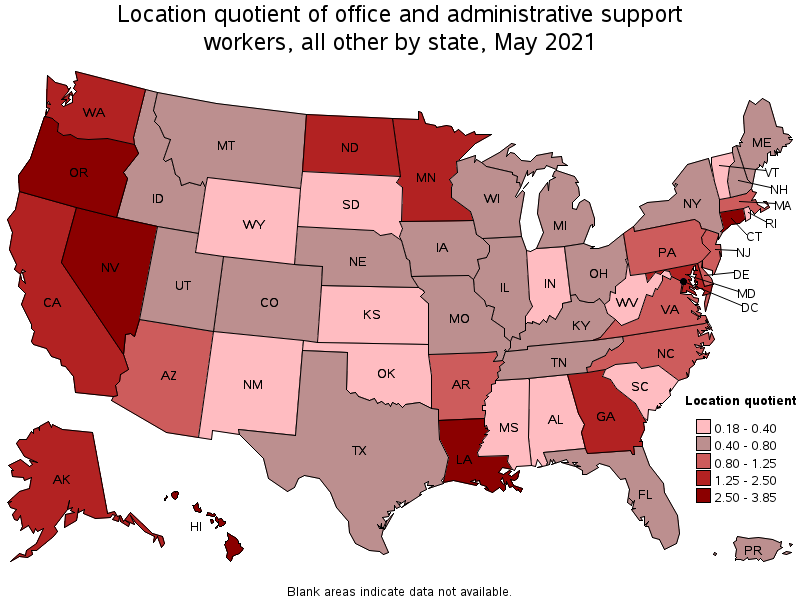
States with the highest concentration of jobs and location quotients in Office and Administrative Support Workers, All Other:
| State | Employment (1) | Employment per thousand jobs | Location quotient (9) | Hourly mean wage | Annual mean wage (2) |
|---|---|---|---|---|---|
| Hawaii | 2,210 | 4.03 | 3.85 | $ 20.68 | $ 43,010 |
| Nevada | 4,840 | 3.75 | 3.59 | $ 13.26 | $ 27,580 |
| Connecticut | 4,910 | 3.12 | 2.99 | $ 15.40 | $ 32,030 |
| Louisiana | 4,830 | 2.69 | 2.58 | $ 19.81 | $ 41,190 |
| Oregon | 4,900 | 2.68 | 2.57 | $ 20.95 | $ 43,570 |
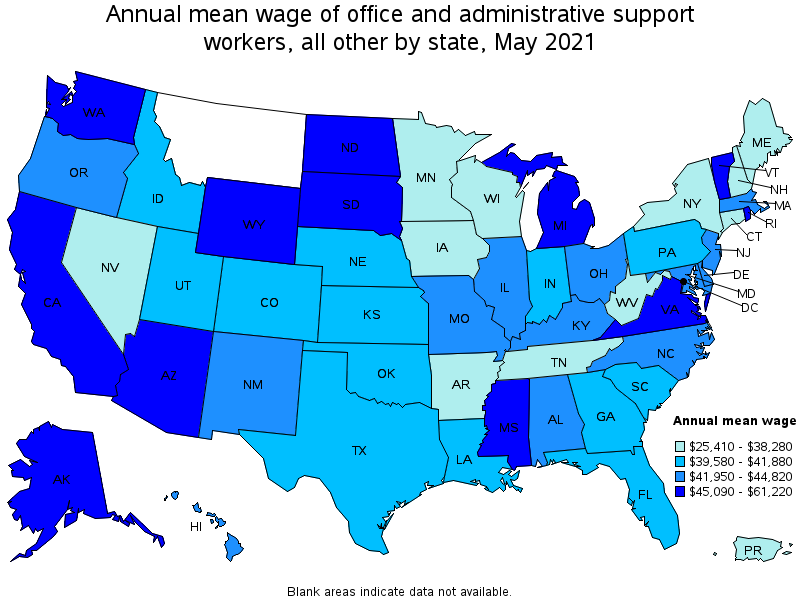
Top paying states for Office and Administrative Support Workers, All Other:
| State | Employment (1) | Employment per thousand jobs | Location quotient (9) | Hourly mean wage | Annual mean wage (2) |
|---|---|---|---|---|---|
| District of Columbia | 1,420 | 2.14 | 2.05 | $ 29.43 | $ 61,220 |
| Vermont | 100 | 0.35 | 0.33 | $ 26.75 | $ 55,640 |
| Alaska | 580 | 1.96 | 1.88 | $ 25.20 | $ 52,420 |
| California | 29,680 | 1.80 | 1.72 | $ 24.00 | $ 49,910 |
| South Dakota | 100 | 0.24 | 0.23 | $ 22.84 | $ 47,510 |
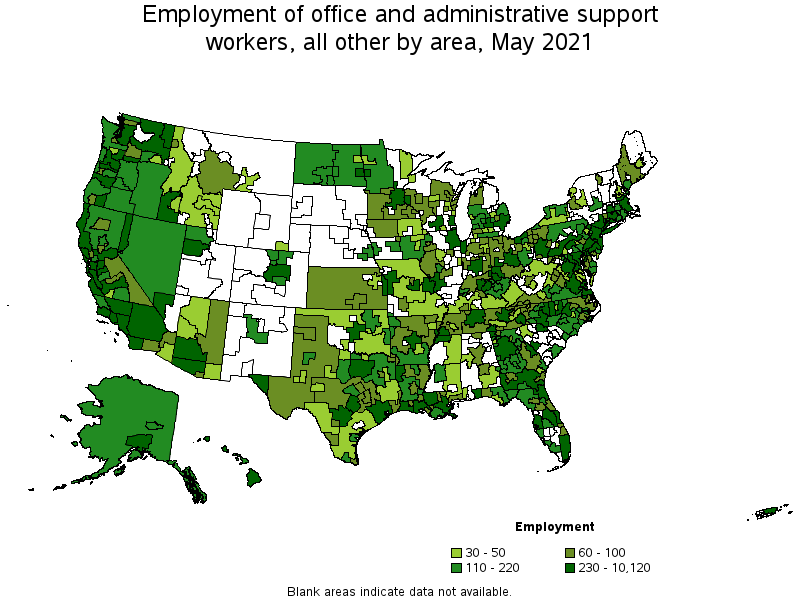
Metropolitan areas with the highest employment level in Office and Administrative Support Workers, All Other:
| Metropolitan area | Employment (1) | Employment per thousand jobs | Location quotient (9) | Hourly mean wage | Annual mean wage (2) |
|---|---|---|---|---|---|
| Los Angeles-Long Beach-Anaheim, CA | 10,120 | 1.77 | 1.69 | $ 25.26 | $ 52,550 |
| New York-Newark-Jersey City, NY-NJ-PA | 7,290 | 0.84 | 0.80 | $ 18.26 | $ 37,980 |
| Washington-Arlington-Alexandria, DC-VA-MD-WV | 4,320 | 1.47 | 1.41 | $ 25.63 | $ 53,310 |
| Las Vegas-Henderson-Paradise, NV | 4,290 | 4.67 | 4.47 | $ 12.83 | $ 26,690 |
| Minneapolis-St. Paul-Bloomington, MN-WI | 4,200 | 2.30 | 2.21 | $ 18.26 | $ 37,970 |
| Atlanta-Sandy Springs-Roswell, GA | 4,070 | 1.57 | 1.50 | $ 20.76 | $ 43,170 |
| San Francisco-Oakland-Hayward, CA | 3,980 | 1.77 | 1.70 | $ 27.91 | $ 58,050 |
| Portland-Vancouver-Hillsboro, OR-WA | 2,870 | 2.56 | 2.45 | $ 21.78 | $ 45,310 |
| Philadelphia-Camden-Wilmington, PA-NJ-DE-MD | 2,750 | 1.04 | 0.99 | $ 20.69 | $ 43,040 |
| Sacramento--Roseville--Arden-Arcade, CA | 2,640 | 2.69 | 2.57 | $ 22.00 | $ 45,760 |
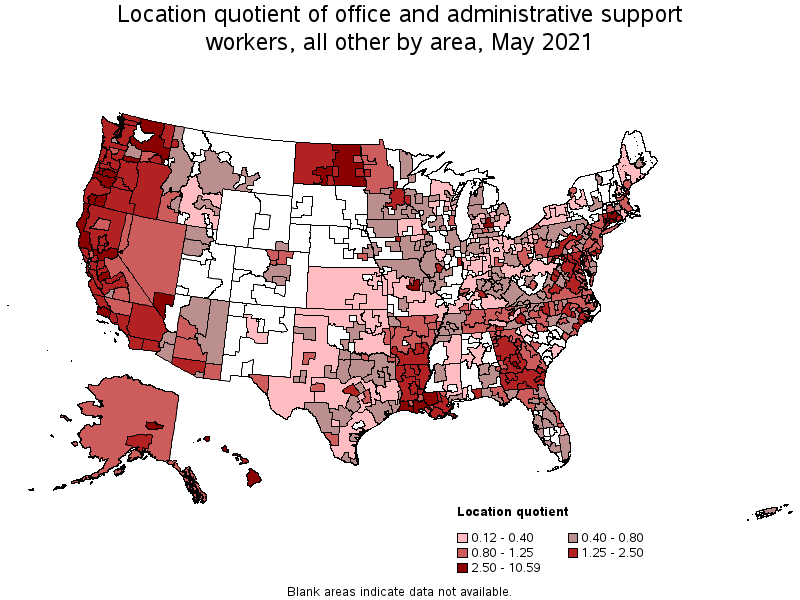
Metropolitan areas with the highest concentration of jobs and location quotients in Office and Administrative Support Workers, All Other:
| Metropolitan area | Employment (1) | Employment per thousand jobs | Location quotient (9) | Hourly mean wage | Annual mean wage (2) |
|---|---|---|---|---|---|
| Jefferson City, MO | 800 | 11.06 | 10.59 | $ 22.48 | $ 46,760 |
| Lansing-East Lansing, MI | 1,270 | 6.46 | 6.18 | $ 26.38 | $ 54,860 |
| Danbury, CT | 430 | 5.97 | 5.72 | $ 13.00 | $ 27,030 |
| Carson City, NV | 150 | 5.06 | 4.84 | $ 15.56 | $ 32,370 |
| New Haven, CT | 1,320 | 4.81 | 4.61 | $ 14.60 | $ 30,370 |
| Las Vegas-Henderson-Paradise, NV | 4,290 | 4.67 | 4.47 | $ 12.83 | $ 26,690 |
| Urban Honolulu, HI | 1,600 | 4.05 | 3.88 | $ 21.19 | $ 44,070 |
| Baton Rouge, LA | 1,400 | 3.82 | 3.65 | $ 21.30 | $ 44,300 |
| Eugene, OR | 530 | 3.59 | 3.44 | $ 21.17 | $ 44,030 |
| Lafayette, LA | 670 | 3.57 | 3.41 | $ 18.16 | $ 37,770 |
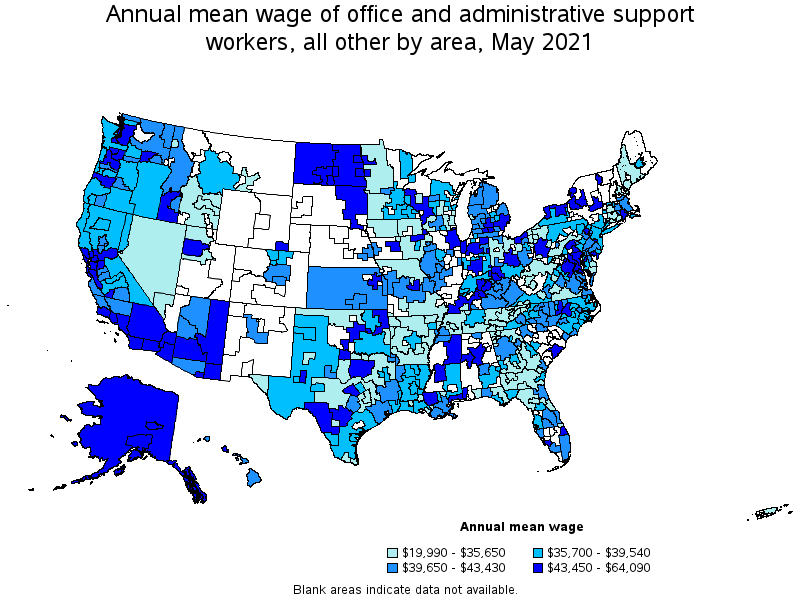
Top paying metropolitan areas for Office and Administrative Support Workers, All Other:
| Metropolitan area | Employment (1) | Employment per thousand jobs | Location quotient (9) | Hourly mean wage | Annual mean wage (2) |
|---|---|---|---|---|---|
| Burlington-South Burlington, VT | 60 | 0.56 | 0.53 | $ 30.81 | $ 64,090 |
| San Francisco-Oakland-Hayward, CA | 3,980 | 1.77 | 1.70 | $ 27.91 | $ 58,050 |
| San Jose-Sunnyvale-Santa Clara, CA | 1,500 | 1.41 | 1.35 | $ 27.10 | $ 56,360 |
| Santa Maria-Santa Barbara, CA | 520 | 2.67 | 2.56 | $ 26.81 | $ 55,760 |
| Lansing-East Lansing, MI | 1,270 | 6.46 | 6.18 | $ 26.38 | $ 54,860 |
| Fairbanks, AK | 110 | 3.16 | 3.03 | $ 26.07 | $ 54,230 |
| Santa Cruz-Watsonville, CA | 310 | 3.37 | 3.22 | $ 25.77 | $ 53,600 |
| Washington-Arlington-Alexandria, DC-VA-MD-WV | 4,320 | 1.47 | 1.41 | $ 25.63 | $ 53,310 |
| Tuscaloosa, AL | 40 | 0.41 | 0.39 | $ 25.45 | $ 52,940 |
| Los Angeles-Long Beach-Anaheim, CA | 10,120 | 1.77 | 1.69 | $ 25.26 | $ 52,550 |
Nonmetropolitan areas with the highest employment in Office and Administrative Support Workers, All Other:
| Nonmetropolitan area | Employment (1) | Employment per thousand jobs | Location quotient (9) | Hourly mean wage | Annual mean wage (2) |
|---|---|---|---|---|---|
| Hawaii / Kauai nonmetropolitan area | 490 | 5.53 | 5.29 | $ 19.11 | $ 39,750 |
| Southern Pennsylvania nonmetropolitan area | 340 | 1.88 | 1.80 | $ 15.04 | $ 31,280 |
| South Georgia nonmetropolitan area | 310 | 1.71 | 1.64 | $ 16.08 | $ 33,440 |
| Eastern Washington nonmetropolitan area | 310 | 3.33 | 3.19 | $ 19.82 | $ 41,220 |
| North Coast Region of California nonmetropolitan area | 270 | 2.70 | 2.59 | $ 17.33 | $ 36,050 |
Nonmetropolitan areas with the highest concentration of jobs and location quotients in Office and Administrative Support Workers, All Other:
| Nonmetropolitan area | Employment (1) | Employment per thousand jobs | Location quotient (9) | Hourly mean wage | Annual mean wage (2) |
|---|---|---|---|---|---|
| Hawaii / Kauai nonmetropolitan area | 490 | 5.53 | 5.29 | $ 19.11 | $ 39,750 |
| Eastern Washington nonmetropolitan area | 310 | 3.33 | 3.19 | $ 19.82 | $ 41,220 |
| East North Dakota nonmetropolitan area | 170 | 2.78 | 2.67 | $ 23.07 | $ 47,990 |
| North Coast Region of California nonmetropolitan area | 270 | 2.70 | 2.59 | $ 17.33 | $ 36,050 |
| Central Oregon nonmetropolitan area | 130 | 2.09 | 2.00 | $ 18.84 | $ 39,190 |
Top paying nonmetropolitan areas for Office and Administrative Support Workers, All Other:
| Nonmetropolitan area | Employment (1) | Employment per thousand jobs | Location quotient (9) | Hourly mean wage | Annual mean wage (2) |
|---|---|---|---|---|---|
| Alaska nonmetropolitan area | 120 | 1.19 | 1.14 | $ 26.55 | $ 55,230 |
| West Kentucky nonmetropolitan area | 50 | 0.35 | 0.33 | $ 24.56 | $ 51,070 |
| Northeast Oklahoma nonmetropolitan area | 40 | 0.33 | 0.31 | $ 24.36 | $ 50,670 |
| East North Dakota nonmetropolitan area | 170 | 2.78 | 2.67 | $ 23.07 | $ 47,990 |
| East South Dakota nonmetropolitan area | (8) | (8) | (8) | $ 22.82 | $ 47,470 |
These estimates are calculated with data collected from employers in all industry sectors, all metropolitan and nonmetropolitan areas, and all states and the District of Columbia. The top employment and wage figures are provided above. The complete list is available in the downloadable XLS files.
The percentile wage estimate is the value of a wage below which a certain percent of workers fall. The median wage is the 50th percentile wage estimate—50 percent of workers earn less than the median and 50 percent of workers earn more than the median. More about percentile wages.
(1) Estimates for detailed occupations do not sum to the totals because the totals include occupations not shown separately. Estimates do not include self-employed workers.
(2) Annual wages have been calculated by multiplying the hourly mean wage by a "year-round, full-time" hours figure of 2,080 hours; for those occupations where there is not an hourly wage published, the annual wage has been directly calculated from the reported survey data.
(3) The relative standard error (RSE) is a measure of the reliability of a survey statistic. The smaller the relative standard error, the more precise the estimate.
(8) Estimate not released.
(9) The location quotient is the ratio of the area concentration of occupational employment to the national average concentration. A location quotient greater than one indicates the occupation has a higher share of employment than average, and a location quotient less than one indicates the occupation is less prevalent in the area than average.
Other OEWS estimates and related information:
May 2021 National Occupational Employment and Wage Estimates
May 2021 State Occupational Employment and Wage Estimates
May 2021 Metropolitan and Nonmetropolitan Area Occupational Employment and Wage Estimates
May 2021 National Industry-Specific Occupational Employment and Wage Estimates
Last Modified Date: March 31, 2022