
An official website of the United States government
An official website of the United States government
The .gov means it's official.
Federal government websites often end in .gov or .mil. Before sharing sensitive information,
make sure you're on a federal government site.
The site is secure.
The
https:// ensures that you are connecting to the official website and that any
information you provide is encrypted and transmitted securely.
Inspect agricultural commodities, processing equipment, and facilities, and fish and logging operations, to ensure compliance with regulations and laws governing health, quality, and safety.
Employment estimate and mean wage estimates for Agricultural Inspectors:
| Employment (1) | Employment RSE (3) |
Mean hourly wage |
Mean annual wage (2) |
Wage RSE (3) |
|---|---|---|---|---|
| 13,630 | 2.7 % | $ 22.80 | $ 47,430 | 0.8 % |
Percentile wage estimates for Agricultural Inspectors:
| Percentile | 10% | 25% | 50% (Median) |
75% | 90% |
|---|---|---|---|---|---|
| Hourly Wage | $ 14.42 | $ 17.12 | $ 21.70 | $ 27.33 | $ 33.39 |
| Annual Wage (2) | $ 29,990 | $ 35,610 | $ 45,140 | $ 56,850 | $ 69,450 |
Industries with the highest published employment and wages for Agricultural Inspectors are provided. For a list of all industries with employment in Agricultural Inspectors, see the Create Customized Tables function.
Industries with the highest levels of employment in Agricultural Inspectors:
| Industry | Employment (1) | Percent of industry employment | Hourly mean wage | Annual mean wage (2) |
|---|---|---|---|---|
| State Government, excluding schools and hospitals (OEWS Designation) | 5,440 | 0.25 | $ 21.81 | $ 45,360 |
| Federal Executive Branch (OEWS Designation) | 3,360 | 0.16 | $ 25.03 | $ 52,050 |
| Local Government, excluding schools and hospitals (OEWS Designation) | 930 | 0.02 | $ 30.54 | $ 63,530 |
| Other Professional, Scientific, and Technical Services | 870 | 0.11 | $ 20.40 | $ 42,430 |
| Animal Slaughtering and Processing | 710 | 0.14 | $ 16.95 | $ 35,250 |
Industries with the highest concentration of employment in Agricultural Inspectors:
| Industry | Employment (1) | Percent of industry employment | Hourly mean wage | Annual mean wage (2) |
|---|---|---|---|---|
| State Government, excluding schools and hospitals (OEWS Designation) | 5,440 | 0.25 | $ 21.81 | $ 45,360 |
| Federal Executive Branch (OEWS Designation) | 3,360 | 0.16 | $ 25.03 | $ 52,050 |
| Animal Slaughtering and Processing | 710 | 0.14 | $ 16.95 | $ 35,250 |
| Grain and Oilseed Milling | 70 | 0.12 | $ 25.50 | $ 53,040 |
| Fruit and Vegetable Preserving and Specialty Food Manufacturing | 210 | 0.12 | $ 15.66 | $ 32,570 |
Top paying industries for Agricultural Inspectors:
| Industry | Employment (1) | Percent of industry employment | Hourly mean wage | Annual mean wage (2) |
|---|---|---|---|---|
| Local Government, excluding schools and hospitals (OEWS Designation) | 930 | 0.02 | $ 30.54 | $ 63,530 |
| Management, Scientific, and Technical Consulting Services | 150 | 0.01 | $ 28.49 | $ 59,260 |
| Architectural, Engineering, and Related Services | 40 | (7) | $ 26.73 | $ 55,610 |
| Grain and Oilseed Milling | 70 | 0.12 | $ 25.50 | $ 53,040 |
| Federal Executive Branch (OEWS Designation) | 3,360 | 0.16 | $ 25.03 | $ 52,050 |
States and areas with the highest published employment, location quotients, and wages for Agricultural Inspectors are provided. For a list of all areas with employment in Agricultural Inspectors, see the Create Customized Tables function.
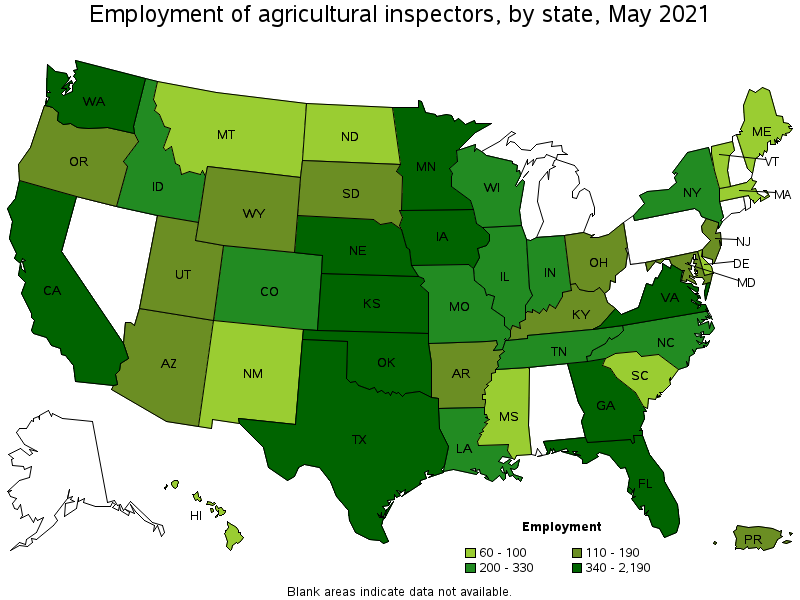
States with the highest employment level in Agricultural Inspectors:
| State | Employment (1) | Employment per thousand jobs | Location quotient (9) | Hourly mean wage | Annual mean wage (2) |
|---|---|---|---|---|---|
| California | 2,190 | 0.13 | 1.37 | $ 24.97 | $ 51,930 |
| Florida | 950 | 0.11 | 1.15 | $ 18.52 | $ 38,520 |
| Texas | 780 | 0.06 | 0.66 | $ 22.29 | $ 46,360 |
| Georgia | 720 | 0.16 | 1.70 | $ 18.32 | $ 38,110 |
| Washington | 590 | 0.18 | 1.90 | $ 24.28 | $ 50,500 |
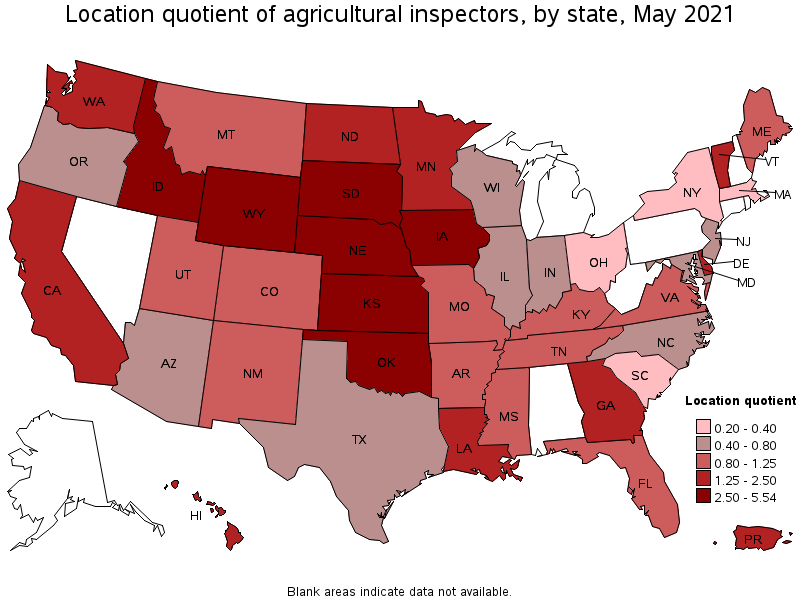
States with the highest concentration of jobs and location quotients in Agricultural Inspectors:
| State | Employment (1) | Employment per thousand jobs | Location quotient (9) | Hourly mean wage | Annual mean wage (2) |
|---|---|---|---|---|---|
| Nebraska | 510 | 0.54 | 5.54 | $ 21.25 | $ 44,200 |
| Idaho | 330 | 0.44 | 4.54 | $ 19.04 | $ 39,590 |
| Wyoming | 110 | 0.42 | 4.32 | $ 14.29 | $ 29,710 |
| South Dakota | 160 | 0.38 | 3.90 | $ 17.69 | $ 36,800 |
| Kansas | 460 | 0.35 | 3.57 | $ 20.96 | $ 43,600 |
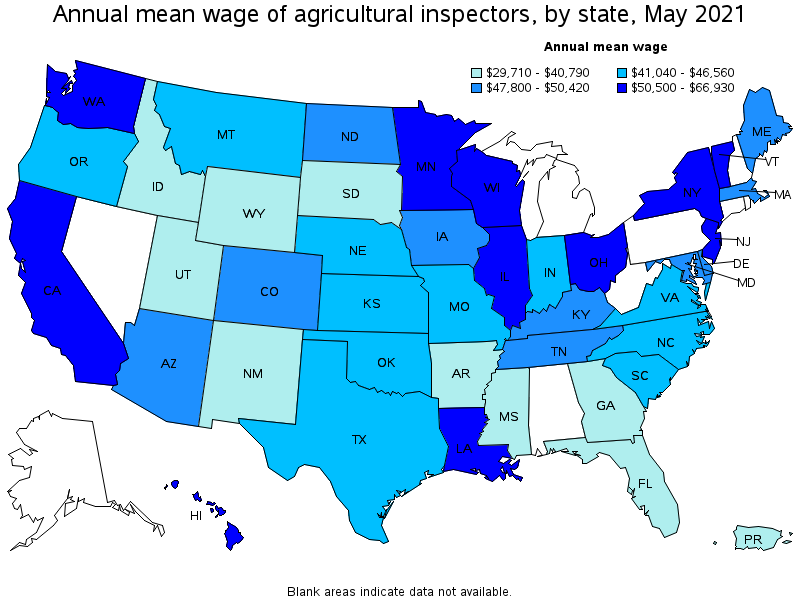
Top paying states for Agricultural Inspectors:
| State | Employment (1) | Employment per thousand jobs | Location quotient (9) | Hourly mean wage | Annual mean wage (2) |
|---|---|---|---|---|---|
| New York | 310 | 0.04 | 0.37 | $ 32.18 | $ 66,930 |
| Vermont | 60 | 0.20 | 2.09 | $ 28.56 | $ 59,410 |
| Hawaii | 80 | 0.15 | 1.56 | $ 28.13 | $ 58,510 |
| Ohio | 190 | 0.04 | 0.38 | $ 28.01 | $ 58,260 |
| New Jersey | 160 | 0.04 | 0.42 | $ 27.42 | $ 57,040 |
Metropolitan areas with the highest employment level in Agricultural Inspectors:
| Metropolitan area | Employment (1) | Employment per thousand jobs | Location quotient (9) | Hourly mean wage | Annual mean wage (2) |
|---|---|---|---|---|---|
| Los Angeles-Long Beach-Anaheim, CA | 560 | 0.10 | 1.01 | $ 28.44 | $ 59,160 |
| Fresno, CA | 260 | 0.69 | 7.11 | $ 24.36 | $ 50,670 |
| Tampa-St. Petersburg-Clearwater, FL | 250 | 0.19 | 1.98 | $ 19.49 | $ 40,550 |
| Riverside-San Bernardino-Ontario, CA | 220 | 0.15 | 1.51 | $ 20.82 | $ 43,310 |
| New York-Newark-Jersey City, NY-NJ-PA | 220 | 0.03 | 0.26 | $ 31.96 | $ 66,490 |
| Sacramento--Roseville--Arden-Arcade, CA | 210 | 0.22 | 2.25 | $ 21.30 | $ 44,300 |
| Minneapolis-St. Paul-Bloomington, MN-WI | 190 | 0.10 | 1.08 | $ 29.89 | $ 62,170 |
| Atlanta-Sandy Springs-Roswell, GA | 180 | 0.07 | 0.74 | $ 19.57 | $ 40,700 |
| Kennewick-Richland, WA | 180 | 1.51 | 15.64 | $ 18.29 | $ 38,030 |
| Miami-Fort Lauderdale-West Palm Beach, FL | 180 | 0.07 | 0.75 | $ 18.19 | $ 37,830 |
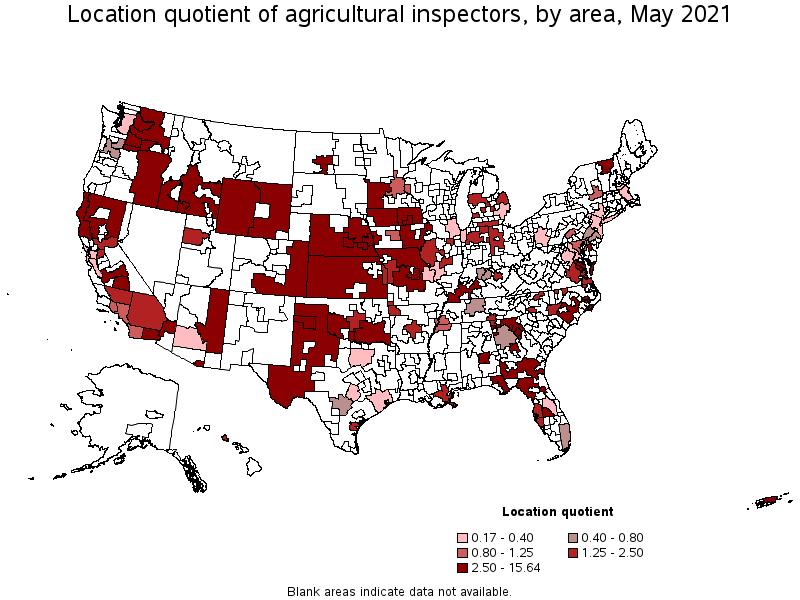
Metropolitan areas with the highest concentration of jobs and location quotients in Agricultural Inspectors:
| Metropolitan area | Employment (1) | Employment per thousand jobs | Location quotient (9) | Hourly mean wage | Annual mean wage (2) |
|---|---|---|---|---|---|
| Kennewick-Richland, WA | 180 | 1.51 | 15.64 | $ 18.29 | $ 38,030 |
| Yakima, WA | 140 | 1.51 | 15.61 | $ 27.29 | $ 56,770 |
| Grand Island, NE | 40 | 1.03 | 10.68 | $ 23.64 | $ 49,170 |
| Twin Falls, ID | 50 | 1.02 | 10.53 | $ 19.42 | $ 40,400 |
| Wenatchee, WA | 50 | 1.01 | 10.41 | $ 27.75 | $ 57,720 |
| Bismarck, ND | 60 | 0.87 | 8.98 | $ 22.77 | $ 47,360 |
| Gainesville, GA | 70 | 0.77 | 7.96 | $ 17.52 | $ 36,440 |
| El Centro, CA | 40 | 0.76 | 7.84 | $ 22.05 | $ 45,860 |
| Fresno, CA | 260 | 0.69 | 7.11 | $ 24.36 | $ 50,670 |
| Jefferson City, MO | 40 | 0.61 | 6.26 | $ 20.93 | $ 43,540 |
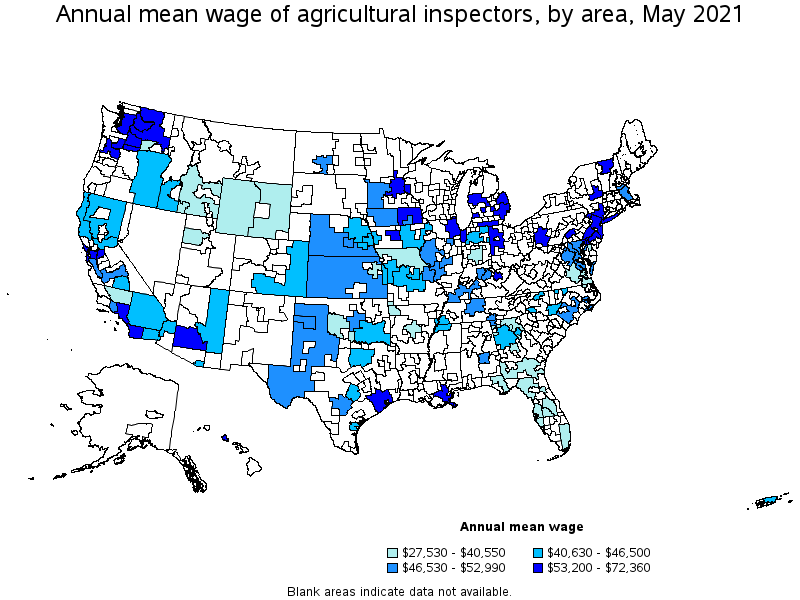
Top paying metropolitan areas for Agricultural Inspectors:
| Metropolitan area | Employment (1) | Employment per thousand jobs | Location quotient (9) | Hourly mean wage | Annual mean wage (2) |
|---|---|---|---|---|---|
| Albany-Schenectady-Troy, NY | 40 | 0.10 | 1.01 | $ 34.79 | $ 72,360 |
| Detroit-Warren-Dearborn, MI | 40 | 0.02 | 0.22 | $ 33.90 | $ 70,510 |
| New York-Newark-Jersey City, NY-NJ-PA | 220 | 0.03 | 0.26 | $ 31.96 | $ 66,490 |
| San Diego-Carlsbad, CA | 130 | 0.09 | 0.98 | $ 31.14 | $ 64,780 |
| San Francisco-Oakland-Hayward, CA | 80 | 0.03 | 0.35 | $ 30.67 | $ 63,790 |
| Stockton-Lodi, CA | 50 | 0.18 | 1.91 | $ 30.54 | $ 63,530 |
| Minneapolis-St. Paul-Bloomington, MN-WI | 190 | 0.10 | 1.08 | $ 29.89 | $ 62,170 |
| Seattle-Tacoma-Bellevue, WA | 60 | 0.03 | 0.31 | $ 29.19 | $ 60,700 |
| Urban Honolulu, HI | 50 | 0.13 | 1.31 | $ 28.71 | $ 59,710 |
| Chicago-Naperville-Elgin, IL-IN-WI | 70 | 0.02 | 0.17 | $ 28.70 | $ 59,700 |
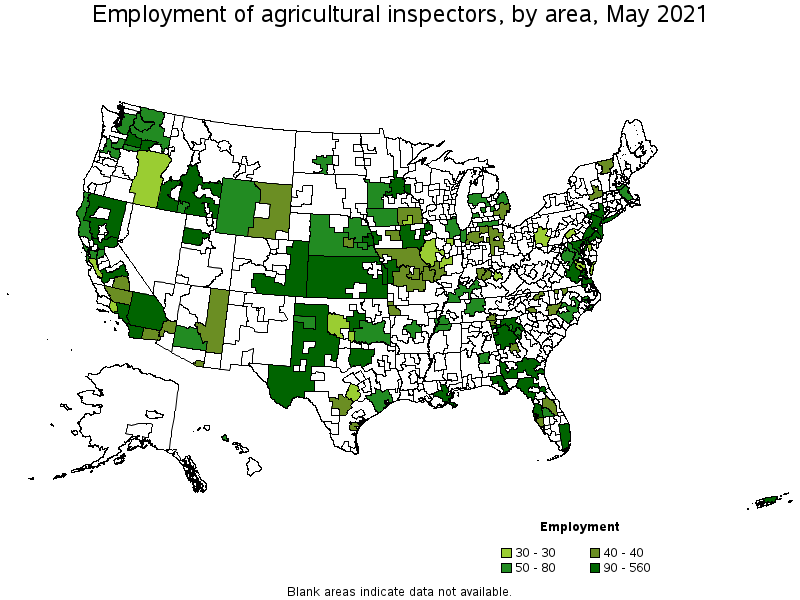
Nonmetropolitan areas with the highest employment in Agricultural Inspectors:
| Nonmetropolitan area | Employment (1) | Employment per thousand jobs | Location quotient (9) | Hourly mean wage | Annual mean wage (2) |
|---|---|---|---|---|---|
| Kansas nonmetropolitan area | 220 | 0.58 | 6.03 | $ 22.57 | $ 46,940 |
| West Texas Region of Texas nonmetropolitan area | 130 | 0.73 | 7.51 | $ 22.37 | $ 46,530 |
| North Georgia nonmetropolitan area | 120 | 0.71 | 7.37 | $ 16.10 | $ 33,480 |
| North Valley-Northern Mountains Region of California nonmetropolitan area | 120 | 1.21 | 12.48 | $ 21.11 | $ 43,910 |
| South Georgia nonmetropolitan area | 120 | 0.63 | 6.53 | $ 16.72 | $ 34,780 |
Nonmetropolitan areas with the highest concentration of jobs and location quotients in Agricultural Inspectors:
| Nonmetropolitan area | Employment (1) | Employment per thousand jobs | Location quotient (9) | Hourly mean wage | Annual mean wage (2) |
|---|---|---|---|---|---|
| Eastern and Southern Colorado nonmetropolitan area | 100 | 1.43 | 14.74 | $ 21.44 | $ 44,590 |
| North Valley-Northern Mountains Region of California nonmetropolitan area | 120 | 1.21 | 12.48 | $ 21.11 | $ 43,910 |
| Southeast-Central Idaho nonmetropolitan area | 90 | 1.10 | 11.34 | $ 16.78 | $ 34,890 |
| North Florida nonmetropolitan area | 100 | 0.83 | 8.56 | $ 14.69 | $ 30,550 |
| West Texas Region of Texas nonmetropolitan area | 130 | 0.73 | 7.51 | $ 22.37 | $ 46,530 |
Top paying nonmetropolitan areas for Agricultural Inspectors:
| Nonmetropolitan area | Employment (1) | Employment per thousand jobs | Location quotient (9) | Hourly mean wage | Annual mean wage (2) |
|---|---|---|---|---|---|
| Northern Vermont nonmetropolitan area | 40 | 0.61 | 6.32 | $ 30.36 | $ 63,140 |
| Balance of Lower Peninsula of Michigan nonmetropolitan area | 60 | 0.24 | 2.49 | $ 29.50 | $ 61,360 |
| West Northwestern Ohio nonmetropolitan area | 40 | 0.16 | 1.68 | $ 27.40 | $ 57,000 |
| Eastern Washington nonmetropolitan area | 50 | 0.57 | 5.86 | $ 25.82 | $ 53,700 |
| Northeast Iowa nonmetropolitan area | 40 | 0.44 | 4.54 | $ 25.58 | $ 53,200 |
These estimates are calculated with data collected from employers in all industry sectors, all metropolitan and nonmetropolitan areas, and all states and the District of Columbia. The top employment and wage figures are provided above. The complete list is available in the downloadable XLS files.
The percentile wage estimate is the value of a wage below which a certain percent of workers fall. The median wage is the 50th percentile wage estimate—50 percent of workers earn less than the median and 50 percent of workers earn more than the median. More about percentile wages.
(1) Estimates for detailed occupations do not sum to the totals because the totals include occupations not shown separately. Estimates do not include self-employed workers.
(2) Annual wages have been calculated by multiplying the hourly mean wage by a "year-round, full-time" hours figure of 2,080 hours; for those occupations where there is not an hourly wage published, the annual wage has been directly calculated from the reported survey data.
(3) The relative standard error (RSE) is a measure of the reliability of a survey statistic. The smaller the relative standard error, the more precise the estimate.
(7) The value is less than .005 percent of industry employment.
(9) The location quotient is the ratio of the area concentration of occupational employment to the national average concentration. A location quotient greater than one indicates the occupation has a higher share of employment than average, and a location quotient less than one indicates the occupation is less prevalent in the area than average.
Other OEWS estimates and related information:
May 2021 National Occupational Employment and Wage Estimates
May 2021 State Occupational Employment and Wage Estimates
May 2021 Metropolitan and Nonmetropolitan Area Occupational Employment and Wage Estimates
May 2021 National Industry-Specific Occupational Employment and Wage Estimates
Last Modified Date: March 31, 2022