
An official website of the United States government
An official website of the United States government
The .gov means it's official.
Federal government websites often end in .gov or .mil. Before sharing sensitive information,
make sure you're on a federal government site.
The site is secure.
The
https:// ensures that you are connecting to the official website and that any
information you provide is encrypted and transmitted securely.
Manually plant, cultivate, and harvest vegetables, fruits, nuts, horticultural specialties, and field crops. Use hand tools, such as shovels, trowels, hoes, tampers, pruning hooks, shears, and knives. Duties may include tilling soil and applying fertilizers; transplanting, weeding, thinning, or pruning crops; applying pesticides; or cleaning, grading, sorting, packing, and loading harvested products. May construct trellises, repair fences and farm buildings, or participate in irrigation activities. Excludes �Pesticide Handlers, Sprayers, and Applicators, Vegetation� (37-3012), �Graders and Sorters, Agricultural Products� (45-2041), and �Forest, Conservation, and Logging Workers� (45-4011 through 45-4029).
Employment estimate and mean wage estimates for Farmworkers and Laborers, Crop, Nursery, and Greenhouse:
| Employment (1) | Employment RSE (3) |
Mean hourly wage |
Mean annual wage (2) |
Wage RSE (3) |
|---|---|---|---|---|
| 277,200 | 1.0 % | $ 15.11 | $ 31,440 | 0.7 % |
Percentile wage estimates for Farmworkers and Laborers, Crop, Nursery, and Greenhouse:
| Percentile | 10% | 25% | 50% (Median) |
75% | 90% |
|---|---|---|---|---|---|
| Hourly Wage | $ 13.57 | $ 14.00 | $ 14.25 | $ 15.06 | $ 17.92 |
| Annual Wage (2) | $ 28,230 | $ 29,120 | $ 29,630 | $ 31,320 | $ 37,280 |
Industries with the highest published employment and wages for Farmworkers and Laborers, Crop, Nursery, and Greenhouse are provided. For a list of all industries with employment in Farmworkers and Laborers, Crop, Nursery, and Greenhouse, see the Create Customized Tables function.
Industries with the highest levels of employment in Farmworkers and Laborers, Crop, Nursery, and Greenhouse:
| Industry | Employment (1) | Percent of industry employment | Hourly mean wage | Annual mean wage (2) |
|---|---|---|---|---|
| Support Activities for Crop Production | 210,000 | 62.58 | $ 14.98 | $ 31,150 |
| Lawn and Garden Equipment and Supplies Stores | 14,630 | 8.04 | $ 14.66 | $ 30,500 |
| Merchant Wholesalers, Nondurable Goods (4241, 4247, and 4249 only) | 14,350 | 2.74 | $ 14.96 | $ 31,110 |
| Beverage Manufacturing | 5,870 | 2.09 | $ 17.09 | $ 35,550 |
| Employment Services | 4,790 | 0.14 | $ 14.96 | $ 31,110 |
Industries with the highest concentration of employment in Farmworkers and Laborers, Crop, Nursery, and Greenhouse:
| Industry | Employment (1) | Percent of industry employment | Hourly mean wage | Annual mean wage (2) |
|---|---|---|---|---|
| Support Activities for Crop Production | 210,000 | 62.58 | $ 14.98 | $ 31,150 |
| Lawn and Garden Equipment and Supplies Stores | 14,630 | 8.04 | $ 14.66 | $ 30,500 |
| Merchant Wholesalers, Nondurable Goods (4241, 4247, and 4249 only) | 14,350 | 2.74 | $ 14.96 | $ 31,110 |
| Farm Product Raw Material Merchant Wholesalers | 1,520 | 2.23 | $ 16.75 | $ 34,830 |
| Beverage Manufacturing | 5,870 | 2.09 | $ 17.09 | $ 35,550 |
Top paying industries for Farmworkers and Laborers, Crop, Nursery, and Greenhouse:
| Industry | Employment (1) | Percent of industry employment | Hourly mean wage | Annual mean wage (2) |
|---|---|---|---|---|
| Elementary and Secondary Schools | 70 | (7) | $ 22.21 | $ 46,190 |
| Residential Building Construction | (8) | (8) | $ 20.42 | $ 42,470 |
| Grain and Oilseed Milling | 180 | 0.28 | $ 19.97 | $ 41,550 |
| Water, Sewage and Other Systems | 100 | 0.19 | $ 19.88 | $ 41,350 |
| Colleges, Universities, and Professional Schools | 640 | 0.02 | $ 19.66 | $ 40,900 |
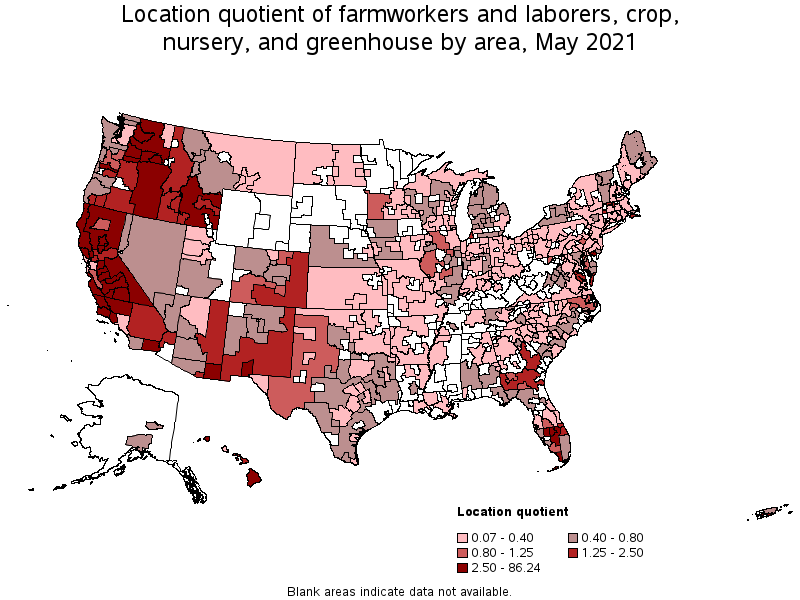
States and areas with the highest published employment, location quotients, and wages for Farmworkers and Laborers, Crop, Nursery, and Greenhouse are provided. For a list of all areas with employment in Farmworkers and Laborers, Crop, Nursery, and Greenhouse, see the Create Customized Tables function.
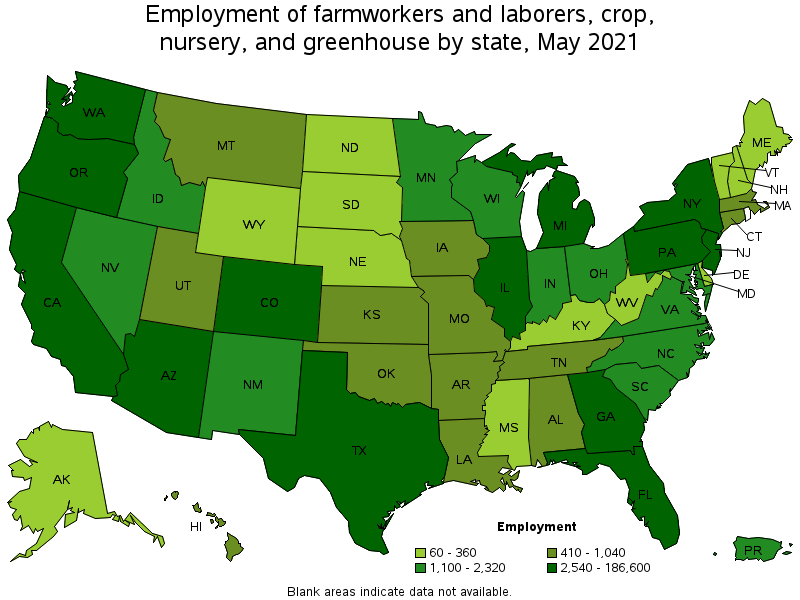
States with the highest employment level in Farmworkers and Laborers, Crop, Nursery, and Greenhouse:
| State | Employment (1) | Employment per thousand jobs | Location quotient (9) | Hourly mean wage | Annual mean wage (2) |
|---|---|---|---|---|---|
| California | 186,600 | 11.29 | 5.74 | $ 15.28 | $ 31,770 |
| Washington | 9,570 | 2.99 | 1.52 | $ 15.92 | $ 33,120 |
| Florida | 9,080 | 1.05 | 0.54 | $ 12.66 | $ 26,320 |
| Arizona | 8,590 | 2.98 | 1.52 | $ 14.76 | $ 30,700 |
| Oregon | 6,880 | 3.77 | 1.91 | $ 14.84 | $ 30,870 |
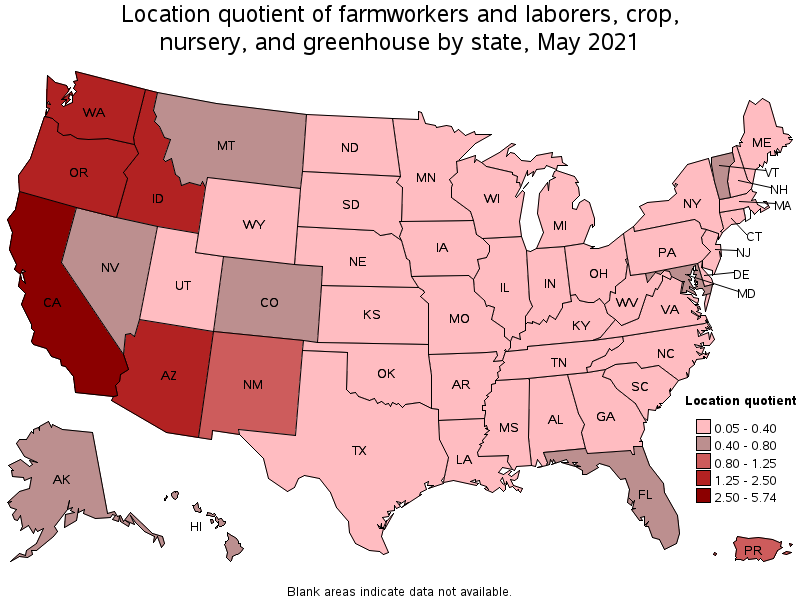
States with the highest concentration of jobs and location quotients in Farmworkers and Laborers, Crop, Nursery, and Greenhouse:
| State | Employment (1) | Employment per thousand jobs | Location quotient (9) | Hourly mean wage | Annual mean wage (2) |
|---|---|---|---|---|---|
| California | 186,600 | 11.29 | 5.74 | $ 15.28 | $ 31,770 |
| Oregon | 6,880 | 3.77 | 1.91 | $ 14.84 | $ 30,870 |
| Idaho | 2,320 | 3.06 | 1.56 | $ 14.30 | $ 29,740 |
| Washington | 9,570 | 2.99 | 1.52 | $ 15.92 | $ 33,120 |
| Arizona | 8,590 | 2.98 | 1.52 | $ 14.76 | $ 30,700 |
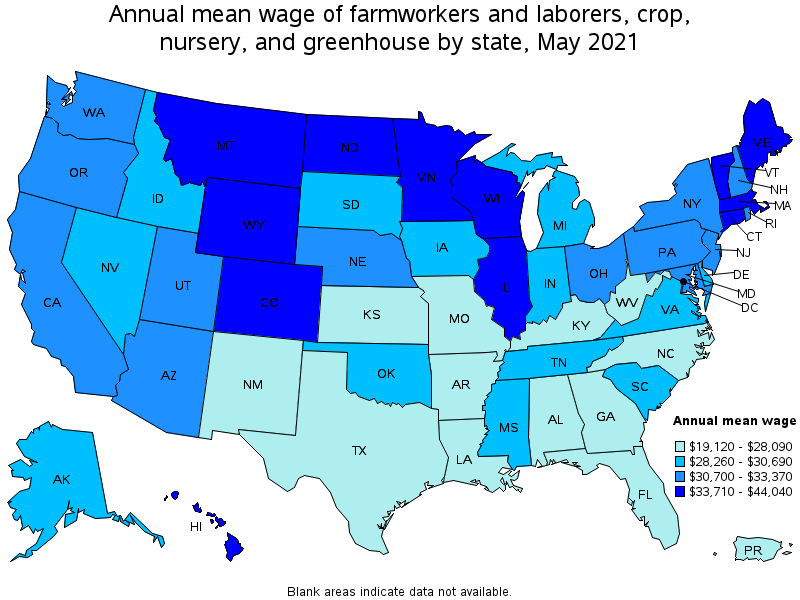
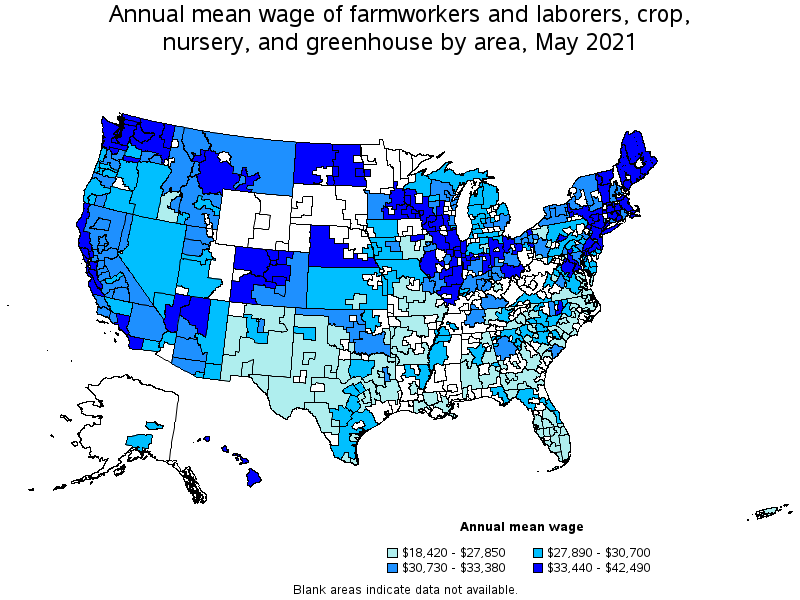
Top paying states for Farmworkers and Laborers, Crop, Nursery, and Greenhouse:
| State | Employment (1) | Employment per thousand jobs | Location quotient (9) | Hourly mean wage | Annual mean wage (2) |
|---|---|---|---|---|---|
| District of Columbia | (8) | (8) | (8) | $ 21.17 | $ 44,040 |
| Hawaii | 850 | 1.55 | 0.79 | $ 18.12 | $ 37,700 |
| North Dakota | 160 | 0.41 | 0.21 | $ 17.62 | $ 36,640 |
| Massachusetts | 1,040 | 0.31 | 0.16 | $ 17.53 | $ 36,470 |
| Vermont | 310 | 1.08 | 0.55 | $ 17.46 | $ 36,320 |
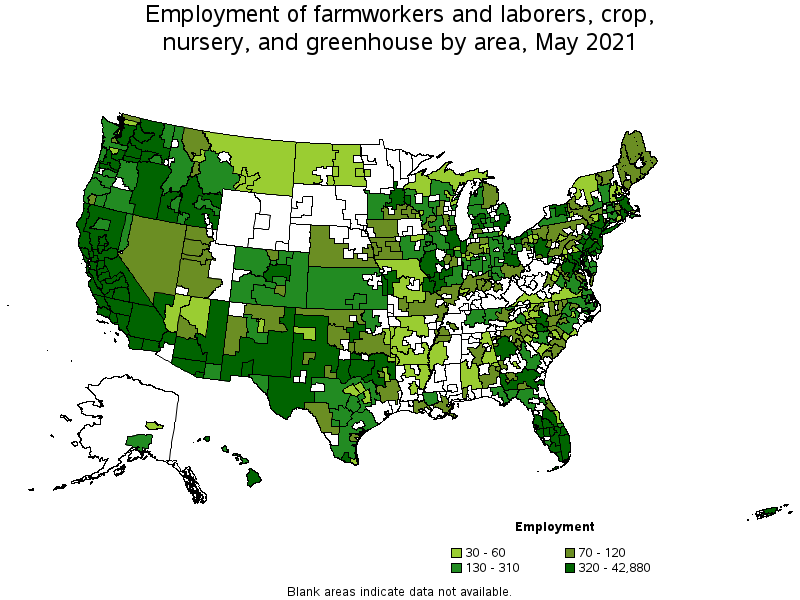
Metropolitan areas with the highest employment level in Farmworkers and Laborers, Crop, Nursery, and Greenhouse:
| Metropolitan area | Employment (1) | Employment per thousand jobs | Location quotient (9) | Hourly mean wage | Annual mean wage (2) |
|---|---|---|---|---|---|
| Bakersfield, CA | 42,880 | 138.05 | 70.16 | $ 14.45 | $ 30,050 |
| Salinas, CA | 28,690 | 169.67 | 86.24 | $ 16.13 | $ 33,550 |
| Fresno, CA | 19,910 | 53.08 | 26.98 | $ 14.83 | $ 30,840 |
| Visalia-Porterville, CA | 19,080 | 127.57 | 64.84 | $ 14.78 | $ 30,730 |
| Santa Maria-Santa Barbara, CA | 9,990 | 51.41 | 26.13 | $ 15.55 | $ 32,340 |
| Madera, CA | 6,710 | 140.42 | 71.37 | $ 14.53 | $ 30,220 |
| Stockton-Lodi, CA | 5,720 | 22.30 | 11.33 | $ 15.56 | $ 32,370 |
| Modesto, CA | 5,580 | 30.85 | 15.68 | $ 14.85 | $ 30,880 |
| Riverside-San Bernardino-Ontario, CA | 5,460 | 3.57 | 1.81 | $ 15.09 | $ 31,380 |
| El Centro, CA | 5,050 | 86.05 | 43.74 | $ 14.68 | $ 30,530 |
Metropolitan areas with the highest concentration of jobs and location quotients in Farmworkers and Laborers, Crop, Nursery, and Greenhouse:
| Metropolitan area | Employment (1) | Employment per thousand jobs | Location quotient (9) | Hourly mean wage | Annual mean wage (2) |
|---|---|---|---|---|---|
| Salinas, CA | 28,690 | 169.67 | 86.24 | $ 16.13 | $ 33,550 |
| Madera, CA | 6,710 | 140.42 | 71.37 | $ 14.53 | $ 30,220 |
| Bakersfield, CA | 42,880 | 138.05 | 70.16 | $ 14.45 | $ 30,050 |
| Visalia-Porterville, CA | 19,080 | 127.57 | 64.84 | $ 14.78 | $ 30,730 |
| El Centro, CA | 5,050 | 86.05 | 43.74 | $ 14.68 | $ 30,530 |
| Merced, CA | 4,990 | 69.40 | 35.27 | $ 14.83 | $ 30,840 |
| Hanford-Corcoran, CA | 2,510 | 58.76 | 29.87 | $ 15.14 | $ 31,500 |
| Fresno, CA | 19,910 | 53.08 | 26.98 | $ 14.83 | $ 30,840 |
| Santa Maria-Santa Barbara, CA | 9,990 | 51.41 | 26.13 | $ 15.55 | $ 32,340 |
| Napa, CA | 2,870 | 41.61 | 21.15 | $ 18.54 | $ 38,560 |
Top paying metropolitan areas for Farmworkers and Laborers, Crop, Nursery, and Greenhouse:
| Metropolitan area | Employment (1) | Employment per thousand jobs | Location quotient (9) | Hourly mean wage | Annual mean wage (2) |
|---|---|---|---|---|---|
| San Francisco-Oakland-Hayward, CA | 1,290 | 0.57 | 0.29 | $ 20.43 | $ 42,490 |
| Urban Honolulu, HI | 220 | 0.56 | 0.29 | $ 19.50 | $ 40,560 |
| Ithaca, NY | 40 | 0.93 | 0.47 | $ 19.03 | $ 39,570 |
| Boulder, CO | 160 | 0.86 | 0.44 | $ 18.65 | $ 38,790 |
| Seattle-Tacoma-Bellevue, WA | 920 | 0.48 | 0.24 | $ 18.57 | $ 38,630 |
| Champaign-Urbana, IL | 90 | 0.95 | 0.48 | $ 18.57 | $ 38,620 |
| Napa, CA | 2,870 | 41.61 | 21.15 | $ 18.54 | $ 38,560 |
| Portland-South Portland, ME | 90 | 0.43 | 0.22 | $ 18.50 | $ 38,480 |
| San Jose-Sunnyvale-Santa Clara, CA | 1,960 | 1.84 | 0.93 | $ 18.49 | $ 38,450 |
| Billings, MT | 50 | 0.59 | 0.30 | $ 18.30 | $ 38,070 |
Nonmetropolitan areas with the highest employment in Farmworkers and Laborers, Crop, Nursery, and Greenhouse:
| Nonmetropolitan area | Employment (1) | Employment per thousand jobs | Location quotient (9) | Hourly mean wage | Annual mean wage (2) |
|---|---|---|---|---|---|
| North Valley-Northern Mountains Region of California nonmetropolitan area | 2,050 | 20.91 | 10.63 | $ 15.58 | $ 32,400 |
| Eastern Washington nonmetropolitan area | 2,010 | 21.32 | 10.84 | $ 16.20 | $ 33,700 |
| North Coast Region of California nonmetropolitan area | 1,240 | 12.37 | 6.28 | $ 16.23 | $ 33,760 |
| South Florida nonmetropolitan area | 1,070 | 14.14 | 7.19 | $ 12.48 | $ 25,960 |
| Eastern Oregon nonmetropolitan area | 1,030 | 14.77 | 7.50 | $ 14.11 | $ 29,350 |
Nonmetropolitan areas with the highest concentration of jobs and location quotients in Farmworkers and Laborers, Crop, Nursery, and Greenhouse:
| Nonmetropolitan area | Employment (1) | Employment per thousand jobs | Location quotient (9) | Hourly mean wage | Annual mean wage (2) |
|---|---|---|---|---|---|
| Eastern Washington nonmetropolitan area | 2,010 | 21.32 | 10.84 | $ 16.20 | $ 33,700 |
| North Valley-Northern Mountains Region of California nonmetropolitan area | 2,050 | 20.91 | 10.63 | $ 15.58 | $ 32,400 |
| Eastern Oregon nonmetropolitan area | 1,030 | 14.77 | 7.50 | $ 14.11 | $ 29,350 |
| South Florida nonmetropolitan area | 1,070 | 14.14 | 7.19 | $ 12.48 | $ 25,960 |
| North Coast Region of California nonmetropolitan area | 1,240 | 12.37 | 6.28 | $ 16.23 | $ 33,760 |
Top paying nonmetropolitan areas for Farmworkers and Laborers, Crop, Nursery, and Greenhouse:
| Nonmetropolitan area | Employment (1) | Employment per thousand jobs | Location quotient (9) | Hourly mean wage | Annual mean wage (2) |
|---|---|---|---|---|---|
| East Central Illinois nonmetropolitan area | 170 | 1.51 | 0.77 | $ 19.29 | $ 40,120 |
| Massachusetts nonmetropolitan area | 140 | 2.47 | 1.26 | $ 19.08 | $ 39,690 |
| West Central Illinois nonmetropolitan area | 350 | 2.24 | 1.14 | $ 18.87 | $ 39,240 |
| Northwest Colorado nonmetropolitan area | 170 | 1.42 | 0.72 | $ 18.53 | $ 38,530 |
| East North Dakota nonmetropolitan area | 40 | 0.58 | 0.29 | $ 18.12 | $ 37,680 |
These estimates are calculated with data collected from employers in all industry sectors, all metropolitan and nonmetropolitan areas, and all states and the District of Columbia. The top employment and wage figures are provided above. The complete list is available in the downloadable XLS files.
The percentile wage estimate is the value of a wage below which a certain percent of workers fall. The median wage is the 50th percentile wage estimate—50 percent of workers earn less than the median and 50 percent of workers earn more than the median. More about percentile wages.
(1) Estimates for detailed occupations do not sum to the totals because the totals include occupations not shown separately. Estimates do not include self-employed workers.
(2) Annual wages have been calculated by multiplying the hourly mean wage by a "year-round, full-time" hours figure of 2,080 hours; for those occupations where there is not an hourly wage published, the annual wage has been directly calculated from the reported survey data.
(3) The relative standard error (RSE) is a measure of the reliability of a survey statistic. The smaller the relative standard error, the more precise the estimate.
(7) The value is less than .005 percent of industry employment.
(8) Estimate not released.
(9) The location quotient is the ratio of the area concentration of occupational employment to the national average concentration. A location quotient greater than one indicates the occupation has a higher share of employment than average, and a location quotient less than one indicates the occupation is less prevalent in the area than average.
Other OEWS estimates and related information:
May 2021 National Occupational Employment and Wage Estimates
May 2021 State Occupational Employment and Wage Estimates
May 2021 Metropolitan and Nonmetropolitan Area Occupational Employment and Wage Estimates
May 2021 National Industry-Specific Occupational Employment and Wage Estimates
Last Modified Date: March 31, 2022