
An official website of the United States government
An official website of the United States government
The .gov means it's official.
Federal government websites often end in .gov or .mil. Before sharing sensitive information,
make sure you're on a federal government site.
The site is secure.
The
https:// ensures that you are connecting to the official website and that any
information you provide is encrypted and transmitted securely.
Under supervision, perform manual labor necessary to develop, maintain, or protect areas such as forests, forested areas, woodlands, wetlands, and rangelands through such activities as raising and transporting seedlings; combating insects, pests, and diseases harmful to plant life; and building structures to control water, erosion, and leaching of soil. Includes forester aides, seedling pullers, tree planters, and gatherers of nontimber forestry products such as pine straw.
Employment estimate and mean wage estimates for Forest and Conservation Workers:
| Employment (1) | Employment RSE (3) |
Mean hourly wage |
Mean annual wage (2) |
Wage RSE (3) |
|---|---|---|---|---|
| 6,300 | 12.1 % | $ 16.20 | $ 33,690 | 1.6 % |
Percentile wage estimates for Forest and Conservation Workers:
| Percentile | 10% | 25% | 50% (Median) |
75% | 90% |
|---|---|---|---|---|---|
| Hourly Wage | $ 12.43 | $ 14.19 | $ 14.69 | $ 17.71 | $ 22.64 |
| Annual Wage (2) | $ 25,850 | $ 29,510 | $ 30,550 | $ 36,830 | $ 47,090 |
Industries with the highest published employment and wages for Forest and Conservation Workers are provided. For a list of all industries with employment in Forest and Conservation Workers, see the Create Customized Tables function.
Industries with the highest levels of employment in Forest and Conservation Workers:
| Industry | Employment (1) | Percent of industry employment | Hourly mean wage | Annual mean wage (2) |
|---|---|---|---|---|
| State Government, excluding schools and hospitals (OEWS Designation) | 2,820 | 0.13 | $ 15.92 | $ 33,110 |
| Local Government, excluding schools and hospitals (OEWS Designation) | 1,080 | 0.02 | $ 15.87 | $ 33,010 |
| Social Advocacy Organizations | 650 | 0.29 | $ 18.28 | $ 38,020 |
| Management, Scientific, and Technical Consulting Services | 70 | 0.00 | $ 17.63 | $ 36,660 |
| Logging | 60 | 0.12 | $ 19.17 | $ 39,870 |
Industries with the highest concentration of employment in Forest and Conservation Workers:
| Industry | Employment (1) | Percent of industry employment | Hourly mean wage | Annual mean wage (2) |
|---|---|---|---|---|
| Social Advocacy Organizations | 650 | 0.29 | $ 18.28 | $ 38,020 |
| State Government, excluding schools and hospitals (OEWS Designation) | 2,820 | 0.13 | $ 15.92 | $ 33,110 |
| Logging | 60 | 0.12 | $ 19.17 | $ 39,870 |
| Museums, Historical Sites, and Similar Institutions | 50 | 0.04 | $ 16.21 | $ 33,720 |
| Local Government, excluding schools and hospitals (OEWS Designation) | 1,080 | 0.02 | $ 15.87 | $ 33,010 |
Top paying industries for Forest and Conservation Workers:
| Industry | Employment (1) | Percent of industry employment | Hourly mean wage | Annual mean wage (2) |
|---|---|---|---|---|
| Electric Power Generation, Transmission and Distribution | (8) | (8) | $ 22.39 | $ 46,560 |
| Services to Buildings and Dwellings | 50 | (7) | $ 20.38 | $ 42,390 |
| Logging | 60 | 0.12 | $ 19.17 | $ 39,870 |
| Social Advocacy Organizations | 650 | 0.29 | $ 18.28 | $ 38,020 |
| Management, Scientific, and Technical Consulting Services | 70 | (7) | $ 17.63 | $ 36,660 |
States and areas with the highest published employment, location quotients, and wages for Forest and Conservation Workers are provided. For a list of all areas with employment in Forest and Conservation Workers, see the Create Customized Tables function.
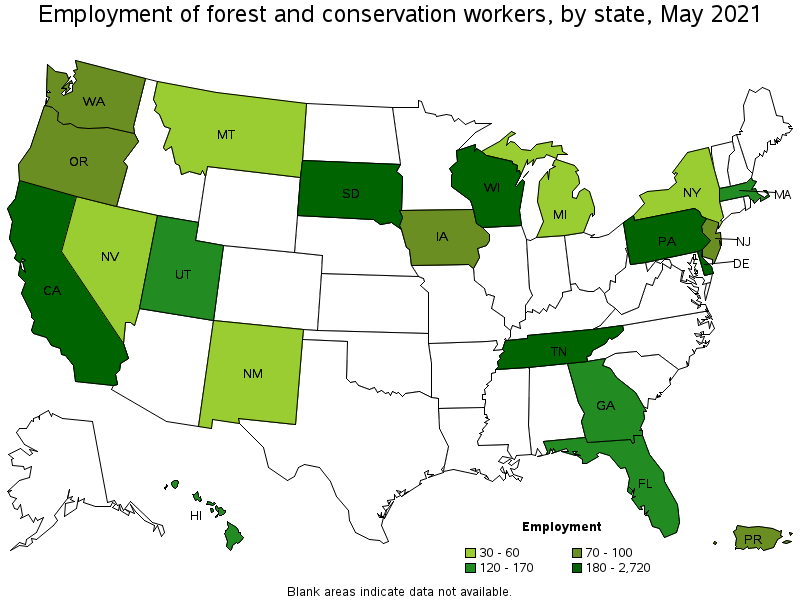
States with the highest employment level in Forest and Conservation Workers:
| State | Employment (1) | Employment per thousand jobs | Location quotient (9) | Hourly mean wage | Annual mean wage (2) |
|---|---|---|---|---|---|
| California | 2,720 | 0.16 | 3.68 | $ 15.15 | $ 31,520 |
| South Dakota | 450 | 1.06 | 23.77 | $ 14.70 | $ 30,570 |
| Tennessee | 270 | 0.09 | 2.00 | $ 13.06 | $ 27,160 |
| Delaware | 240 | 0.55 | 12.26 | $ 16.87 | $ 35,080 |
| Wisconsin | 190 | 0.07 | 1.52 | $ 12.48 | $ 25,950 |
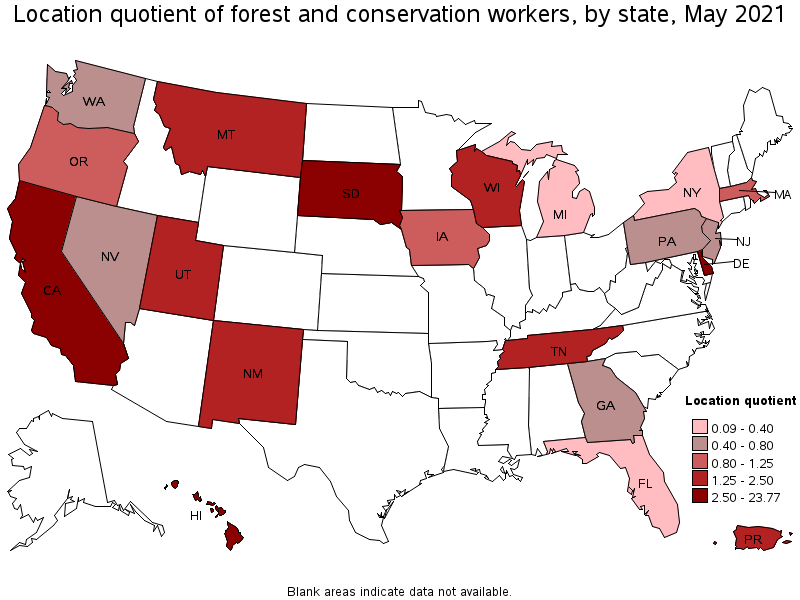
States with the highest concentration of jobs and location quotients in Forest and Conservation Workers:
| State | Employment (1) | Employment per thousand jobs | Location quotient (9) | Hourly mean wage | Annual mean wage (2) |
|---|---|---|---|---|---|
| South Dakota | 450 | 1.06 | 23.77 | $ 14.70 | $ 30,570 |
| Delaware | 240 | 0.55 | 12.26 | $ 16.87 | $ 35,080 |
| Hawaii | 170 | 0.31 | 7.01 | $ 19.23 | $ 40,000 |
| California | 2,720 | 0.16 | 3.68 | $ 15.15 | $ 31,520 |
| Utah | 160 | 0.10 | 2.30 | $ 17.24 | $ 35,860 |
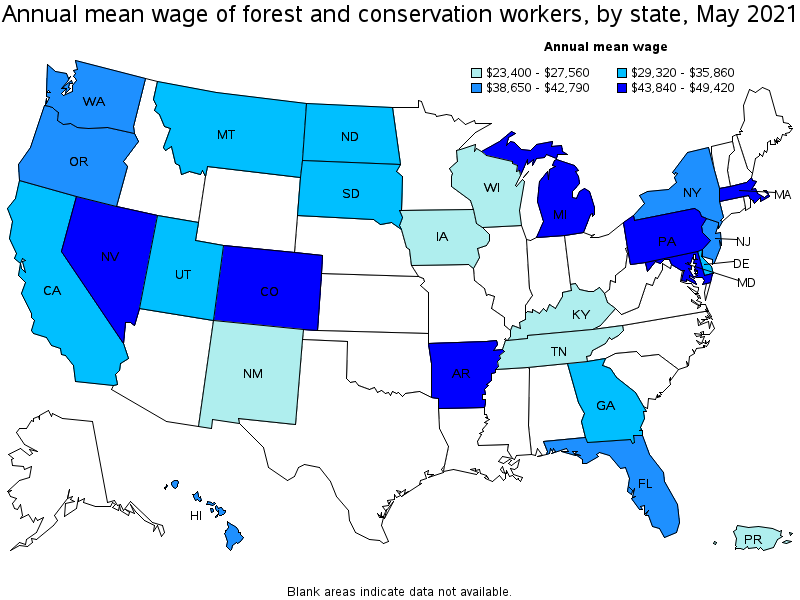
Top paying states for Forest and Conservation Workers:
| State | Employment (1) | Employment per thousand jobs | Location quotient (9) | Hourly mean wage | Annual mean wage (2) |
|---|---|---|---|---|---|
| Arkansas | (8) | (8) | (8) | $ 23.76 | $ 49,420 |
| Michigan | 60 | 0.01 | 0.31 | $ 23.56 | $ 49,010 |
| Pennsylvania | 180 | 0.03 | 0.73 | $ 23.43 | $ 48,740 |
| Maryland | (8) | (8) | (8) | $ 22.48 | $ 46,760 |
| Massachusetts | 130 | 0.04 | 0.82 | $ 21.31 | $ 44,320 |
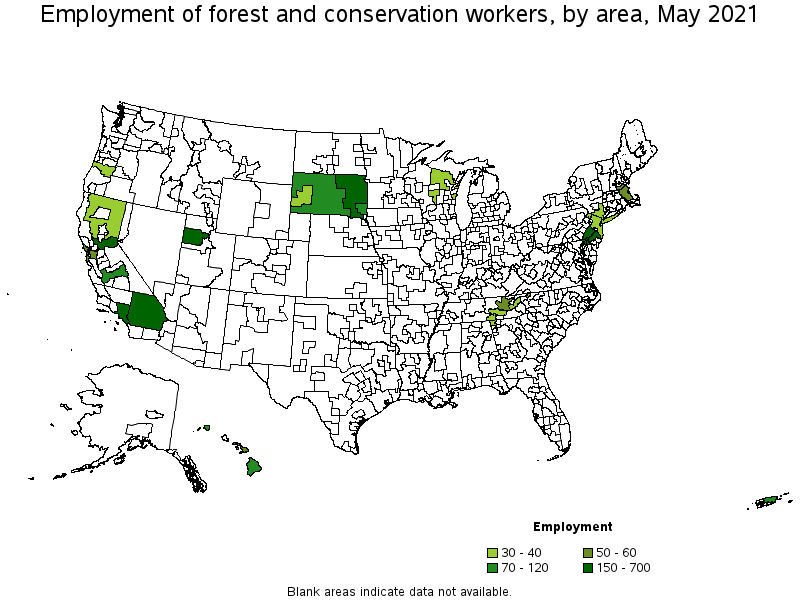
Metropolitan areas with the highest employment level in Forest and Conservation Workers:
| Metropolitan area | Employment (1) | Employment per thousand jobs | Location quotient (9) | Hourly mean wage | Annual mean wage (2) |
|---|---|---|---|---|---|
| Los Angeles-Long Beach-Anaheim, CA | 700 | 0.12 | 2.74 | $ 14.76 | $ 30,690 |
| Sacramento--Roseville--Arden-Arcade, CA | 370 | 0.38 | 8.47 | $ 15.02 | $ 31,240 |
| Riverside-San Bernardino-Ontario, CA | 210 | 0.13 | 3.00 | $ 14.82 | $ 30,820 |
| Philadelphia-Camden-Wilmington, PA-NJ-DE-MD | 150 | 0.06 | 1.26 | $ 18.33 | $ 38,130 |
| Salt Lake City, UT | 150 | 0.20 | 4.39 | $ 17.48 | $ 36,360 |
| Sioux Falls, SD | 120 | 0.76 | 17.08 | $ 14.48 | $ 30,120 |
| Fresno, CA | 80 | 0.22 | 4.94 | $ 17.66 | $ 36,730 |
| Boston-Cambridge-Nashua, MA-NH | 60 | 0.02 | 0.51 | $ 20.77 | $ 43,190 |
| San Francisco-Oakland-Hayward, CA | 60 | 0.03 | 0.58 | $ 19.91 | $ 41,400 |
| Kahului-Wailuku-Lahaina, HI | 50 | 0.78 | 17.38 | $ 19.47 | $ 40,500 |
Metropolitan areas with the highest concentration of jobs and location quotients in Forest and Conservation Workers:
| Metropolitan area | Employment (1) | Employment per thousand jobs | Location quotient (9) | Hourly mean wage | Annual mean wage (2) |
|---|---|---|---|---|---|
| Kahului-Wailuku-Lahaina, HI | 50 | 0.78 | 17.38 | $ 19.47 | $ 40,500 |
| Sioux Falls, SD | 120 | 0.76 | 17.08 | $ 14.48 | $ 30,120 |
| Rapid City, SD | 30 | 0.48 | 10.68 | $ 17.45 | $ 36,290 |
| Sacramento--Roseville--Arden-Arcade, CA | 370 | 0.38 | 8.47 | $ 15.02 | $ 31,240 |
| Eugene, OR | 40 | 0.25 | 5.70 | $ 17.97 | $ 37,370 |
| Fresno, CA | 80 | 0.22 | 4.94 | $ 17.66 | $ 36,730 |
| Salt Lake City, UT | 150 | 0.20 | 4.39 | $ 17.48 | $ 36,360 |
| Chattanooga, TN-GA | 30 | 0.14 | 3.10 | $ 11.90 | $ 24,750 |
| Riverside-San Bernardino-Ontario, CA | 210 | 0.13 | 3.00 | $ 14.82 | $ 30,820 |
| Los Angeles-Long Beach-Anaheim, CA | 700 | 0.12 | 2.74 | $ 14.76 | $ 30,690 |
Top paying metropolitan areas for Forest and Conservation Workers:
| Metropolitan area | Employment (1) | Employment per thousand jobs | Location quotient (9) | Hourly mean wage | Annual mean wage (2) |
|---|---|---|---|---|---|
| Boston-Cambridge-Nashua, MA-NH | 60 | 0.02 | 0.51 | $ 20.77 | $ 43,190 |
| San Francisco-Oakland-Hayward, CA | 60 | 0.03 | 0.58 | $ 19.91 | $ 41,400 |
| Kahului-Wailuku-Lahaina, HI | 50 | 0.78 | 17.38 | $ 19.47 | $ 40,500 |
| New York-Newark-Jersey City, NY-NJ-PA | 40 | 0.00 | 0.10 | $ 18.66 | $ 38,820 |
| Philadelphia-Camden-Wilmington, PA-NJ-DE-MD | 150 | 0.06 | 1.26 | $ 18.33 | $ 38,130 |
| Eugene, OR | 40 | 0.25 | 5.70 | $ 17.97 | $ 37,370 |
| Fresno, CA | 80 | 0.22 | 4.94 | $ 17.66 | $ 36,730 |
| Salt Lake City, UT | 150 | 0.20 | 4.39 | $ 17.48 | $ 36,360 |
| Rapid City, SD | 30 | 0.48 | 10.68 | $ 17.45 | $ 36,290 |
| San Jose-Sunnyvale-Santa Clara, CA | (8) | (8) | (8) | $ 17.26 | $ 35,910 |
Nonmetropolitan areas with the highest employment in Forest and Conservation Workers:
| Nonmetropolitan area | Employment (1) | Employment per thousand jobs | Location quotient (9) | Hourly mean wage | Annual mean wage (2) |
|---|---|---|---|---|---|
| East South Dakota nonmetropolitan area | 170 | 1.37 | 30.57 | $ 14.70 | $ 30,570 |
| West South Dakota nonmetropolitan area | 120 | 2.06 | 46.16 | $ 14.21 | $ 29,550 |
| Hawaii / Kauai nonmetropolitan area | 70 | 0.79 | 17.61 | $ 19.58 | $ 40,730 |
| North Valley-Northern Mountains Region of California nonmetropolitan area | 40 | 0.42 | 9.34 | $ 15.69 | $ 32,630 |
| East Tennessee nonmetropolitan area | 40 | 0.28 | 6.23 | $ 13.50 | $ 28,070 |
Nonmetropolitan areas with the highest concentration of jobs and location quotients in Forest and Conservation Workers:
| Nonmetropolitan area | Employment (1) | Employment per thousand jobs | Location quotient (9) | Hourly mean wage | Annual mean wage (2) |
|---|---|---|---|---|---|
| West South Dakota nonmetropolitan area | 120 | 2.06 | 46.16 | $ 14.21 | $ 29,550 |
| East South Dakota nonmetropolitan area | 170 | 1.37 | 30.57 | $ 14.70 | $ 30,570 |
| Hawaii / Kauai nonmetropolitan area | 70 | 0.79 | 17.61 | $ 19.58 | $ 40,730 |
| North Valley-Northern Mountains Region of California nonmetropolitan area | 40 | 0.42 | 9.34 | $ 15.69 | $ 32,630 |
| East Tennessee nonmetropolitan area | 40 | 0.28 | 6.23 | $ 13.50 | $ 28,070 |
Top paying nonmetropolitan areas for Forest and Conservation Workers:
| Nonmetropolitan area | Employment (1) | Employment per thousand jobs | Location quotient (9) | Hourly mean wage | Annual mean wage (2) |
|---|---|---|---|---|---|
| Hawaii / Kauai nonmetropolitan area | 70 | 0.79 | 17.61 | $ 19.58 | $ 40,730 |
| North Valley-Northern Mountains Region of California nonmetropolitan area | 40 | 0.42 | 9.34 | $ 15.69 | $ 32,630 |
| East South Dakota nonmetropolitan area | 170 | 1.37 | 30.57 | $ 14.70 | $ 30,570 |
| West South Dakota nonmetropolitan area | 120 | 2.06 | 46.16 | $ 14.21 | $ 29,550 |
| East Tennessee nonmetropolitan area | 40 | 0.28 | 6.23 | $ 13.50 | $ 28,070 |
These estimates are calculated with data collected from employers in all industry sectors, all metropolitan and nonmetropolitan areas, and all states and the District of Columbia. The top employment and wage figures are provided above. The complete list is available in the downloadable XLS files.
The percentile wage estimate is the value of a wage below which a certain percent of workers fall. The median wage is the 50th percentile wage estimate—50 percent of workers earn less than the median and 50 percent of workers earn more than the median. More about percentile wages.
(1) Estimates for detailed occupations do not sum to the totals because the totals include occupations not shown separately. Estimates do not include self-employed workers.
(2) Annual wages have been calculated by multiplying the hourly mean wage by a "year-round, full-time" hours figure of 2,080 hours; for those occupations where there is not an hourly wage published, the annual wage has been directly calculated from the reported survey data.
(3) The relative standard error (RSE) is a measure of the reliability of a survey statistic. The smaller the relative standard error, the more precise the estimate.
(7) The value is less than .005 percent of industry employment.
(8) Estimate not released.
(9) The location quotient is the ratio of the area concentration of occupational employment to the national average concentration. A location quotient greater than one indicates the occupation has a higher share of employment than average, and a location quotient less than one indicates the occupation is less prevalent in the area than average.
Other OEWS estimates and related information:
May 2021 National Occupational Employment and Wage Estimates
May 2021 State Occupational Employment and Wage Estimates
May 2021 Metropolitan and Nonmetropolitan Area Occupational Employment and Wage Estimates
May 2021 National Industry-Specific Occupational Employment and Wage Estimates
Last Modified Date: March 31, 2022