
An official website of the United States government
An official website of the United States government
The .gov means it's official.
Federal government websites often end in .gov or .mil. Before sharing sensitive information,
make sure you're on a federal government site.
The site is secure.
The
https:// ensures that you are connecting to the official website and that any
information you provide is encrypted and transmitted securely.
Apply blocks, strips, or sheets of shock-absorbing, sound-deadening, or decorative coverings to floors.
Employment estimate and mean wage estimates for Floor Layers, Except Carpet, Wood, and Hard Tiles:
| Employment (1) | Employment RSE (3) |
Mean hourly wage |
Mean annual wage (2) |
Wage RSE (3) |
|---|---|---|---|---|
| 18,300 | 5.2 % | $ 25.90 | $ 53,880 | 2.3 % |
Percentile wage estimates for Floor Layers, Except Carpet, Wood, and Hard Tiles:
| Percentile | 10% | 25% | 50% (Median) |
75% | 90% |
|---|---|---|---|---|---|
| Hourly Wage | $ 14.35 | $ 17.95 | $ 23.11 | $ 31.98 | $ 39.72 |
| Annual Wage (2) | $ 29,840 | $ 37,330 | $ 48,060 | $ 66,510 | $ 82,630 |
Industries with the highest published employment and wages for Floor Layers, Except Carpet, Wood, and Hard Tiles are provided. For a list of all industries with employment in Floor Layers, Except Carpet, Wood, and Hard Tiles, see the Create Customized Tables function.
Industries with the highest levels of employment in Floor Layers, Except Carpet, Wood, and Hard Tiles:
| Industry | Employment (1) | Percent of industry employment | Hourly mean wage | Annual mean wage (2) |
|---|---|---|---|---|
| Building Finishing Contractors | 12,920 | 1.60 | $ 27.11 | $ 56,400 |
| Home Furnishings Stores | 1,840 | 0.81 | $ 24.32 | $ 50,590 |
| Building Material and Supplies Dealers | 1,020 | 0.08 | $ 24.97 | $ 51,930 |
| Residential Building Construction | 640 | 0.08 | $ 20.94 | $ 43,560 |
| Foundation, Structure, and Building Exterior Contractors | 290 | 0.03 | $ 23.31 | $ 48,490 |
Industries with the highest concentration of employment in Floor Layers, Except Carpet, Wood, and Hard Tiles:
| Industry | Employment (1) | Percent of industry employment | Hourly mean wage | Annual mean wage (2) |
|---|---|---|---|---|
| Building Finishing Contractors | 12,920 | 1.60 | $ 27.11 | $ 56,400 |
| Home Furnishings Stores | 1,840 | 0.81 | $ 24.32 | $ 50,590 |
| Residential Building Construction | 640 | 0.08 | $ 20.94 | $ 43,560 |
| Building Material and Supplies Dealers | 1,020 | 0.08 | $ 24.97 | $ 51,930 |
| Other Wood Product Manufacturing | 170 | 0.07 | $ 16.26 | $ 33,830 |
Top paying industries for Floor Layers, Except Carpet, Wood, and Hard Tiles:
| Industry | Employment (1) | Percent of industry employment | Hourly mean wage | Annual mean wage (2) |
|---|---|---|---|---|
| Building Finishing Contractors | 12,920 | 1.60 | $ 27.11 | $ 56,400 |
| Building Material and Supplies Dealers | 1,020 | 0.08 | $ 24.97 | $ 51,930 |
| Home Furnishings Stores | 1,840 | 0.81 | $ 24.32 | $ 50,590 |
| Foundation, Structure, and Building Exterior Contractors | 290 | 0.03 | $ 23.31 | $ 48,490 |
| Furniture Stores | 90 | 0.04 | $ 22.49 | $ 46,780 |
States and areas with the highest published employment, location quotients, and wages for Floor Layers, Except Carpet, Wood, and Hard Tiles are provided. For a list of all areas with employment in Floor Layers, Except Carpet, Wood, and Hard Tiles, see the Create Customized Tables function.
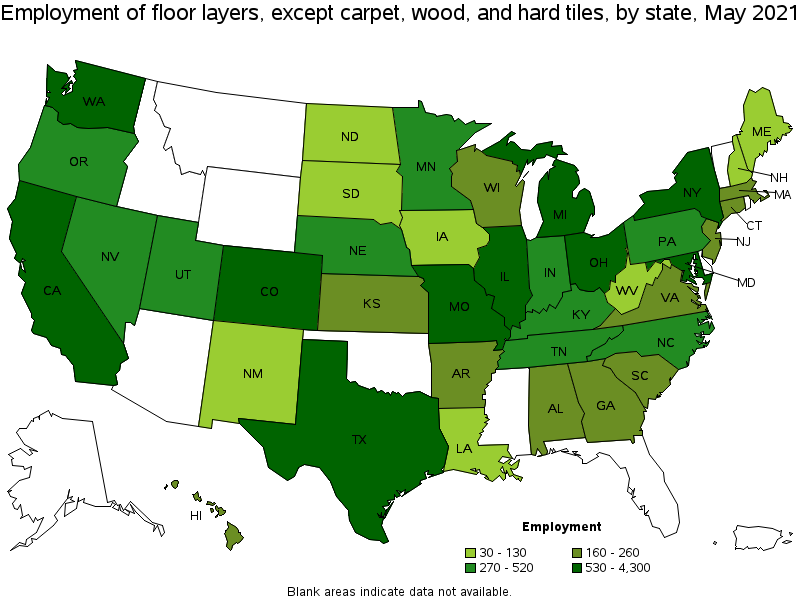
States with the highest employment level in Floor Layers, Except Carpet, Wood, and Hard Tiles:
| State | Employment (1) | Employment per thousand jobs | Location quotient (9) | Hourly mean wage | Annual mean wage (2) |
|---|---|---|---|---|---|
| California | 4,300 | 0.26 | 2.00 | $ 30.97 | $ 64,420 |
| Missouri | 1,060 | 0.39 | 2.99 | $ 26.61 | $ 55,340 |
| Texas | 840 | 0.07 | 0.53 | $ 19.41 | $ 40,380 |
| New York | 780 | 0.09 | 0.70 | $ 31.11 | $ 64,710 |
| Washington | 760 | 0.24 | 1.82 | $ 22.88 | $ 47,580 |
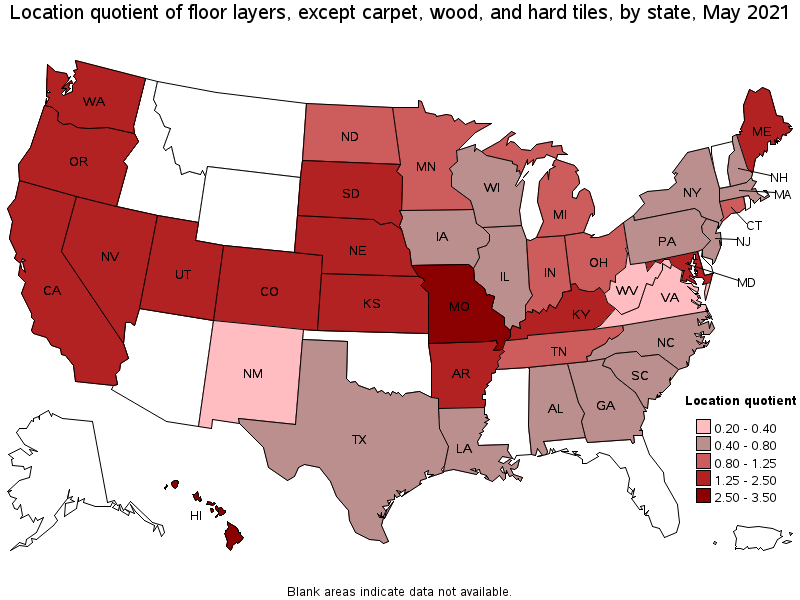
States with the highest concentration of jobs and location quotients in Floor Layers, Except Carpet, Wood, and Hard Tiles:
| State | Employment (1) | Employment per thousand jobs | Location quotient (9) | Hourly mean wage | Annual mean wage (2) |
|---|---|---|---|---|---|
| Hawaii | 220 | 0.39 | 3.02 | $ 35.89 | $ 74,650 |
| Missouri | 1,060 | 0.39 | 2.99 | $ 26.61 | $ 55,340 |
| Nebraska | 270 | 0.28 | 2.19 | $ 17.18 | $ 35,730 |
| California | 4,300 | 0.26 | 2.00 | $ 30.97 | $ 64,420 |
| Washington | 760 | 0.24 | 1.82 | $ 22.88 | $ 47,580 |
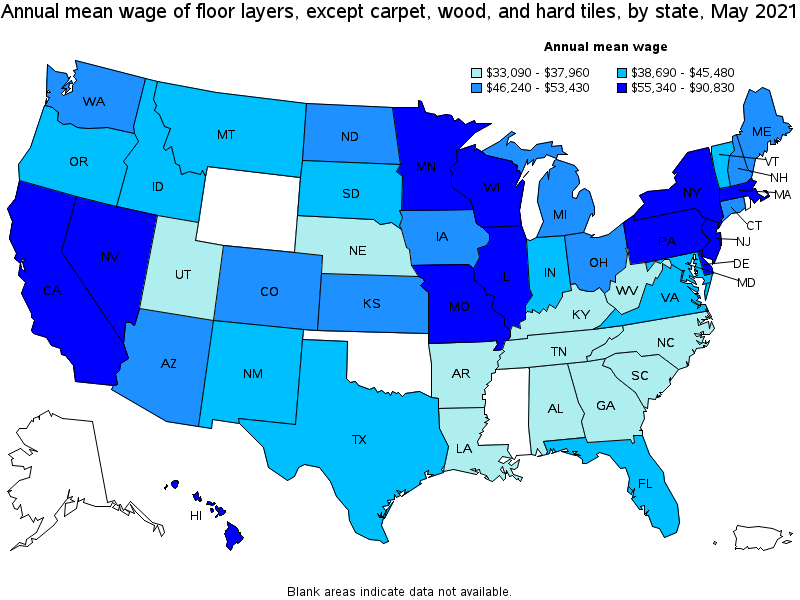
Top paying states for Floor Layers, Except Carpet, Wood, and Hard Tiles:
| State | Employment (1) | Employment per thousand jobs | Location quotient (9) | Hourly mean wage | Annual mean wage (2) |
|---|---|---|---|---|---|
| New Jersey | 260 | 0.07 | 0.52 | $ 43.67 | $ 90,830 |
| Delaware | (8) | (8) | (8) | $ 42.45 | $ 88,290 |
| Hawaii | 220 | 0.39 | 3.02 | $ 35.89 | $ 74,650 |
| Massachusetts | 250 | 0.07 | 0.57 | $ 33.74 | $ 70,180 |
| Illinois | 570 | 0.10 | 0.78 | $ 33.71 | $ 70,130 |
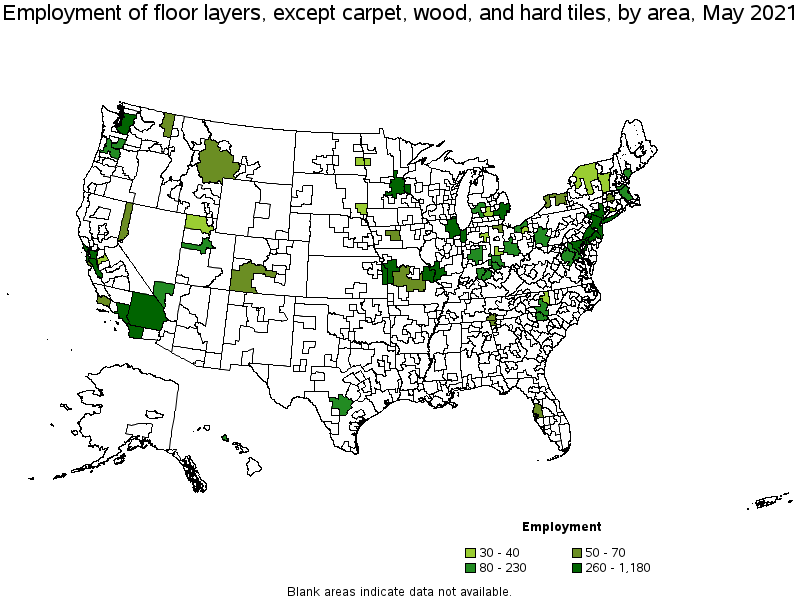
Metropolitan areas with the highest employment level in Floor Layers, Except Carpet, Wood, and Hard Tiles:
| Metropolitan area | Employment (1) | Employment per thousand jobs | Location quotient (9) | Hourly mean wage | Annual mean wage (2) |
|---|---|---|---|---|---|
| Los Angeles-Long Beach-Anaheim, CA | 1,180 | 0.21 | 1.58 | $ 30.67 | $ 63,800 |
| Riverside-San Bernardino-Ontario, CA | 660 | 0.43 | 3.31 | $ 28.46 | $ 59,190 |
| New York-Newark-Jersey City, NY-NJ-PA | 650 | 0.07 | 0.58 | $ 38.03 | $ 79,100 |
| San Francisco-Oakland-Hayward, CA | 550 | 0.24 | 1.88 | $ 35.26 | $ 73,340 |
| St. Louis, MO-IL | 520 | 0.41 | 3.12 | $ 28.69 | $ 59,670 |
| Seattle-Tacoma-Bellevue, WA | 480 | 0.25 | 1.91 | $ 23.69 | $ 49,270 |
| Kansas City, MO-KS | 470 | 0.46 | 3.56 | $ 26.46 | $ 55,050 |
| San Diego-Carlsbad, CA | 440 | 0.32 | 2.43 | $ 29.32 | $ 60,980 |
| Minneapolis-St. Paul-Bloomington, MN-WI | 400 | 0.22 | 1.67 | $ 31.17 | $ 64,830 |
| San Jose-Sunnyvale-Santa Clara, CA | 390 | 0.36 | 2.80 | $ 37.28 | $ 77,540 |
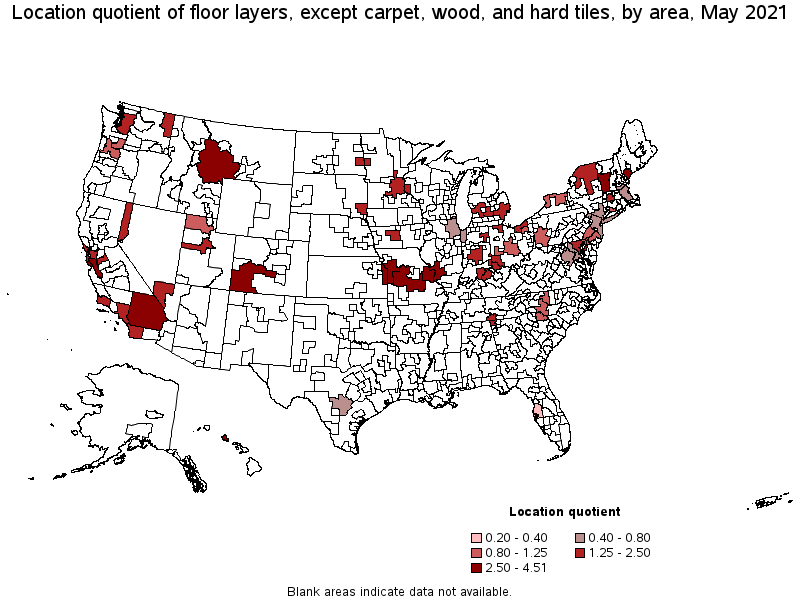
Metropolitan areas with the highest concentration of jobs and location quotients in Floor Layers, Except Carpet, Wood, and Hard Tiles:
| Metropolitan area | Employment (1) | Employment per thousand jobs | Location quotient (9) | Hourly mean wage | Annual mean wage (2) |
|---|---|---|---|---|---|
| Santa Cruz-Watsonville, CA | 50 | 0.52 | 4.01 | $ 28.71 | $ 59,710 |
| Kansas City, MO-KS | 470 | 0.46 | 3.56 | $ 26.46 | $ 55,050 |
| Urban Honolulu, HI | 170 | 0.44 | 3.35 | $ 36.33 | $ 75,560 |
| Riverside-San Bernardino-Ontario, CA | 660 | 0.43 | 3.31 | $ 28.46 | $ 59,190 |
| St. Louis, MO-IL | 520 | 0.41 | 3.12 | $ 28.69 | $ 59,670 |
| Portland-South Portland, ME | 80 | 0.40 | 3.05 | $ 22.20 | $ 46,180 |
| San Jose-Sunnyvale-Santa Clara, CA | 390 | 0.36 | 2.80 | $ 37.28 | $ 77,540 |
| San Diego-Carlsbad, CA | 440 | 0.32 | 2.43 | $ 29.32 | $ 60,980 |
| Provo-Orem, UT | 80 | 0.30 | 2.29 | $ 14.69 | $ 30,560 |
| Spokane-Spokane Valley, WA | 60 | 0.26 | 1.98 | $ 21.39 | $ 44,490 |
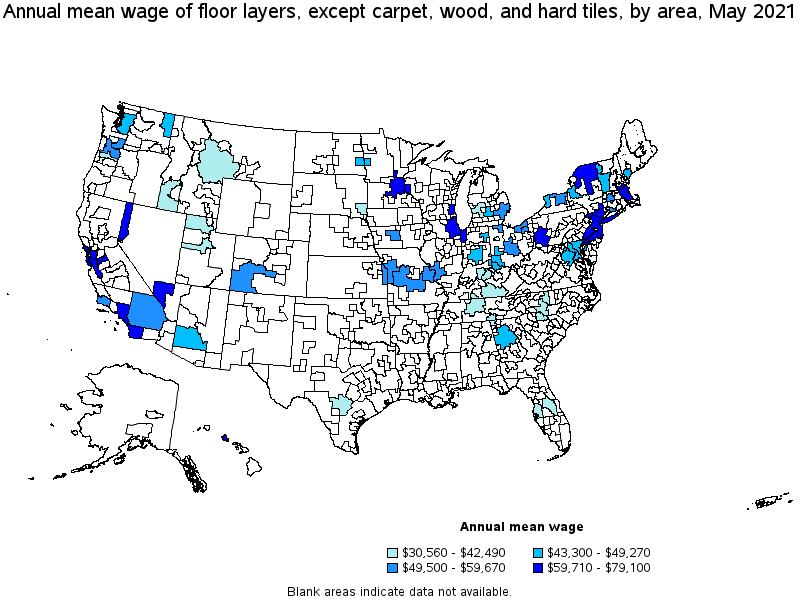
Top paying metropolitan areas for Floor Layers, Except Carpet, Wood, and Hard Tiles:
| Metropolitan area | Employment (1) | Employment per thousand jobs | Location quotient (9) | Hourly mean wage | Annual mean wage (2) |
|---|---|---|---|---|---|
| New York-Newark-Jersey City, NY-NJ-PA | 650 | 0.07 | 0.58 | $ 38.03 | $ 79,100 |
| Philadelphia-Camden-Wilmington, PA-NJ-DE-MD | 300 | 0.11 | 0.87 | $ 37.89 | $ 78,800 |
| San Jose-Sunnyvale-Santa Clara, CA | 390 | 0.36 | 2.80 | $ 37.28 | $ 77,540 |
| Urban Honolulu, HI | 170 | 0.44 | 3.35 | $ 36.33 | $ 75,560 |
| San Francisco-Oakland-Hayward, CA | 550 | 0.24 | 1.88 | $ 35.26 | $ 73,340 |
| Reno, NV | 50 | 0.23 | 1.78 | $ 34.92 | $ 72,630 |
| Chicago-Naperville-Elgin, IL-IN-WI | 380 | 0.09 | 0.69 | $ 34.59 | $ 71,950 |
| Boston-Cambridge-Nashua, MA-NH | 210 | 0.08 | 0.62 | $ 34.30 | $ 71,330 |
| Pittsburgh, PA | 150 | 0.15 | 1.13 | $ 31.78 | $ 66,100 |
| Minneapolis-St. Paul-Bloomington, MN-WI | 400 | 0.22 | 1.67 | $ 31.17 | $ 64,830 |
Nonmetropolitan areas with the highest employment in Floor Layers, Except Carpet, Wood, and Hard Tiles:
| Nonmetropolitan area | Employment (1) | Employment per thousand jobs | Location quotient (9) | Hourly mean wage | Annual mean wage (2) |
|---|---|---|---|---|---|
| Central Missouri nonmetropolitan area | 70 | 0.46 | 3.54 | $ 24.05 | $ 50,030 |
| Southwest Montana nonmetropolitan area | 60 | 0.47 | 3.58 | $ 19.00 | $ 39,520 |
| Southwest Colorado nonmetropolitan area | 60 | 0.59 | 4.51 | $ 24.54 | $ 51,050 |
| Capital/Northern New York nonmetropolitan area | 40 | 0.27 | 2.07 | $ 29.81 | $ 62,010 |
| Southern Vermont nonmetropolitan area | 30 | 0.32 | 2.50 | $ 21.97 | $ 45,710 |
Nonmetropolitan areas with the highest concentration of jobs and location quotients in Floor Layers, Except Carpet, Wood, and Hard Tiles:
| Nonmetropolitan area | Employment (1) | Employment per thousand jobs | Location quotient (9) | Hourly mean wage | Annual mean wage (2) |
|---|---|---|---|---|---|
| Southwest Colorado nonmetropolitan area | 60 | 0.59 | 4.51 | $ 24.54 | $ 51,050 |
| Southwest Montana nonmetropolitan area | 60 | 0.47 | 3.58 | $ 19.00 | $ 39,520 |
| Central Missouri nonmetropolitan area | 70 | 0.46 | 3.54 | $ 24.05 | $ 50,030 |
| Southern Vermont nonmetropolitan area | 30 | 0.32 | 2.50 | $ 21.97 | $ 45,710 |
| Capital/Northern New York nonmetropolitan area | 40 | 0.27 | 2.07 | $ 29.81 | $ 62,010 |
Top paying nonmetropolitan areas for Floor Layers, Except Carpet, Wood, and Hard Tiles:
| Nonmetropolitan area | Employment (1) | Employment per thousand jobs | Location quotient (9) | Hourly mean wage | Annual mean wage (2) |
|---|---|---|---|---|---|
| Capital/Northern New York nonmetropolitan area | 40 | 0.27 | 2.07 | $ 29.81 | $ 62,010 |
| Southwest Colorado nonmetropolitan area | 60 | 0.59 | 4.51 | $ 24.54 | $ 51,050 |
| Central Missouri nonmetropolitan area | 70 | 0.46 | 3.54 | $ 24.05 | $ 50,030 |
| Southern Vermont nonmetropolitan area | 30 | 0.32 | 2.50 | $ 21.97 | $ 45,710 |
| Southwest Montana nonmetropolitan area | 60 | 0.47 | 3.58 | $ 19.00 | $ 39,520 |
These estimates are calculated with data collected from employers in all industry sectors, all metropolitan and nonmetropolitan areas, and all states and the District of Columbia. The top employment and wage figures are provided above. The complete list is available in the downloadable XLS files.
The percentile wage estimate is the value of a wage below which a certain percent of workers fall. The median wage is the 50th percentile wage estimate—50 percent of workers earn less than the median and 50 percent of workers earn more than the median. More about percentile wages.
(1) Estimates for detailed occupations do not sum to the totals because the totals include occupations not shown separately. Estimates do not include self-employed workers.
(2) Annual wages have been calculated by multiplying the hourly mean wage by a "year-round, full-time" hours figure of 2,080 hours; for those occupations where there is not an hourly wage published, the annual wage has been directly calculated from the reported survey data.
(3) The relative standard error (RSE) is a measure of the reliability of a survey statistic. The smaller the relative standard error, the more precise the estimate.
(8) Estimate not released.
(9) The location quotient is the ratio of the area concentration of occupational employment to the national average concentration. A location quotient greater than one indicates the occupation has a higher share of employment than average, and a location quotient less than one indicates the occupation is less prevalent in the area than average.
Other OEWS estimates and related information:
May 2021 National Occupational Employment and Wage Estimates
May 2021 State Occupational Employment and Wage Estimates
May 2021 Metropolitan and Nonmetropolitan Area Occupational Employment and Wage Estimates
May 2021 National Industry-Specific Occupational Employment and Wage Estimates
Last Modified Date: March 31, 2022