
An official website of the United States government
An official website of the United States government
The .gov means it's official.
Federal government websites often end in .gov or .mil. Before sharing sensitive information,
make sure you're on a federal government site.
The site is secure.
The
https:// ensures that you are connecting to the official website and that any
information you provide is encrypted and transmitted securely.
Operate one or several types of power construction equipment, such as motor graders, bulldozers, scrapers, compressors, pumps, derricks, shovels, tractors, or front-end loaders to excavate, move, and grade earth, erect structures, or pour concrete or other hard surface pavement. May repair and maintain equipment in addition to other duties. Excludes �Extraction Workers� (47-5000) and �Crane and Tower Operators� (53-7021).
Employment estimate and mean wage estimates for Operating Engineers and Other Construction Equipment Operators:
| Employment (1) | Employment RSE (3) |
Mean hourly wage |
Mean annual wage (2) |
Wage RSE (3) |
|---|---|---|---|---|
| 404,820 | 0.7 % | $ 27.06 | $ 56,280 | 0.4 % |
Percentile wage estimates for Operating Engineers and Other Construction Equipment Operators:
| Percentile | 10% | 25% | 50% (Median) |
75% | 90% |
|---|---|---|---|---|---|
| Hourly Wage | $ 17.38 | $ 18.54 | $ 23.25 | $ 30.14 | $ 41.13 |
| Annual Wage (2) | $ 36,150 | $ 38,570 | $ 48,360 | $ 62,690 | $ 85,560 |
Industries with the highest published employment and wages for Operating Engineers and Other Construction Equipment Operators are provided. For a list of all industries with employment in Operating Engineers and Other Construction Equipment Operators, see the Create Customized Tables function.
Industries with the highest levels of employment in Operating Engineers and Other Construction Equipment Operators:
| Industry | Employment (1) | Percent of industry employment | Hourly mean wage | Annual mean wage (2) |
|---|---|---|---|---|
| Other Specialty Trade Contractors | 101,200 | 14.17 | $ 27.01 | $ 56,180 |
| Local Government, excluding schools and hospitals (OEWS Designation) | 59,110 | 1.10 | $ 22.68 | $ 47,180 |
| Utility System Construction | 53,250 | 9.87 | $ 29.64 | $ 61,660 |
| Highway, Street, and Bridge Construction | 49,860 | 14.03 | $ 31.80 | $ 66,140 |
| State Government, excluding schools and hospitals (OEWS Designation) | 16,550 | 0.75 | $ 21.70 | $ 45,140 |
Industries with the highest concentration of employment in Operating Engineers and Other Construction Equipment Operators:
| Industry | Employment (1) | Percent of industry employment | Hourly mean wage | Annual mean wage (2) |
|---|---|---|---|---|
| Other Specialty Trade Contractors | 101,200 | 14.17 | $ 27.01 | $ 56,180 |
| Highway, Street, and Bridge Construction | 49,860 | 14.03 | $ 31.80 | $ 66,140 |
| Other Heavy and Civil Engineering Construction | 15,330 | 12.74 | $ 29.54 | $ 61,440 |
| Nonmetallic Mineral Mining and Quarrying | 10,340 | 10.82 | $ 23.10 | $ 48,050 |
| Utility System Construction | 53,250 | 9.87 | $ 29.64 | $ 61,660 |
Top paying industries for Operating Engineers and Other Construction Equipment Operators:
| Industry | Employment (1) | Percent of industry employment | Hourly mean wage | Annual mean wage (2) |
|---|---|---|---|---|
| Natural Gas Distribution | 1,100 | 1.01 | $ 40.04 | $ 83,280 |
| Scientific Research and Development Services | 70 | 0.01 | $ 38.58 | $ 80,240 |
| Building Finishing Contractors | 340 | 0.04 | $ 35.14 | $ 73,090 |
| Electric Power Generation, Transmission and Distribution | 1,950 | 0.52 | $ 35.08 | $ 72,970 |
| Pipeline Transportation of Natural Gas | 250 | 0.83 | $ 33.53 | $ 69,740 |
States and areas with the highest published employment, location quotients, and wages for Operating Engineers and Other Construction Equipment Operators are provided. For a list of all areas with employment in Operating Engineers and Other Construction Equipment Operators, see the Create Customized Tables function.
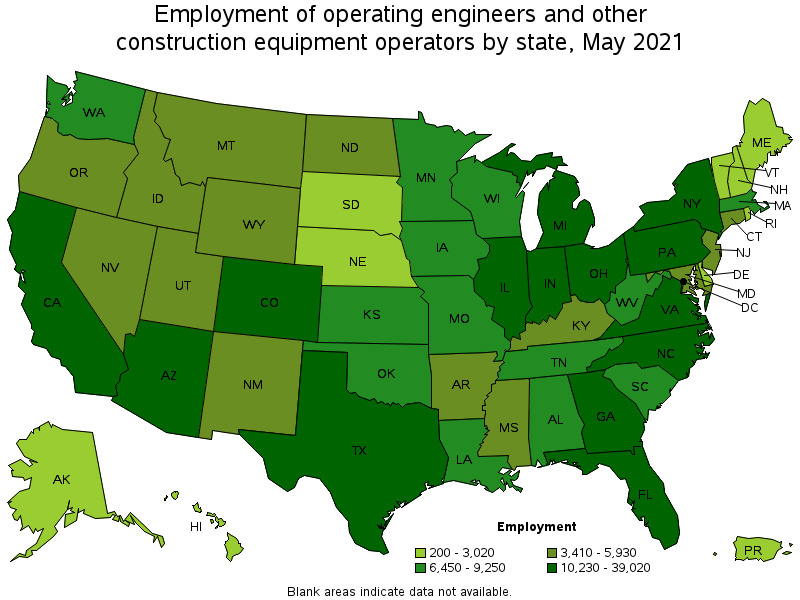
States with the highest employment level in Operating Engineers and Other Construction Equipment Operators:
| State | Employment (1) | Employment per thousand jobs | Location quotient (9) | Hourly mean wage | Annual mean wage (2) |
|---|---|---|---|---|---|
| Texas | 39,020 | 3.19 | 1.11 | $ 21.84 | $ 45,430 |
| California | 28,600 | 1.73 | 0.60 | $ 37.65 | $ 78,320 |
| Pennsylvania | 22,130 | 3.96 | 1.38 | $ 26.42 | $ 54,950 |
| Florida | 20,570 | 2.39 | 0.83 | $ 21.27 | $ 44,250 |
| New York | 14,290 | 1.65 | 0.57 | $ 39.35 | $ 81,840 |
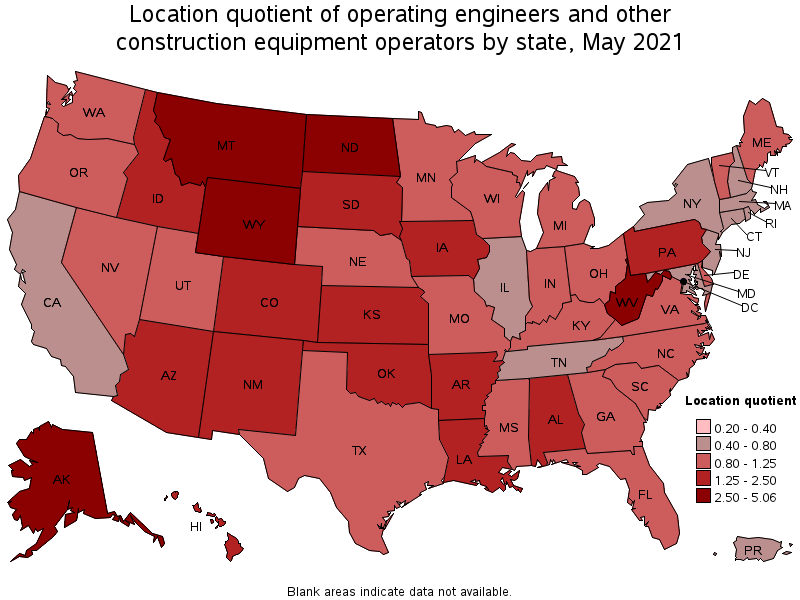
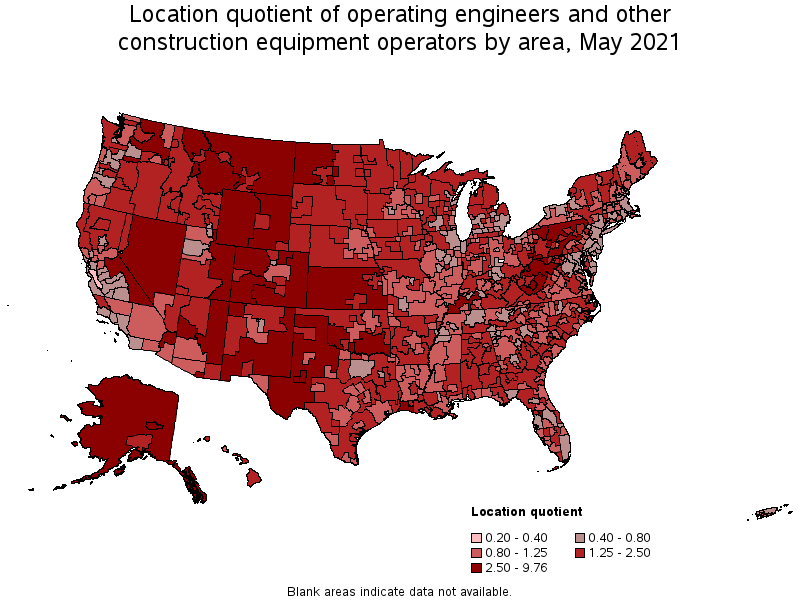
States with the highest concentration of jobs and location quotients in Operating Engineers and Other Construction Equipment Operators:
| State | Employment (1) | Employment per thousand jobs | Location quotient (9) | Hourly mean wage | Annual mean wage (2) |
|---|---|---|---|---|---|
| Wyoming | 3,790 | 14.55 | 5.06 | $ 29.95 | $ 62,300 |
| West Virginia | 6,570 | 9.99 | 3.48 | $ 24.04 | $ 50,000 |
| North Dakota | 3,410 | 8.63 | 3.00 | $ 28.80 | $ 59,890 |
| Alaska | 2,520 | 8.52 | 2.97 | $ 32.83 | $ 68,290 |
| Montana | 3,570 | 7.60 | 2.65 | $ 26.12 | $ 54,320 |
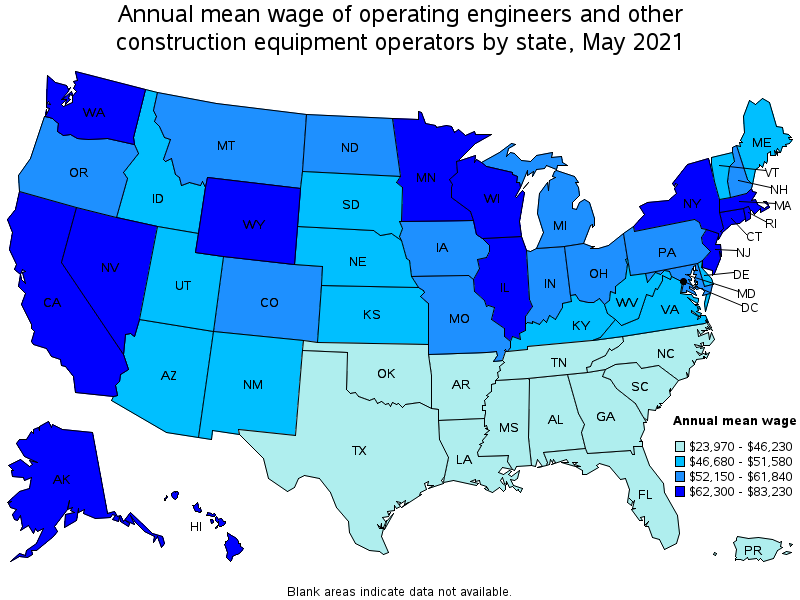
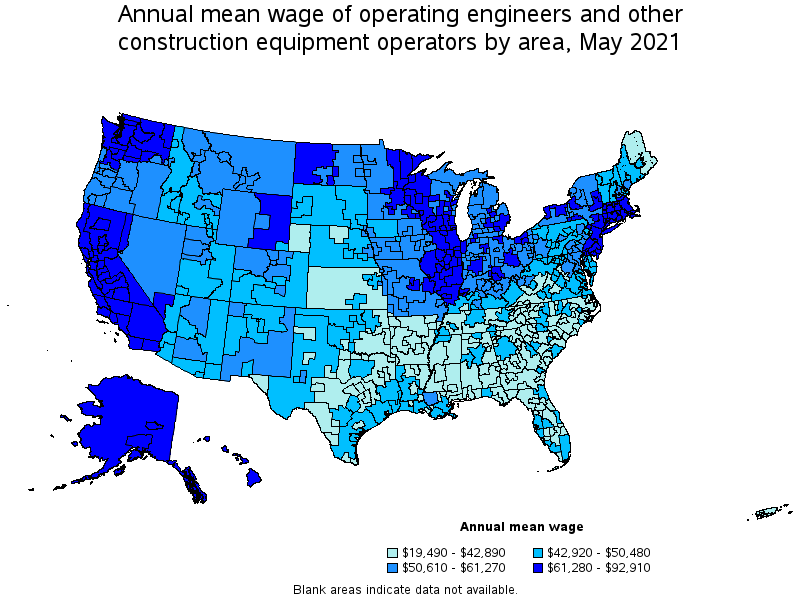
Top paying states for Operating Engineers and Other Construction Equipment Operators:
| State | Employment (1) | Employment per thousand jobs | Location quotient (9) | Hourly mean wage | Annual mean wage (2) |
|---|---|---|---|---|---|
| New Jersey | 4,580 | 1.19 | 0.41 | $ 40.02 | $ 83,230 |
| New York | 14,290 | 1.65 | 0.57 | $ 39.35 | $ 81,840 |
| Hawaii | 1,960 | 3.58 | 1.25 | $ 37.68 | $ 78,360 |
| California | 28,600 | 1.73 | 0.60 | $ 37.65 | $ 78,320 |
| Illinois | 11,530 | 2.05 | 0.71 | $ 37.14 | $ 77,250 |
Metropolitan areas with the highest employment level in Operating Engineers and Other Construction Equipment Operators:
| Metropolitan area | Employment (1) | Employment per thousand jobs | Location quotient (9) | Hourly mean wage | Annual mean wage (2) |
|---|---|---|---|---|---|
| New York-Newark-Jersey City, NY-NJ-PA | 10,990 | 1.27 | 0.44 | $ 44.16 | $ 91,860 |
| Houston-The Woodlands-Sugar Land, TX | 9,490 | 3.28 | 1.14 | $ 23.12 | $ 48,090 |
| Chicago-Naperville-Elgin, IL-IN-WI | 7,580 | 1.79 | 0.62 | $ 38.93 | $ 80,980 |
| Dallas-Fort Worth-Arlington, TX | 7,530 | 2.10 | 0.73 | $ 22.48 | $ 46,760 |
| Los Angeles-Long Beach-Anaheim, CA | 6,600 | 1.15 | 0.40 | $ 37.91 | $ 78,850 |
| Phoenix-Mesa-Scottsdale, AZ | 6,390 | 3.02 | 1.05 | $ 25.78 | $ 53,620 |
| Atlanta-Sandy Springs-Roswell, GA | 6,030 | 2.33 | 0.81 | $ 21.60 | $ 44,930 |
| Washington-Arlington-Alexandria, DC-VA-MD-WV | 5,890 | 2.01 | 0.70 | $ 26.79 | $ 55,710 |
| Philadelphia-Camden-Wilmington, PA-NJ-DE-MD | 5,190 | 1.95 | 0.68 | $ 30.74 | $ 63,940 |
| Denver-Aurora-Lakewood, CO | 5,170 | 3.53 | 1.23 | $ 26.23 | $ 54,550 |
Metropolitan areas with the highest concentration of jobs and location quotients in Operating Engineers and Other Construction Equipment Operators:
| Metropolitan area | Employment (1) | Employment per thousand jobs | Location quotient (9) | Hourly mean wage | Annual mean wage (2) |
|---|---|---|---|---|---|
| Fairbanks, AK | 410 | 11.90 | 4.14 | $ 32.24 | $ 67,060 |
| Midland, TX | 1,020 | 10.76 | 3.74 | $ 24.33 | $ 50,610 |
| Greeley, CO | 1,060 | 10.39 | 3.62 | $ 24.61 | $ 51,190 |
| Lake Charles, LA | 870 | 9.59 | 3.34 | $ 22.60 | $ 47,000 |
| Farmington, NM | 390 | 9.50 | 3.31 | $ 25.77 | $ 53,600 |
| The Villages, FL | 300 | 8.92 | 3.10 | $ 20.39 | $ 42,400 |
| Wheeling, WV-OH | 460 | 8.09 | 2.81 | $ 27.25 | $ 56,670 |
| Beckley, WV | 310 | 7.71 | 2.68 | $ 23.57 | $ 49,020 |
| Prescott, AZ | 490 | 7.52 | 2.62 | $ 22.92 | $ 47,670 |
| Parkersburg-Vienna, WV | 260 | 7.47 | 2.60 | $ 21.30 | $ 44,300 |
Top paying metropolitan areas for Operating Engineers and Other Construction Equipment Operators:
| Metropolitan area | Employment (1) | Employment per thousand jobs | Location quotient (9) | Hourly mean wage | Annual mean wage (2) |
|---|---|---|---|---|---|
| San Francisco-Oakland-Hayward, CA | 3,190 | 1.42 | 0.49 | $ 44.67 | $ 92,910 |
| New York-Newark-Jersey City, NY-NJ-PA | 10,990 | 1.27 | 0.44 | $ 44.16 | $ 91,860 |
| San Jose-Sunnyvale-Santa Clara, CA | 1,130 | 1.06 | 0.37 | $ 43.81 | $ 91,120 |
| Atlantic City-Hammonton, NJ | 190 | 1.65 | 0.58 | $ 40.78 | $ 84,830 |
| Santa Rosa, CA | 620 | 3.24 | 1.13 | $ 40.01 | $ 83,220 |
| Urban Honolulu, HI | 1,170 | 2.96 | 1.03 | $ 39.77 | $ 82,710 |
| Vallejo-Fairfield, CA | 440 | 3.41 | 1.19 | $ 39.43 | $ 82,000 |
| Seattle-Tacoma-Bellevue, WA | 4,530 | 2.36 | 0.82 | $ 39.40 | $ 81,950 |
| Trenton, NJ | 180 | 0.78 | 0.27 | $ 39.35 | $ 81,850 |
| Chicago-Naperville-Elgin, IL-IN-WI | 7,580 | 1.79 | 0.62 | $ 38.93 | $ 80,980 |
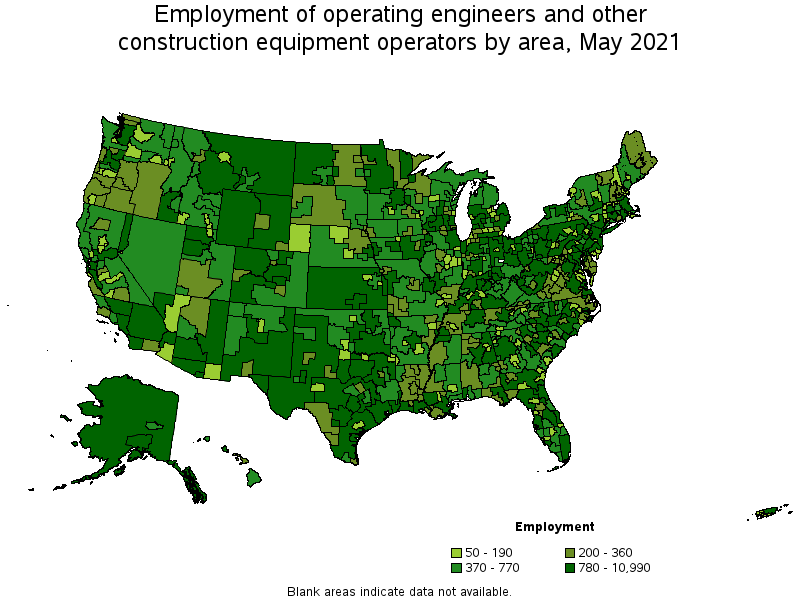
Nonmetropolitan areas with the highest employment in Operating Engineers and Other Construction Equipment Operators:
| Nonmetropolitan area | Employment (1) | Employment per thousand jobs | Location quotient (9) | Hourly mean wage | Annual mean wage (2) |
|---|---|---|---|---|---|
| Kansas nonmetropolitan area | 2,860 | 7.61 | 2.65 | $ 19.87 | $ 41,340 |
| Eastern Wyoming nonmetropolitan area | 2,240 | 28.04 | 9.76 | $ 32.83 | $ 68,280 |
| Northern West Virginia nonmetropolitan area | 2,080 | 16.01 | 5.57 | $ 23.82 | $ 49,540 |
| Arizona nonmetropolitan area | 1,870 | 20.65 | 7.19 | $ 23.46 | $ 48,800 |
| West North Dakota nonmetropolitan area | 1,780 | 16.81 | 5.85 | $ 30.81 | $ 64,080 |
Nonmetropolitan areas with the highest concentration of jobs and location quotients in Operating Engineers and Other Construction Equipment Operators:
| Nonmetropolitan area | Employment (1) | Employment per thousand jobs | Location quotient (9) | Hourly mean wage | Annual mean wage (2) |
|---|---|---|---|---|---|
| Eastern Wyoming nonmetropolitan area | 2,240 | 28.04 | 9.76 | $ 32.83 | $ 68,280 |
| Arizona nonmetropolitan area | 1,870 | 20.65 | 7.19 | $ 23.46 | $ 48,800 |
| West North Dakota nonmetropolitan area | 1,780 | 16.81 | 5.85 | $ 30.81 | $ 64,080 |
| Northern West Virginia nonmetropolitan area | 2,080 | 16.01 | 5.57 | $ 23.82 | $ 49,540 |
| East-Central Montana nonmetropolitan area | 870 | 13.92 | 4.84 | $ 26.94 | $ 56,020 |
Top paying nonmetropolitan areas for Operating Engineers and Other Construction Equipment Operators:
| Nonmetropolitan area | Employment (1) | Employment per thousand jobs | Location quotient (9) | Hourly mean wage | Annual mean wage (2) |
|---|---|---|---|---|---|
| Hawaii / Kauai nonmetropolitan area | 530 | 6.01 | 2.09 | $ 34.62 | $ 72,020 |
| Northwest Illinois nonmetropolitan area | 530 | 4.20 | 1.46 | $ 33.62 | $ 69,930 |
| North Coast Region of California nonmetropolitan area | 430 | 4.28 | 1.49 | $ 33.29 | $ 69,250 |
| Connecticut nonmetropolitan area | 130 | 4.14 | 1.44 | $ 33.07 | $ 68,780 |
| Eastern Wyoming nonmetropolitan area | 2,240 | 28.04 | 9.76 | $ 32.83 | $ 68,280 |
These estimates are calculated with data collected from employers in all industry sectors, all metropolitan and nonmetropolitan areas, and all states and the District of Columbia. The top employment and wage figures are provided above. The complete list is available in the downloadable XLS files.
The percentile wage estimate is the value of a wage below which a certain percent of workers fall. The median wage is the 50th percentile wage estimate—50 percent of workers earn less than the median and 50 percent of workers earn more than the median. More about percentile wages.
(1) Estimates for detailed occupations do not sum to the totals because the totals include occupations not shown separately. Estimates do not include self-employed workers.
(2) Annual wages have been calculated by multiplying the hourly mean wage by a "year-round, full-time" hours figure of 2,080 hours; for those occupations where there is not an hourly wage published, the annual wage has been directly calculated from the reported survey data.
(3) The relative standard error (RSE) is a measure of the reliability of a survey statistic. The smaller the relative standard error, the more precise the estimate.
(9) The location quotient is the ratio of the area concentration of occupational employment to the national average concentration. A location quotient greater than one indicates the occupation has a higher share of employment than average, and a location quotient less than one indicates the occupation is less prevalent in the area than average.
Other OEWS estimates and related information:
May 2021 National Occupational Employment and Wage Estimates
May 2021 State Occupational Employment and Wage Estimates
May 2021 Metropolitan and Nonmetropolitan Area Occupational Employment and Wage Estimates
May 2021 National Industry-Specific Occupational Employment and Wage Estimates
Last Modified Date: March 31, 2022