
An official website of the United States government
An official website of the United States government
The .gov means it's official.
Federal government websites often end in .gov or .mil. Before sharing sensitive information,
make sure you're on a federal government site.
The site is secure.
The
https:// ensures that you are connecting to the official website and that any
information you provide is encrypted and transmitted securely.
Install glass in windows, skylights, store fronts, and display cases, or on surfaces, such as building fronts, interior walls, ceilings, and tabletops.
Employment estimate and mean wage estimates for Glaziers:
| Employment (1) | Employment RSE (3) |
Mean hourly wage |
Mean annual wage (2) |
Wage RSE (3) |
|---|---|---|---|---|
| 52,700 | 2.5 % | $ 24.98 | $ 51,950 | 1.1 % |
Percentile wage estimates for Glaziers:
| Percentile | 10% | 25% | 50% (Median) |
75% | 90% |
|---|---|---|---|---|---|
| Hourly Wage | $ 14.65 | $ 18.09 | $ 22.68 | $ 28.92 | $ 38.15 |
| Annual Wage (2) | $ 30,470 | $ 37,630 | $ 47,180 | $ 60,150 | $ 79,340 |
Industries with the highest published employment and wages for Glaziers are provided. For a list of all industries with employment in Glaziers, see the Create Customized Tables function.
Industries with the highest levels of employment in Glaziers:
| Industry | Employment (1) | Percent of industry employment | Hourly mean wage | Annual mean wage (2) |
|---|---|---|---|---|
| Foundation, Structure, and Building Exterior Contractors | 36,630 | 3.92 | $ 26.06 | $ 54,210 |
| Building Material and Supplies Dealers | 6,240 | 0.50 | $ 21.38 | $ 44,480 |
| Building Finishing Contractors | 3,180 | 0.39 | $ 25.06 | $ 52,120 |
| Automotive Repair and Maintenance | 1,270 | 0.14 | $ 21.32 | $ 44,350 |
| Nonresidential Building Construction | 1,180 | 0.15 | $ 28.18 | $ 58,610 |
Industries with the highest concentration of employment in Glaziers:
| Industry | Employment (1) | Percent of industry employment | Hourly mean wage | Annual mean wage (2) |
|---|---|---|---|---|
| Foundation, Structure, and Building Exterior Contractors | 36,630 | 3.92 | $ 26.06 | $ 54,210 |
| Building Material and Supplies Dealers | 6,240 | 0.50 | $ 21.38 | $ 44,480 |
| Building Finishing Contractors | 3,180 | 0.39 | $ 25.06 | $ 52,120 |
| Fabricated Metal Product Manufacturing (3323 and 3324 only) | 1,040 | 0.22 | $ 19.47 | $ 40,500 |
| Nonmetallic Mineral Product Manufacturing | 750 | 0.19 | $ 21.58 | $ 44,880 |
Top paying industries for Glaziers:
| Industry | Employment (1) | Percent of industry employment | Hourly mean wage | Annual mean wage (2) |
|---|---|---|---|---|
| Local Government, excluding schools and hospitals (OEWS Designation) | 90 | (7) | $ 37.93 | $ 78,900 |
| Management of Companies and Enterprises | (8) | (8) | $ 30.95 | $ 64,370 |
| Nonresidential Building Construction | 1,180 | 0.15 | $ 28.18 | $ 58,610 |
| Elementary and Secondary Schools | 120 | (7) | $ 27.50 | $ 57,190 |
| Foundation, Structure, and Building Exterior Contractors | 36,630 | 3.92 | $ 26.06 | $ 54,210 |
States and areas with the highest published employment, location quotients, and wages for Glaziers are provided. For a list of all areas with employment in Glaziers, see the Create Customized Tables function.
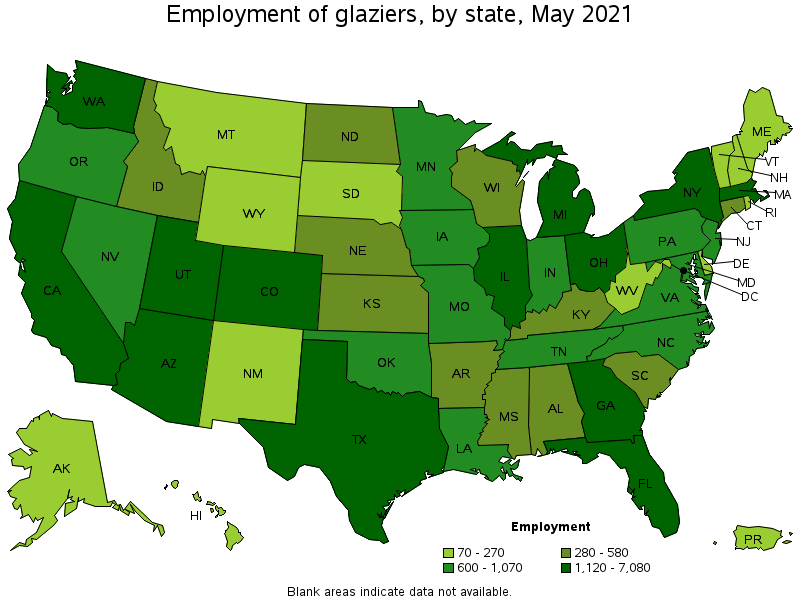
States with the highest employment level in Glaziers:
| State | Employment (1) | Employment per thousand jobs | Location quotient (9) | Hourly mean wage | Annual mean wage (2) |
|---|---|---|---|---|---|
| Texas | 7,080 | 0.58 | 1.55 | $ 20.11 | $ 41,830 |
| California | 6,320 | 0.38 | 1.02 | $ 30.06 | $ 62,530 |
| Florida | 4,880 | 0.57 | 1.51 | $ 20.39 | $ 42,420 |
| New York | 2,860 | 0.33 | 0.88 | $ 30.74 | $ 63,950 |
| Washington | 1,790 | 0.56 | 1.49 | $ 33.06 | $ 68,770 |
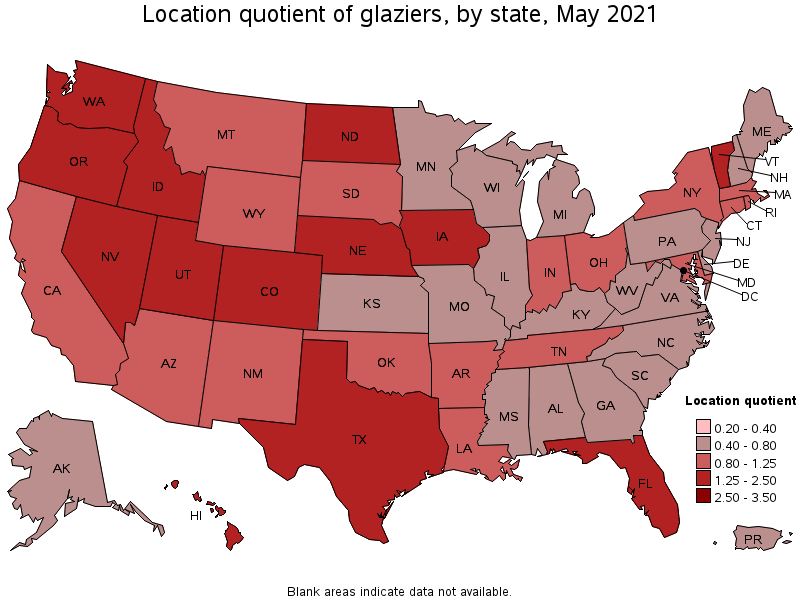
States with the highest concentration of jobs and location quotients in Glaziers:
| State | Employment (1) | Employment per thousand jobs | Location quotient (9) | Hourly mean wage | Annual mean wage (2) |
|---|---|---|---|---|---|
| North Dakota | 300 | 0.77 | 2.05 | $ 24.84 | $ 51,660 |
| Idaho | 580 | 0.76 | 2.03 | $ 17.24 | $ 35,860 |
| Vermont | 210 | 0.73 | 1.96 | $ 22.69 | $ 47,200 |
| Utah | 1,120 | 0.72 | 1.92 | $ 20.87 | $ 43,410 |
| Colorado | 1,790 | 0.68 | 1.82 | $ 24.63 | $ 51,240 |
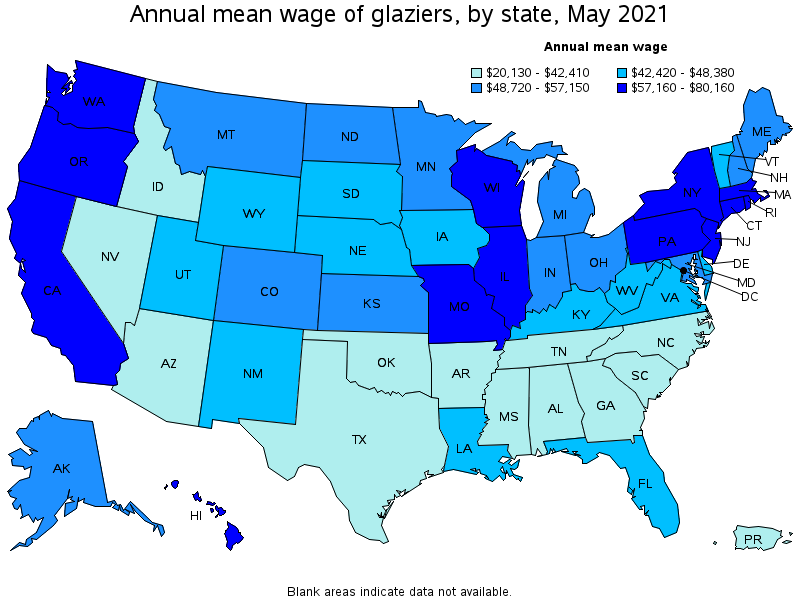
Top paying states for Glaziers:
| State | Employment (1) | Employment per thousand jobs | Location quotient (9) | Hourly mean wage | Annual mean wage (2) |
|---|---|---|---|---|---|
| New Jersey | 740 | 0.19 | 0.52 | $ 38.54 | $ 80,160 |
| Hawaii | 270 | 0.50 | 1.34 | $ 34.32 | $ 71,390 |
| Massachusetts | 1,220 | 0.36 | 0.96 | $ 33.97 | $ 70,660 |
| Washington | 1,790 | 0.56 | 1.49 | $ 33.06 | $ 68,770 |
| Pennsylvania | 1,070 | 0.19 | 0.51 | $ 32.91 | $ 68,450 |
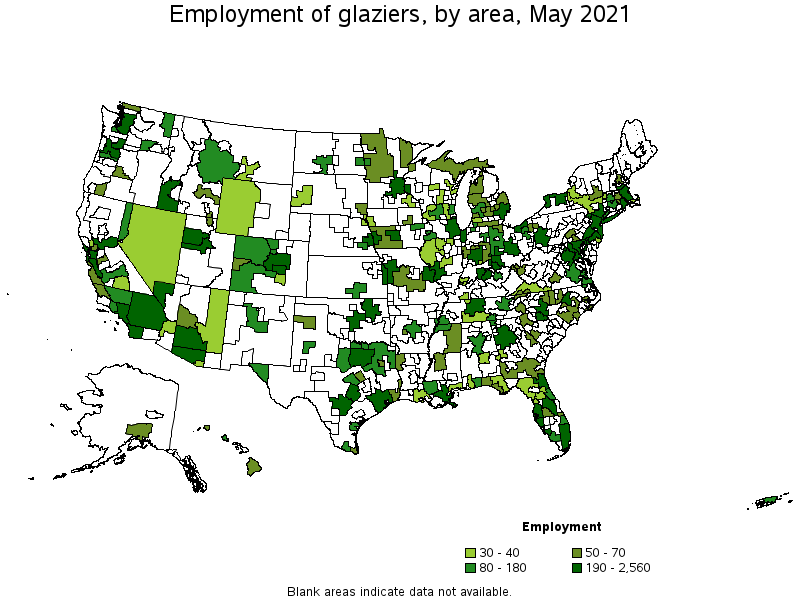
Metropolitan areas with the highest employment level in Glaziers:
| Metropolitan area | Employment (1) | Employment per thousand jobs | Location quotient (9) | Hourly mean wage | Annual mean wage (2) |
|---|---|---|---|---|---|
| New York-Newark-Jersey City, NY-NJ-PA | 2,560 | 0.30 | 0.79 | $ 34.03 | $ 70,790 |
| Dallas-Fort Worth-Arlington, TX | 2,320 | 0.65 | 1.72 | $ 21.04 | $ 43,760 |
| Los Angeles-Long Beach-Anaheim, CA | 1,810 | 0.32 | 0.85 | $ 30.77 | $ 64,010 |
| Miami-Fort Lauderdale-West Palm Beach, FL | 1,800 | 0.74 | 1.97 | $ 20.65 | $ 42,960 |
| Houston-The Woodlands-Sugar Land, TX | 1,700 | 0.59 | 1.57 | $ 20.37 | $ 42,370 |
| Seattle-Tacoma-Bellevue, WA | 1,210 | 0.63 | 1.69 | $ 34.60 | $ 71,970 |
| Washington-Arlington-Alexandria, DC-VA-MD-WV | 1,190 | 0.41 | 1.09 | $ 26.64 | $ 55,410 |
| Phoenix-Mesa-Scottsdale, AZ | 1,010 | 0.48 | 1.28 | $ 20.49 | $ 42,630 |
| Denver-Aurora-Lakewood, CO | 1,000 | 0.68 | 1.82 | $ 25.89 | $ 53,850 |
| Chicago-Naperville-Elgin, IL-IN-WI | 950 | 0.23 | 0.60 | $ 32.07 | $ 66,710 |
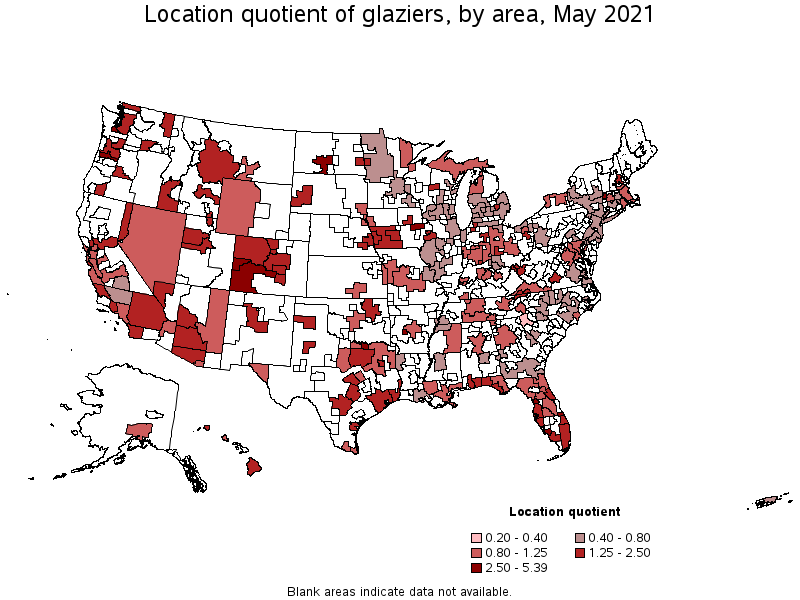
Metropolitan areas with the highest concentration of jobs and location quotients in Glaziers:
| Metropolitan area | Employment (1) | Employment per thousand jobs | Location quotient (9) | Hourly mean wage | Annual mean wage (2) |
|---|---|---|---|---|---|
| Sherman-Denison, TX | 100 | 2.02 | 5.39 | $ 20.17 | $ 41,950 |
| Hot Springs, AR | 60 | 1.59 | 4.26 | $ 15.13 | $ 31,470 |
| Cape Coral-Fort Myers, FL | 340 | 1.27 | 3.38 | $ 20.32 | $ 42,270 |
| Bismarck, ND | 80 | 1.21 | 3.24 | $ 24.96 | $ 51,910 |
| Grand Junction, CO | 70 | 1.09 | 2.91 | $ 21.41 | $ 44,520 |
| Homosassa Springs, FL | 30 | 1.07 | 2.87 | $ 17.93 | $ 37,300 |
| Olympia-Tumwater, WA | 120 | 1.07 | 2.86 | $ 37.91 | $ 78,840 |
| Sebastian-Vero Beach, FL | 50 | 1.05 | 2.81 | $ 20.00 | $ 41,590 |
| Salem, OR | 180 | 1.04 | 2.79 | $ 37.50 | $ 78,000 |
| Pittsfield, MA | 40 | 0.99 | 2.66 | (8) | (8) |
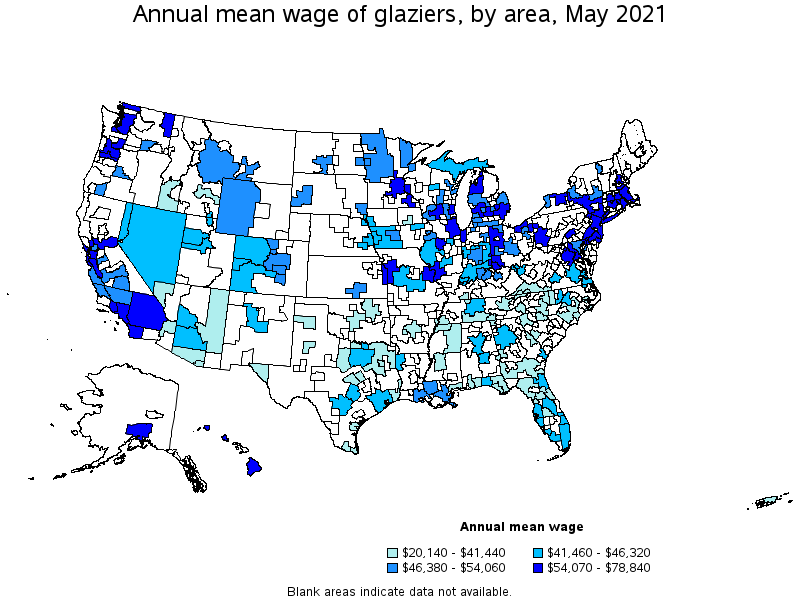
Top paying metropolitan areas for Glaziers:
| Metropolitan area | Employment (1) | Employment per thousand jobs | Location quotient (9) | Hourly mean wage | Annual mean wage (2) |
|---|---|---|---|---|---|
| Olympia-Tumwater, WA | 120 | 1.07 | 2.86 | $ 37.91 | $ 78,840 |
| Salem, OR | 180 | 1.04 | 2.79 | $ 37.50 | $ 78,000 |
| Madison, WI | 100 | 0.26 | 0.69 | $ 36.05 | $ 74,990 |
| Boston-Cambridge-Nashua, MA-NH | 850 | 0.33 | 0.88 | $ 36.05 | $ 74,990 |
| San Jose-Sunnyvale-Santa Clara, CA | 340 | 0.32 | 0.86 | $ 35.99 | $ 74,850 |
| Philadelphia-Camden-Wilmington, PA-NJ-DE-MD | 500 | 0.19 | 0.51 | $ 35.43 | $ 73,700 |
| San Francisco-Oakland-Hayward, CA | 920 | 0.41 | 1.10 | $ 35.24 | $ 73,310 |
| Atlantic City-Hammonton, NJ | 30 | 0.28 | 0.75 | $ 34.92 | $ 72,630 |
| Seattle-Tacoma-Bellevue, WA | 1,210 | 0.63 | 1.69 | $ 34.60 | $ 71,970 |
| New York-Newark-Jersey City, NY-NJ-PA | 2,560 | 0.30 | 0.79 | $ 34.03 | $ 70,790 |
Nonmetropolitan areas with the highest employment in Glaziers:
| Nonmetropolitan area | Employment (1) | Employment per thousand jobs | Location quotient (9) | Hourly mean wage | Annual mean wage (2) |
|---|---|---|---|---|---|
| Northwest Colorado nonmetropolitan area | 110 | 0.93 | 2.48 | $ 21.73 | $ 45,190 |
| Southwest Colorado nonmetropolitan area | 110 | 1.09 | 2.91 | $ 20.85 | $ 43,370 |
| North Texas Region of Texas nonmetropolitan area | 90 | 0.34 | 0.91 | $ 17.35 | $ 36,090 |
| West Northwestern Ohio nonmetropolitan area | 90 | 0.36 | 0.97 | $ 30.57 | $ 63,590 |
| Southwest Montana nonmetropolitan area | 90 | 0.62 | 1.66 | $ 25.58 | $ 53,210 |
Nonmetropolitan areas with the highest concentration of jobs and location quotients in Glaziers:
| Nonmetropolitan area | Employment (1) | Employment per thousand jobs | Location quotient (9) | Hourly mean wage | Annual mean wage (2) |
|---|---|---|---|---|---|
| Southwest Colorado nonmetropolitan area | 110 | 1.09 | 2.91 | $ 20.85 | $ 43,370 |
| Northwest Colorado nonmetropolitan area | 110 | 0.93 | 2.48 | $ 21.73 | $ 45,190 |
| Central New Hampshire nonmetropolitan area | 60 | 0.63 | 1.68 | $ 27.52 | $ 57,240 |
| Southwest Montana nonmetropolitan area | 90 | 0.62 | 1.66 | $ 25.58 | $ 53,210 |
| Southwest Iowa nonmetropolitan area | 50 | 0.62 | 1.66 | $ 19.93 | $ 41,460 |
Top paying nonmetropolitan areas for Glaziers:
| Nonmetropolitan area | Employment (1) | Employment per thousand jobs | Location quotient (9) | Hourly mean wage | Annual mean wage (2) |
|---|---|---|---|---|---|
| Hawaii / Kauai nonmetropolitan area | 50 | 0.56 | 1.50 | $ 36.86 | $ 76,680 |
| Central East New York nonmetropolitan area | 30 | 0.21 | 0.56 | $ 31.18 | $ 64,840 |
| West Northwestern Ohio nonmetropolitan area | 90 | 0.36 | 0.97 | $ 30.57 | $ 63,590 |
| Central New Hampshire nonmetropolitan area | 60 | 0.63 | 1.68 | $ 27.52 | $ 57,240 |
| Northwest Lower Peninsula of Michigan nonmetropolitan area | 50 | 0.46 | 1.23 | $ 26.72 | $ 55,580 |
These estimates are calculated with data collected from employers in all industry sectors, all metropolitan and nonmetropolitan areas, and all states and the District of Columbia. The top employment and wage figures are provided above. The complete list is available in the downloadable XLS files.
The percentile wage estimate is the value of a wage below which a certain percent of workers fall. The median wage is the 50th percentile wage estimate—50 percent of workers earn less than the median and 50 percent of workers earn more than the median. More about percentile wages.
(1) Estimates for detailed occupations do not sum to the totals because the totals include occupations not shown separately. Estimates do not include self-employed workers.
(2) Annual wages have been calculated by multiplying the hourly mean wage by a "year-round, full-time" hours figure of 2,080 hours; for those occupations where there is not an hourly wage published, the annual wage has been directly calculated from the reported survey data.
(3) The relative standard error (RSE) is a measure of the reliability of a survey statistic. The smaller the relative standard error, the more precise the estimate.
(7) The value is less than .005 percent of industry employment.
(8) Estimate not released.
(9) The location quotient is the ratio of the area concentration of occupational employment to the national average concentration. A location quotient greater than one indicates the occupation has a higher share of employment than average, and a location quotient less than one indicates the occupation is less prevalent in the area than average.
Other OEWS estimates and related information:
May 2021 National Occupational Employment and Wage Estimates
May 2021 State Occupational Employment and Wage Estimates
May 2021 Metropolitan and Nonmetropolitan Area Occupational Employment and Wage Estimates
May 2021 National Industry-Specific Occupational Employment and Wage Estimates
Last Modified Date: March 31, 2022