
An official website of the United States government
An official website of the United States government
The .gov means it's official.
Federal government websites often end in .gov or .mil. Before sharing sensitive information,
make sure you're on a federal government site.
The site is secure.
The
https:// ensures that you are connecting to the official website and that any
information you provide is encrypted and transmitted securely.
Line and cover structures with insulating materials. May work with batt, roll, or blown insulation materials.
Employment estimate and mean wage estimates for Insulation Workers, Floor, Ceiling, and Wall:
| Employment (1) | Employment RSE (3) |
Mean hourly wage |
Mean annual wage (2) |
Wage RSE (3) |
|---|---|---|---|---|
| 30,360 | 3.9 % | $ 21.54 | $ 44,810 | 1.5 % |
Percentile wage estimates for Insulation Workers, Floor, Ceiling, and Wall:
| Percentile | 10% | 25% | 50% (Median) |
75% | 90% |
|---|---|---|---|---|---|
| Hourly Wage | $ 14.00 | $ 16.44 | $ 19.17 | $ 23.49 | $ 31.83 |
| Annual Wage (2) | $ 29,120 | $ 34,200 | $ 39,880 | $ 48,850 | $ 66,210 |
Industries with the highest published employment and wages for Insulation Workers, Floor, Ceiling, and Wall are provided. For a list of all industries with employment in Insulation Workers, Floor, Ceiling, and Wall, see the Create Customized Tables function.
Industries with the highest levels of employment in Insulation Workers, Floor, Ceiling, and Wall:
| Industry | Employment (1) | Percent of industry employment | Hourly mean wage | Annual mean wage (2) |
|---|---|---|---|---|
| Building Finishing Contractors | 21,590 | 2.67 | $ 20.84 | $ 43,340 |
| Building Equipment Contractors | 4,250 | 0.19 | $ 24.44 | $ 50,840 |
| Residential Building Construction | 1,230 | 0.15 | $ 21.64 | $ 45,000 |
| Nonresidential Building Construction | 580 | 0.07 | $ 28.31 | $ 58,890 |
| Other Specialty Trade Contractors | 450 | 0.06 | $ 20.95 | $ 43,580 |
Industries with the highest concentration of employment in Insulation Workers, Floor, Ceiling, and Wall:
| Industry | Employment (1) | Percent of industry employment | Hourly mean wage | Annual mean wage (2) |
|---|---|---|---|---|
| Building Finishing Contractors | 21,590 | 2.67 | $ 20.84 | $ 43,340 |
| Building Equipment Contractors | 4,250 | 0.19 | $ 24.44 | $ 50,840 |
| Residential Building Construction | 1,230 | 0.15 | $ 21.64 | $ 45,000 |
| Remediation and Other Waste Management Services | 160 | 0.10 | $ 31.00 | $ 64,470 |
| Nonresidential Building Construction | 580 | 0.07 | $ 28.31 | $ 58,890 |
Top paying industries for Insulation Workers, Floor, Ceiling, and Wall:
| Industry | Employment (1) | Percent of industry employment | Hourly mean wage | Annual mean wage (2) |
|---|---|---|---|---|
| Colleges, Universities, and Professional Schools | 40 | (7) | $ 43.21 | $ 89,870 |
| Utility System Construction | (8) | (8) | $ 31.79 | $ 66,120 |
| Remediation and Other Waste Management Services | 160 | 0.10 | $ 31.00 | $ 64,470 |
| Nonresidential Building Construction | 580 | 0.07 | $ 28.31 | $ 58,890 |
| Building Equipment Contractors | 4,250 | 0.19 | $ 24.44 | $ 50,840 |
States and areas with the highest published employment, location quotients, and wages for Insulation Workers, Floor, Ceiling, and Wall are provided. For a list of all areas with employment in Insulation Workers, Floor, Ceiling, and Wall, see the Create Customized Tables function.
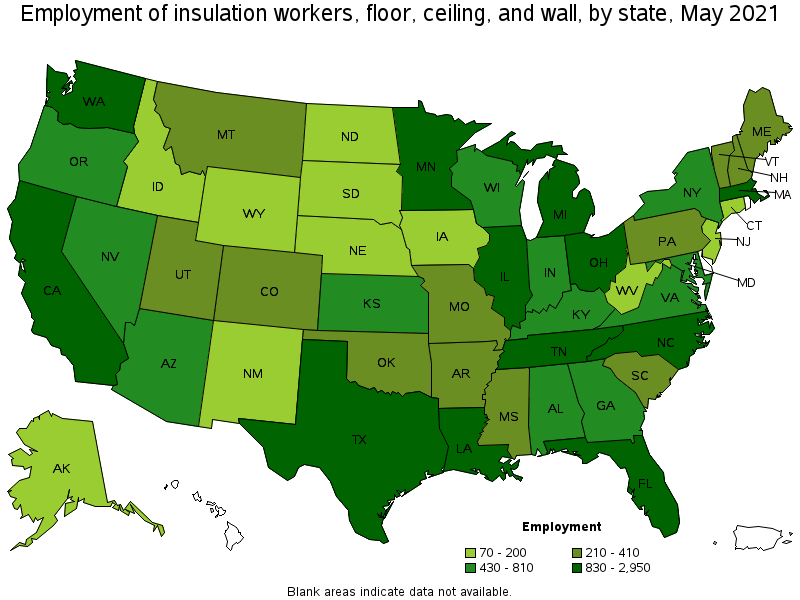
States with the highest employment level in Insulation Workers, Floor, Ceiling, and Wall:
| State | Employment (1) | Employment per thousand jobs | Location quotient (9) | Hourly mean wage | Annual mean wage (2) |
|---|---|---|---|---|---|
| Texas | 2,950 | 0.24 | 1.12 | $ 20.06 | $ 41,720 |
| Florida | 2,260 | 0.26 | 1.22 | $ 18.47 | $ 38,430 |
| California | 2,060 | 0.12 | 0.58 | $ 25.63 | $ 53,300 |
| Ohio | 1,390 | 0.27 | 1.24 | $ 23.34 | $ 48,550 |
| Louisiana | 1,330 | 0.74 | 3.45 | $ 18.39 | $ 38,250 |
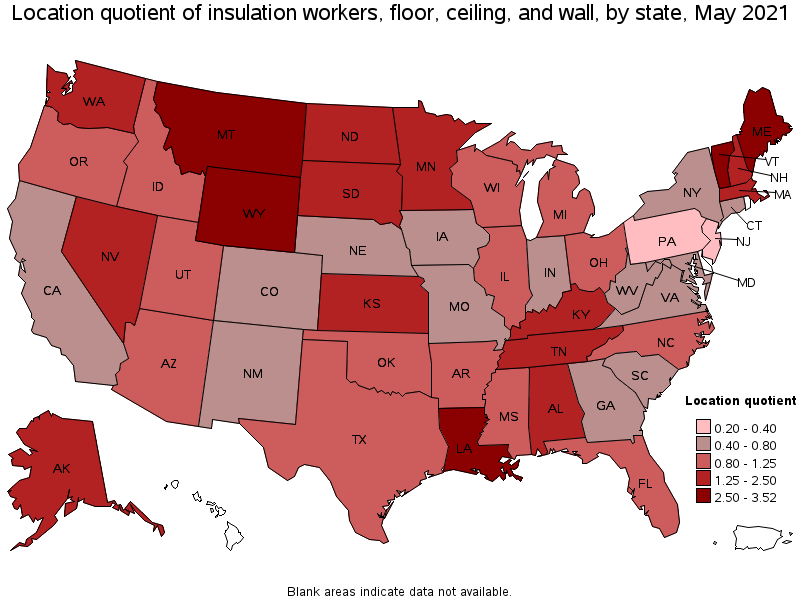
States with the highest concentration of jobs and location quotients in Insulation Workers, Floor, Ceiling, and Wall:
| State | Employment (1) | Employment per thousand jobs | Location quotient (9) | Hourly mean wage | Annual mean wage (2) |
|---|---|---|---|---|---|
| Montana | 360 | 0.76 | 3.52 | $ 16.77 | $ 34,890 |
| Louisiana | 1,330 | 0.74 | 3.45 | $ 18.39 | $ 38,250 |
| Vermont | 210 | 0.73 | 3.40 | $ 19.53 | $ 40,610 |
| Wyoming | 170 | 0.65 | 3.02 | $ 17.68 | $ 36,770 |
| Maine | 370 | 0.63 | 2.90 | $ 17.44 | $ 36,270 |
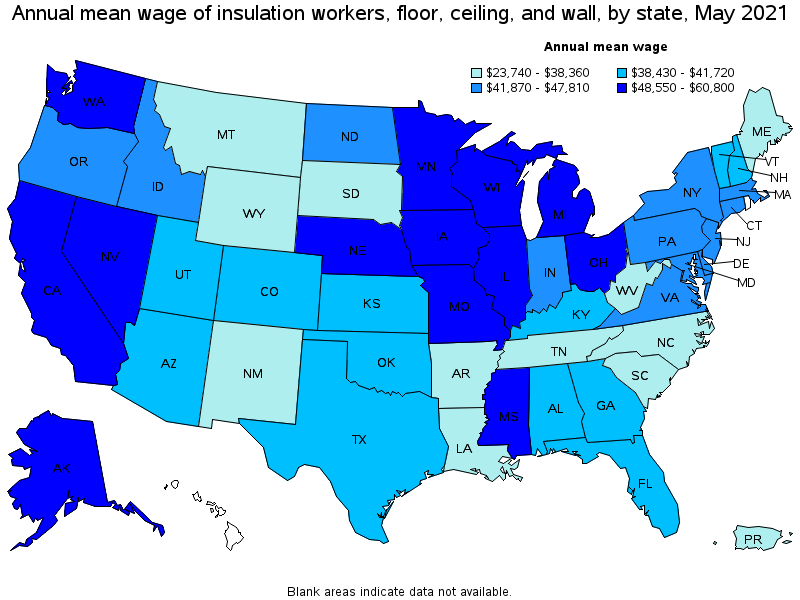
Top paying states for Insulation Workers, Floor, Ceiling, and Wall:
| State | Employment (1) | Employment per thousand jobs | Location quotient (9) | Hourly mean wage | Annual mean wage (2) |
|---|---|---|---|---|---|
| Washington | 1,230 | 0.38 | 1.78 | $ 29.23 | $ 60,800 |
| Illinois | 1,140 | 0.20 | 0.94 | $ 28.40 | $ 59,080 |
| Alaska | 110 | 0.37 | 1.70 | $ 27.71 | $ 57,630 |
| Nevada | 440 | 0.34 | 1.58 | $ 26.46 | $ 55,030 |
| Wisconsin | 680 | 0.25 | 1.15 | $ 26.07 | $ 54,230 |
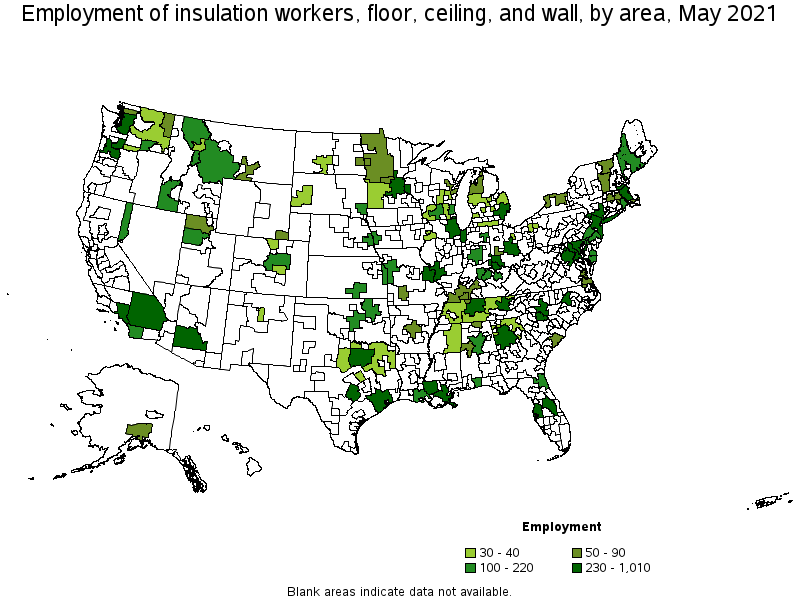
Metropolitan areas with the highest employment level in Insulation Workers, Floor, Ceiling, and Wall:
| Metropolitan area | Employment (1) | Employment per thousand jobs | Location quotient (9) | Hourly mean wage | Annual mean wage (2) |
|---|---|---|---|---|---|
| Houston-The Woodlands-Sugar Land, TX | 1,010 | 0.35 | 1.62 | $ 20.39 | $ 42,420 |
| Chicago-Naperville-Elgin, IL-IN-WI | 920 | 0.22 | 1.01 | $ 29.40 | $ 61,160 |
| Boston-Cambridge-Nashua, MA-NH | 840 | 0.33 | 1.51 | $ 22.63 | $ 47,070 |
| Dallas-Fort Worth-Arlington, TX | 740 | 0.21 | 0.96 | $ 20.38 | $ 42,390 |
| Seattle-Tacoma-Bellevue, WA | 700 | 0.37 | 1.70 | $ 32.45 | $ 67,500 |
| Baton Rouge, LA | 620 | 1.68 | 7.78 | $ 20.10 | $ 41,810 |
| Phoenix-Mesa-Scottsdale, AZ | 600 | 0.28 | 1.31 | $ 18.82 | $ 39,140 |
| New York-Newark-Jersey City, NY-NJ-PA | 590 | 0.07 | 0.32 | $ 25.67 | $ 53,390 |
| Washington-Arlington-Alexandria, DC-VA-MD-WV | 550 | 0.19 | 0.87 | $ 23.68 | $ 49,260 |
| Minneapolis-St. Paul-Bloomington, MN-WI | 530 | 0.29 | 1.35 | $ 25.52 | $ 53,070 |
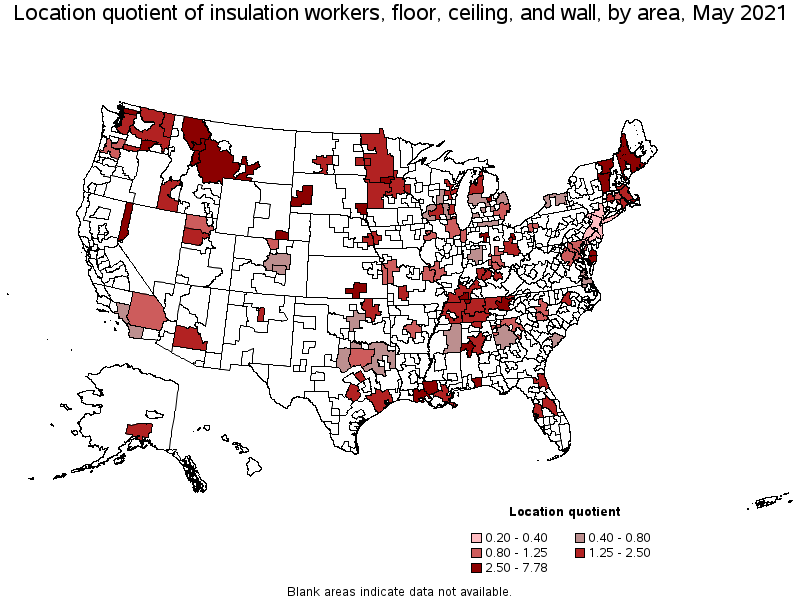
Metropolitan areas with the highest concentration of jobs and location quotients in Insulation Workers, Floor, Ceiling, and Wall:
| Metropolitan area | Employment (1) | Employment per thousand jobs | Location quotient (9) | Hourly mean wage | Annual mean wage (2) |
|---|---|---|---|---|---|
| Baton Rouge, LA | 620 | 1.68 | 7.78 | $ 20.10 | $ 41,810 |
| Cheyenne, WY | 60 | 1.28 | 5.92 | $ 16.89 | $ 35,140 |
| Kennewick-Richland, WA | 130 | 1.11 | 5.16 | $ 28.04 | $ 58,310 |
| Mount Vernon-Anacortes, WA | 50 | 1.08 | 5.00 | $ 25.50 | $ 53,050 |
| Pensacola-Ferry Pass-Brent, FL | 170 | 0.99 | 4.60 | $ 19.04 | $ 39,610 |
| Midland, MI | 30 | 0.94 | 4.34 | $ 22.08 | $ 45,920 |
| Tuscaloosa, AL | 90 | 0.91 | 4.22 | $ 19.10 | $ 39,730 |
| Mansfield, OH | 40 | 0.90 | 4.18 | $ 19.40 | $ 40,350 |
| Clarksville, TN-KY | 80 | 0.87 | 4.06 | $ 14.78 | $ 30,750 |
| Wichita, KS | 210 | 0.74 | 3.44 | $ 19.08 | $ 39,690 |
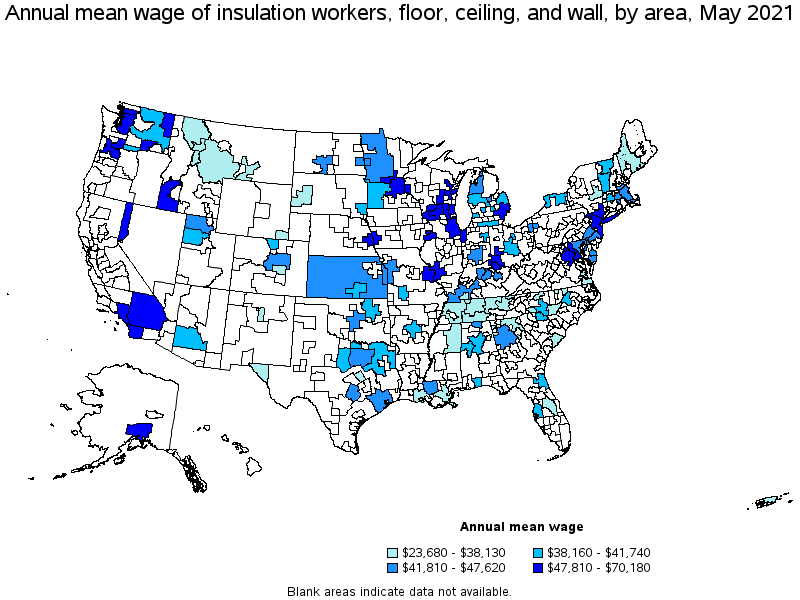
Top paying metropolitan areas for Insulation Workers, Floor, Ceiling, and Wall:
| Metropolitan area | Employment (1) | Employment per thousand jobs | Location quotient (9) | Hourly mean wage | Annual mean wage (2) |
|---|---|---|---|---|---|
| St. Cloud, MN | 60 | 0.66 | 3.05 | $ 33.74 | $ 70,180 |
| Seattle-Tacoma-Bellevue, WA | 700 | 0.37 | 1.70 | $ 32.45 | $ 67,500 |
| Chicago-Naperville-Elgin, IL-IN-WI | 920 | 0.22 | 1.01 | $ 29.40 | $ 61,160 |
| Milwaukee-Waukesha-West Allis, WI | 220 | 0.27 | 1.27 | $ 28.73 | $ 59,750 |
| Kennewick-Richland, WA | 130 | 1.11 | 5.16 | $ 28.04 | $ 58,310 |
| Madison, WI | 110 | 0.29 | 1.35 | $ 27.46 | $ 57,120 |
| Los Angeles-Long Beach-Anaheim, CA | 520 | 0.09 | 0.42 | $ 26.98 | $ 56,110 |
| Appleton, WI | 40 | 0.35 | 1.61 | $ 26.80 | $ 55,750 |
| St. Louis, MO-IL | 240 | 0.19 | 0.88 | $ 26.71 | $ 55,550 |
| Anchorage, AK | 70 | 0.40 | 1.87 | $ 26.65 | $ 55,430 |
Nonmetropolitan areas with the highest employment in Insulation Workers, Floor, Ceiling, and Wall:
| Nonmetropolitan area | Employment (1) | Employment per thousand jobs | Location quotient (9) | Hourly mean wage | Annual mean wage (2) |
|---|---|---|---|---|---|
| Southwest Montana nonmetropolitan area | 140 | 0.99 | 4.58 | $ 17.00 | $ 35,370 |
| Southwest Maine nonmetropolitan area | 120 | 0.68 | 3.17 | $ 16.92 | $ 35,190 |
| West Montana nonmetropolitan area | 100 | 1.30 | 6.02 | $ 15.92 | $ 33,110 |
| Southern Vermont nonmetropolitan area | 70 | 0.70 | 3.24 | $ 20.06 | $ 41,730 |
| Northwest Minnesota nonmetropolitan area | 60 | 0.35 | 1.64 | $ 20.77 | $ 43,200 |
Nonmetropolitan areas with the highest concentration of jobs and location quotients in Insulation Workers, Floor, Ceiling, and Wall:
| Nonmetropolitan area | Employment (1) | Employment per thousand jobs | Location quotient (9) | Hourly mean wage | Annual mean wage (2) |
|---|---|---|---|---|---|
| West Montana nonmetropolitan area | 100 | 1.30 | 6.02 | $ 15.92 | $ 33,110 |
| Southwest Montana nonmetropolitan area | 140 | 0.99 | 4.58 | $ 17.00 | $ 35,370 |
| Northern Vermont nonmetropolitan area | 50 | 0.81 | 3.77 | $ 18.67 | $ 38,830 |
| Southern Vermont nonmetropolitan area | 70 | 0.70 | 3.24 | $ 20.06 | $ 41,730 |
| Southwest Maine nonmetropolitan area | 120 | 0.68 | 3.17 | $ 16.92 | $ 35,190 |
Top paying nonmetropolitan areas for Insulation Workers, Floor, Ceiling, and Wall:
| Nonmetropolitan area | Employment (1) | Employment per thousand jobs | Location quotient (9) | Hourly mean wage | Annual mean wage (2) |
|---|---|---|---|---|---|
| South Central Wisconsin nonmetropolitan area | 30 | 0.16 | 0.72 | $ 24.07 | $ 50,070 |
| West Kentucky nonmetropolitan area | 60 | 0.40 | 1.86 | $ 21.51 | $ 44,740 |
| Northwest Lower Peninsula of Michigan nonmetropolitan area | 50 | 0.46 | 2.14 | $ 21.18 | $ 44,040 |
| Northwest Minnesota nonmetropolitan area | 60 | 0.35 | 1.64 | $ 20.77 | $ 43,200 |
| Kansas nonmetropolitan area | (8) | (8) | (8) | $ 20.22 | $ 42,050 |
These estimates are calculated with data collected from employers in all industry sectors, all metropolitan and nonmetropolitan areas, and all states and the District of Columbia. The top employment and wage figures are provided above. The complete list is available in the downloadable XLS files.
The percentile wage estimate is the value of a wage below which a certain percent of workers fall. The median wage is the 50th percentile wage estimate—50 percent of workers earn less than the median and 50 percent of workers earn more than the median. More about percentile wages.
(1) Estimates for detailed occupations do not sum to the totals because the totals include occupations not shown separately. Estimates do not include self-employed workers.
(2) Annual wages have been calculated by multiplying the hourly mean wage by a "year-round, full-time" hours figure of 2,080 hours; for those occupations where there is not an hourly wage published, the annual wage has been directly calculated from the reported survey data.
(3) The relative standard error (RSE) is a measure of the reliability of a survey statistic. The smaller the relative standard error, the more precise the estimate.
(7) The value is less than .005 percent of industry employment.
(8) Estimate not released.
(9) The location quotient is the ratio of the area concentration of occupational employment to the national average concentration. A location quotient greater than one indicates the occupation has a higher share of employment than average, and a location quotient less than one indicates the occupation is less prevalent in the area than average.
Other OEWS estimates and related information:
May 2021 National Occupational Employment and Wage Estimates
May 2021 State Occupational Employment and Wage Estimates
May 2021 Metropolitan and Nonmetropolitan Area Occupational Employment and Wage Estimates
May 2021 National Industry-Specific Occupational Employment and Wage Estimates
Last Modified Date: March 31, 2022