
An official website of the United States government
An official website of the United States government
The .gov means it's official.
Federal government websites often end in .gov or .mil. Before sharing sensitive information,
make sure you're on a federal government site.
The site is secure.
The
https:// ensures that you are connecting to the official website and that any
information you provide is encrypted and transmitted securely.
Paint walls, equipment, buildings, bridges, and other structural surfaces, using brushes, rollers, and spray guns. May remove old paint to prepare surface prior to painting. May mix colors or oils to obtain desired color or consistency. Excludes �Paperhangers� (47-2142).
Employment estimate and mean wage estimates for Painters, Construction and Maintenance:
| Employment (1) | Employment RSE (3) |
Mean hourly wage |
Mean annual wage (2) |
Wage RSE (3) |
|---|---|---|---|---|
| 214,220 | 1.3 % | $ 22.66 | $ 47,140 | 0.6 % |
Percentile wage estimates for Painters, Construction and Maintenance:
| Percentile | 10% | 25% | 50% (Median) |
75% | 90% |
|---|---|---|---|---|---|
| Hourly Wage | $ 14.31 | $ 17.75 | $ 21.92 | $ 25.63 | $ 33.93 |
| Annual Wage (2) | $ 29,770 | $ 36,920 | $ 45,590 | $ 53,310 | $ 70,570 |
Industries with the highest published employment and wages for Painters, Construction and Maintenance are provided. For a list of all industries with employment in Painters, Construction and Maintenance, see the Create Customized Tables function.
Industries with the highest levels of employment in Painters, Construction and Maintenance:
| Industry | Employment (1) | Percent of industry employment | Hourly mean wage | Annual mean wage (2) |
|---|---|---|---|---|
| Building Finishing Contractors | 147,670 | 18.25 | $ 22.20 | $ 46,180 |
| Residential Building Construction | 12,560 | 1.49 | $ 21.44 | $ 44,600 |
| Real Estate | 5,730 | 0.34 | $ 19.53 | $ 40,630 |
| Nonresidential Building Construction | 4,930 | 0.63 | $ 26.67 | $ 55,470 |
| Employment Services | 4,910 | 0.14 | $ 19.52 | $ 40,600 |
Industries with the highest concentration of employment in Painters, Construction and Maintenance:
| Industry | Employment (1) | Percent of industry employment | Hourly mean wage | Annual mean wage (2) |
|---|---|---|---|---|
| Building Finishing Contractors | 147,670 | 18.25 | $ 22.20 | $ 46,180 |
| Residential Building Construction | 12,560 | 1.49 | $ 21.44 | $ 44,600 |
| Highway, Street, and Bridge Construction | 3,320 | 0.93 | $ 27.45 | $ 57,100 |
| Ship and Boat Building | 1,160 | 0.80 | $ 24.53 | $ 51,020 |
| Nonresidential Building Construction | 4,930 | 0.63 | $ 26.67 | $ 55,470 |
Top paying industries for Painters, Construction and Maintenance:
| Industry | Employment (1) | Percent of industry employment | Hourly mean wage | Annual mean wage (2) |
|---|---|---|---|---|
| Electric Power Generation, Transmission and Distribution | 70 | 0.02 | $ 38.93 | $ 80,970 |
| Restaurants and Other Eating Places | (8) | (8) | $ 36.13 | $ 75,150 |
| General Merchandise Stores | 70 | (7) | $ 35.78 | $ 74,420 |
| Scientific Research and Development Services | 80 | 0.01 | $ 34.82 | $ 72,430 |
| Local Government, excluding schools and hospitals (OEWS Designation) | 3,310 | 0.06 | $ 32.24 | $ 67,050 |
States and areas with the highest published employment, location quotients, and wages for Painters, Construction and Maintenance are provided. For a list of all areas with employment in Painters, Construction and Maintenance, see the Create Customized Tables function.
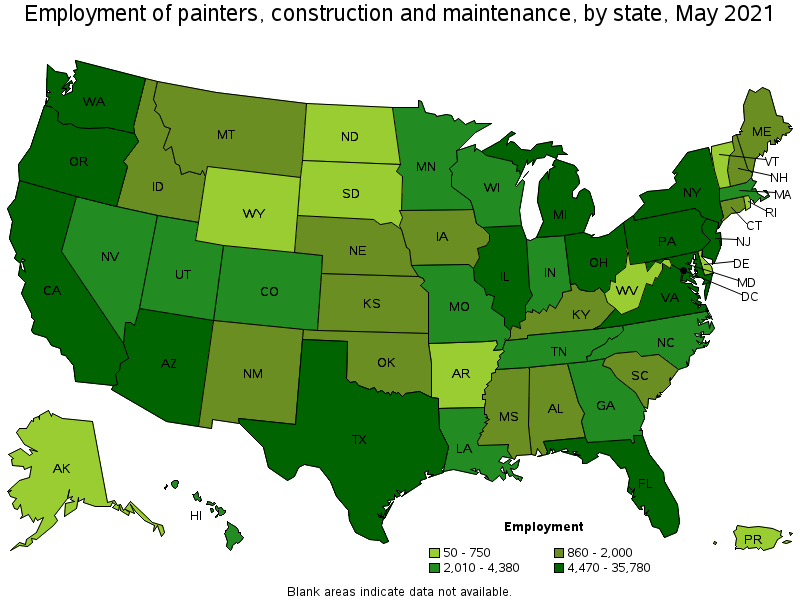
States with the highest employment level in Painters, Construction and Maintenance:
| State | Employment (1) | Employment per thousand jobs | Location quotient (9) | Hourly mean wage | Annual mean wage (2) |
|---|---|---|---|---|---|
| California | 35,780 | 2.16 | 1.42 | $ 25.98 | $ 54,030 |
| Florida | 18,850 | 2.19 | 1.44 | $ 18.62 | $ 38,740 |
| Texas | 16,220 | 1.33 | 0.87 | $ 18.57 | $ 38,630 |
| New York | 12,100 | 1.40 | 0.92 | $ 29.25 | $ 60,840 |
| Washington | 8,630 | 2.69 | 1.77 | $ 25.80 | $ 53,670 |
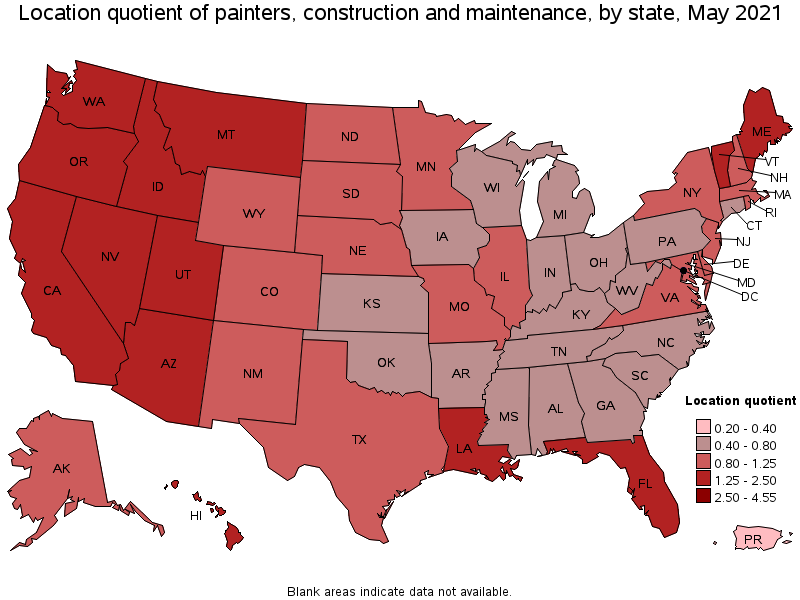
States with the highest concentration of jobs and location quotients in Painters, Construction and Maintenance:
| State | Employment (1) | Employment per thousand jobs | Location quotient (9) | Hourly mean wage | Annual mean wage (2) |
|---|---|---|---|---|---|
| Hawaii | 2,010 | 3.67 | 2.41 | $ 28.40 | $ 59,070 |
| Nevada | 4,320 | 3.35 | 2.20 | $ 22.47 | $ 46,740 |
| Maine | 1,620 | 2.74 | 1.80 | $ 22.03 | $ 45,820 |
| Washington | 8,630 | 2.69 | 1.77 | $ 25.80 | $ 53,670 |
| Idaho | 2,000 | 2.64 | 1.74 | $ 18.16 | $ 37,770 |
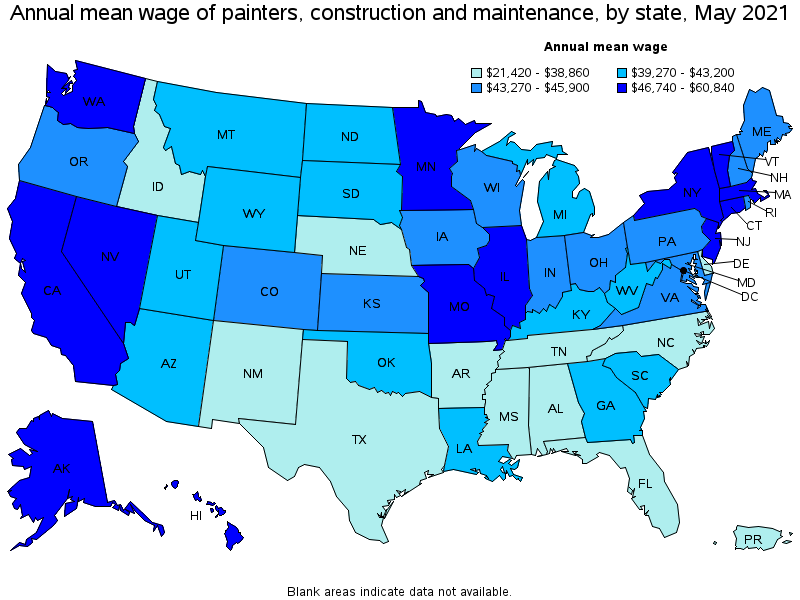
Top paying states for Painters, Construction and Maintenance:
| State | Employment (1) | Employment per thousand jobs | Location quotient (9) | Hourly mean wage | Annual mean wage (2) |
|---|---|---|---|---|---|
| New York | 12,100 | 1.40 | 0.92 | $ 29.25 | $ 60,840 |
| Hawaii | 2,010 | 3.67 | 2.41 | $ 28.40 | $ 59,070 |
| Illinois | 7,310 | 1.30 | 0.86 | $ 28.09 | $ 58,430 |
| New Jersey | 5,270 | 1.37 | 0.90 | $ 27.21 | $ 56,600 |
| Alaska | 450 | 1.51 | 0.99 | $ 26.14 | $ 54,360 |
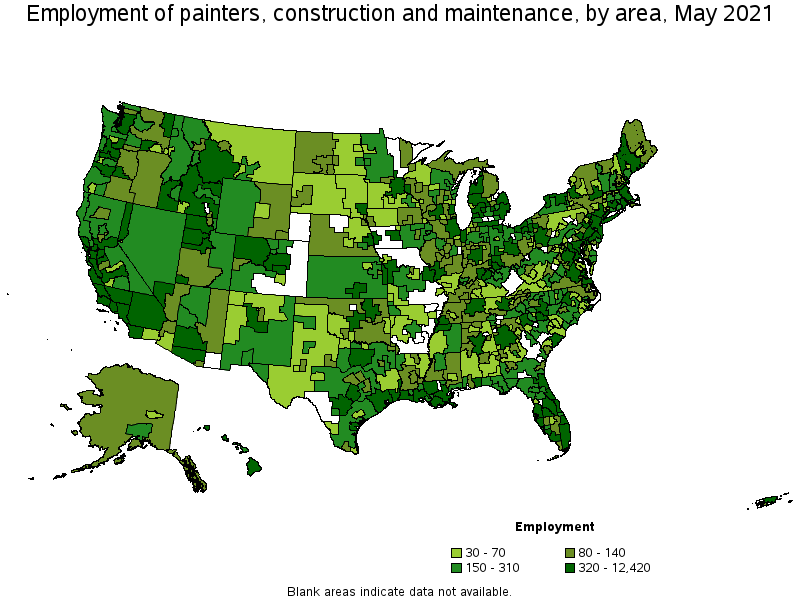
Metropolitan areas with the highest employment level in Painters, Construction and Maintenance:
| Metropolitan area | Employment (1) | Employment per thousand jobs | Location quotient (9) | Hourly mean wage | Annual mean wage (2) |
|---|---|---|---|---|---|
| New York-Newark-Jersey City, NY-NJ-PA | 12,420 | 1.43 | 0.94 | $ 30.05 | $ 62,490 |
| Los Angeles-Long Beach-Anaheim, CA | 10,320 | 1.80 | 1.19 | $ 25.30 | $ 52,620 |
| Chicago-Naperville-Elgin, IL-IN-WI | 6,020 | 1.42 | 0.94 | $ 28.17 | $ 58,600 |
| San Francisco-Oakland-Hayward, CA | 5,950 | 2.66 | 1.75 | $ 29.99 | $ 62,380 |
| Houston-The Woodlands-Sugar Land, TX | 5,610 | 1.93 | 1.27 | $ 19.02 | $ 39,560 |
| Miami-Fort Lauderdale-West Palm Beach, FL | 5,080 | 2.07 | 1.36 | $ 18.63 | $ 38,750 |
| Seattle-Tacoma-Bellevue, WA | 5,030 | 2.62 | 1.73 | $ 26.82 | $ 55,780 |
| Phoenix-Mesa-Scottsdale, AZ | 4,580 | 2.16 | 1.42 | $ 20.85 | $ 43,360 |
| San Diego-Carlsbad, CA | 3,970 | 2.86 | 1.88 | $ 24.11 | $ 50,160 |
| Dallas-Fort Worth-Arlington, TX | 3,720 | 1.04 | 0.68 | $ 18.86 | $ 39,240 |
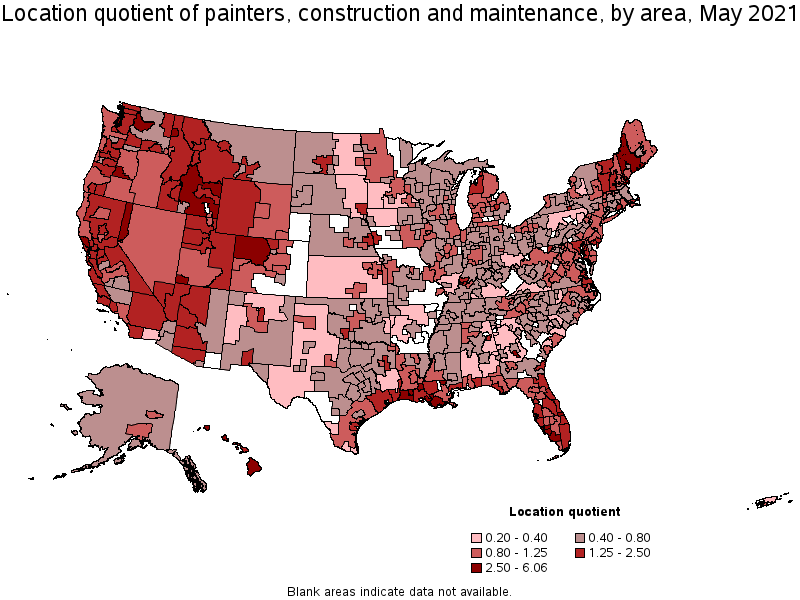
Metropolitan areas with the highest concentration of jobs and location quotients in Painters, Construction and Maintenance:
| Metropolitan area | Employment (1) | Employment per thousand jobs | Location quotient (9) | Hourly mean wage | Annual mean wage (2) |
|---|---|---|---|---|---|
| Bremerton-Silverdale, WA | 800 | 9.22 | 6.06 | $ 26.59 | $ 55,310 |
| Naples-Immokalee-Marco Island, FL | 1,130 | 7.75 | 5.10 | $ 18.98 | $ 39,470 |
| Lake Charles, LA | 470 | 5.22 | 3.44 | $ 21.09 | $ 43,870 |
| Houma-Thibodaux, LA | 410 | 5.10 | 3.35 | $ 18.81 | $ 39,110 |
| Wenatchee, WA | 210 | 4.54 | 2.99 | $ 22.50 | $ 46,800 |
| Bend-Redmond, OR | 370 | 4.42 | 2.91 | $ 20.39 | $ 42,410 |
| Portsmouth, NH-ME | 380 | 4.28 | 2.81 | $ 24.37 | $ 50,680 |
| St. George, UT | 320 | 4.27 | 2.81 | $ 18.46 | $ 38,400 |
| Sebastian-Vero Beach, FL | 220 | 4.24 | 2.79 | $ 17.80 | $ 37,030 |
| Warner Robins, GA | 310 | 4.20 | 2.76 | $ 26.82 | $ 55,780 |
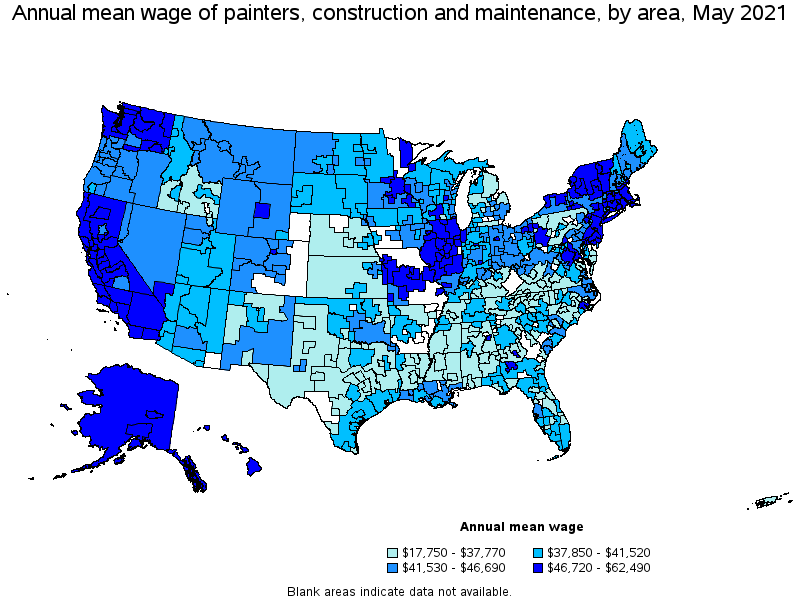
Top paying metropolitan areas for Painters, Construction and Maintenance:
| Metropolitan area | Employment (1) | Employment per thousand jobs | Location quotient (9) | Hourly mean wage | Annual mean wage (2) |
|---|---|---|---|---|---|
| New York-Newark-Jersey City, NY-NJ-PA | 12,420 | 1.43 | 0.94 | $ 30.05 | $ 62,490 |
| Champaign-Urbana, IL | 170 | 1.74 | 1.15 | $ 29.99 | $ 62,380 |
| San Francisco-Oakland-Hayward, CA | 5,950 | 2.66 | 1.75 | $ 29.99 | $ 62,380 |
| San Jose-Sunnyvale-Santa Clara, CA | 2,380 | 2.23 | 1.46 | $ 29.45 | $ 61,260 |
| Kankakee, IL | 40 | 0.93 | 0.61 | $ 29.08 | $ 60,490 |
| Urban Honolulu, HI | 1,520 | 3.84 | 2.52 | $ 28.78 | $ 59,870 |
| Springfield, IL | 120 | 1.27 | 0.84 | $ 28.58 | $ 59,440 |
| Kahului-Wailuku-Lahaina, HI | 160 | 2.46 | 1.62 | $ 28.57 | $ 59,430 |
| Decatur, IL | 80 | 1.72 | 1.13 | $ 28.51 | $ 59,300 |
| Peoria, IL | 150 | 0.97 | 0.64 | $ 28.37 | $ 59,000 |
Nonmetropolitan areas with the highest employment in Painters, Construction and Maintenance:
| Nonmetropolitan area | Employment (1) | Employment per thousand jobs | Location quotient (9) | Hourly mean wage | Annual mean wage (2) |
|---|---|---|---|---|---|
| Southwest Maine nonmetropolitan area | 820 | 4.50 | 2.96 | $ 22.45 | $ 46,690 |
| Northwest Colorado nonmetropolitan area | 540 | 4.64 | 3.05 | $ 21.69 | $ 45,120 |
| Balance of Lower Peninsula of Michigan nonmetropolitan area | 430 | 1.70 | 1.12 | $ 17.15 | $ 35,680 |
| Southwest Montana nonmetropolitan area | 380 | 2.77 | 1.82 | $ 21.14 | $ 43,960 |
| Southeast-Central Idaho nonmetropolitan area | 370 | 4.24 | 2.79 | $ 18.08 | $ 37,610 |
Nonmetropolitan areas with the highest concentration of jobs and location quotients in Painters, Construction and Maintenance:
| Nonmetropolitan area | Employment (1) | Employment per thousand jobs | Location quotient (9) | Hourly mean wage | Annual mean wage (2) |
|---|---|---|---|---|---|
| Northwest Colorado nonmetropolitan area | 540 | 4.64 | 3.05 | $ 21.69 | $ 45,120 |
| Southwest Maine nonmetropolitan area | 820 | 4.50 | 2.96 | $ 22.45 | $ 46,690 |
| Southeast-Central Idaho nonmetropolitan area | 370 | 4.24 | 2.79 | $ 18.08 | $ 37,610 |
| Southwest Louisiana nonmetropolitan area | 260 | 3.94 | 2.59 | $ 20.08 | $ 41,770 |
| Hawaii / Kauai nonmetropolitan area | 340 | 3.81 | 2.50 | $ 26.61 | $ 55,340 |
Top paying nonmetropolitan areas for Painters, Construction and Maintenance:
| Nonmetropolitan area | Employment (1) | Employment per thousand jobs | Location quotient (9) | Hourly mean wage | Annual mean wage (2) |
|---|---|---|---|---|---|
| Alaska nonmetropolitan area | 110 | 1.13 | 0.74 | $ 27.09 | $ 56,340 |
| West Central Illinois nonmetropolitan area | 140 | 0.91 | 0.60 | $ 26.85 | $ 55,840 |
| Hawaii / Kauai nonmetropolitan area | 340 | 3.81 | 2.50 | $ 26.61 | $ 55,340 |
| Northern Vermont nonmetropolitan area | 130 | 2.06 | 1.36 | $ 25.87 | $ 53,810 |
| North Coast Region of California nonmetropolitan area | 180 | 1.83 | 1.20 | $ 24.95 | $ 51,900 |
These estimates are calculated with data collected from employers in all industry sectors, all metropolitan and nonmetropolitan areas, and all states and the District of Columbia. The top employment and wage figures are provided above. The complete list is available in the downloadable XLS files.
The percentile wage estimate is the value of a wage below which a certain percent of workers fall. The median wage is the 50th percentile wage estimate—50 percent of workers earn less than the median and 50 percent of workers earn more than the median. More about percentile wages.
(1) Estimates for detailed occupations do not sum to the totals because the totals include occupations not shown separately. Estimates do not include self-employed workers.
(2) Annual wages have been calculated by multiplying the hourly mean wage by a "year-round, full-time" hours figure of 2,080 hours; for those occupations where there is not an hourly wage published, the annual wage has been directly calculated from the reported survey data.
(3) The relative standard error (RSE) is a measure of the reliability of a survey statistic. The smaller the relative standard error, the more precise the estimate.
(7) The value is less than .005 percent of industry employment.
(8) Estimate not released.
(9) The location quotient is the ratio of the area concentration of occupational employment to the national average concentration. A location quotient greater than one indicates the occupation has a higher share of employment than average, and a location quotient less than one indicates the occupation is less prevalent in the area than average.
Other OEWS estimates and related information:
May 2021 National Occupational Employment and Wage Estimates
May 2021 State Occupational Employment and Wage Estimates
May 2021 Metropolitan and Nonmetropolitan Area Occupational Employment and Wage Estimates
May 2021 National Industry-Specific Occupational Employment and Wage Estimates
Last Modified Date: March 31, 2022