
An official website of the United States government
An official website of the United States government
The .gov means it's official.
Federal government websites often end in .gov or .mil. Before sharing sensitive information,
make sure you're on a federal government site.
The site is secure.
The
https:// ensures that you are connecting to the official website and that any
information you provide is encrypted and transmitted securely.
Operate equipment to increase oil flow from producing wells or to remove stuck pipe, casing, tools, or other obstructions from drilling wells. Includes fishing-tool technicians.
Employment estimate and mean wage estimates for Service Unit Operators, Oil and Gas:
| Employment (1) | Employment RSE (3) |
Mean hourly wage |
Mean annual wage (2) |
Wage RSE (3) |
|---|---|---|---|---|
| 32,870 | 4.4 % | $ 26.76 | $ 55,660 | 1.4 % |
Percentile wage estimates for Service Unit Operators, Oil and Gas:
| Percentile | 10% | 25% | 50% (Median) |
75% | 90% |
|---|---|---|---|---|---|
| Hourly Wage | $ 15.72 | $ 18.26 | $ 23.28 | $ 29.99 | $ 38.15 |
| Annual Wage (2) | $ 32,700 | $ 37,990 | $ 48,410 | $ 62,370 | $ 79,340 |
Industries with the highest published employment and wages for Service Unit Operators, Oil and Gas are provided. For a list of all industries with employment in Service Unit Operators, Oil and Gas, see the Create Customized Tables function.
Industries with the highest levels of employment in Service Unit Operators, Oil and Gas:
| Industry | Employment (1) | Percent of industry employment | Hourly mean wage | Annual mean wage (2) |
|---|---|---|---|---|
| Support Activities for Mining | 21,940 | 10.34 | $ 24.71 | $ 51,390 |
| Oil and Gas Extraction | 6,460 | 6.07 | $ 35.23 | $ 73,270 |
| Rental and leasing services (5322, 5323, and 5324 only) | 900 | 0.31 | $ 22.89 | $ 47,620 |
| Natural Gas Distribution | 610 | 0.55 | $ 31.83 | $ 66,210 |
| Machinery Manufacturing (3331, 3332, 3334, and 3339 only) | 310 | 0.04 | $ 27.99 | $ 58,210 |
Industries with the highest concentration of employment in Service Unit Operators, Oil and Gas:
| Industry | Employment (1) | Percent of industry employment | Hourly mean wage | Annual mean wage (2) |
|---|---|---|---|---|
| Support Activities for Mining | 21,940 | 10.34 | $ 24.71 | $ 51,390 |
| Oil and Gas Extraction | 6,460 | 6.07 | $ 35.23 | $ 73,270 |
| Pipeline Transportation of Natural Gas | 170 | 0.57 | $ 27.85 | $ 57,940 |
| Natural Gas Distribution | 610 | 0.55 | $ 31.83 | $ 66,210 |
| Rental and leasing services (5322, 5323, and 5324 only) | 900 | 0.31 | $ 22.89 | $ 47,620 |
Top paying industries for Service Unit Operators, Oil and Gas:
| Industry | Employment (1) | Percent of industry employment | Hourly mean wage | Annual mean wage (2) |
|---|---|---|---|---|
| Oil and Gas Extraction | 6,460 | 6.07 | $ 35.23 | $ 73,270 |
| Natural Gas Distribution | 610 | 0.55 | $ 31.83 | $ 66,210 |
| Machinery, Equipment, and Supplies Merchant Wholesalers | 250 | 0.04 | $ 31.25 | $ 65,000 |
| Machinery Manufacturing (3331, 3332, 3334, and 3339 only) | 310 | 0.04 | $ 27.99 | $ 58,210 |
| Pipeline Transportation of Natural Gas | 170 | 0.57 | $ 27.85 | $ 57,940 |
States and areas with the highest published employment, location quotients, and wages for Service Unit Operators, Oil and Gas are provided. For a list of all areas with employment in Service Unit Operators, Oil and Gas, see the Create Customized Tables function.
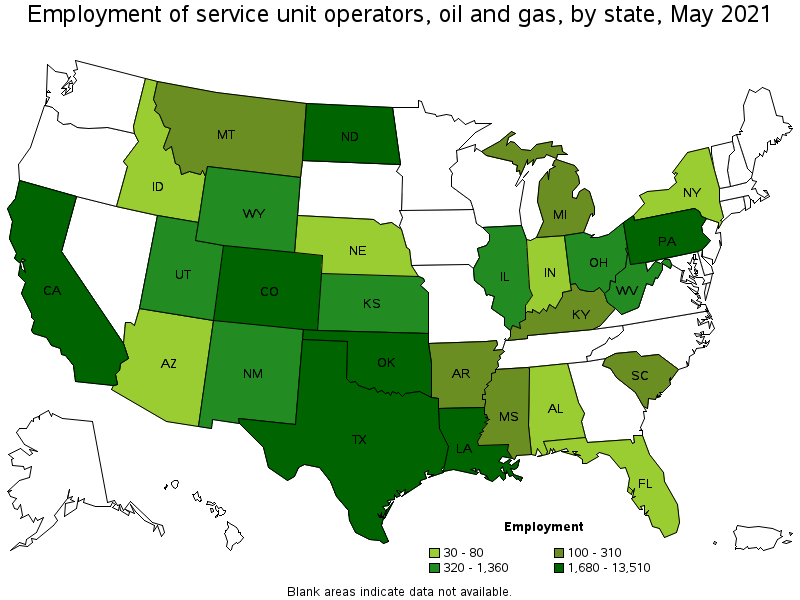
States with the highest employment level in Service Unit Operators, Oil and Gas:
| State | Employment (1) | Employment per thousand jobs | Location quotient (9) | Hourly mean wage | Annual mean wage (2) |
|---|---|---|---|---|---|
| Texas | 13,510 | 1.10 | 4.74 | $ 25.25 | $ 52,510 |
| North Dakota | 2,450 | 6.19 | 26.55 | $ 27.46 | $ 57,120 |
| Colorado | 2,150 | 0.82 | 3.52 | $ 27.75 | $ 57,710 |
| California | 1,920 | 0.12 | 0.50 | $ 30.02 | $ 62,440 |
| Oklahoma | 1,800 | 1.15 | 4.95 | $ 25.58 | $ 53,200 |
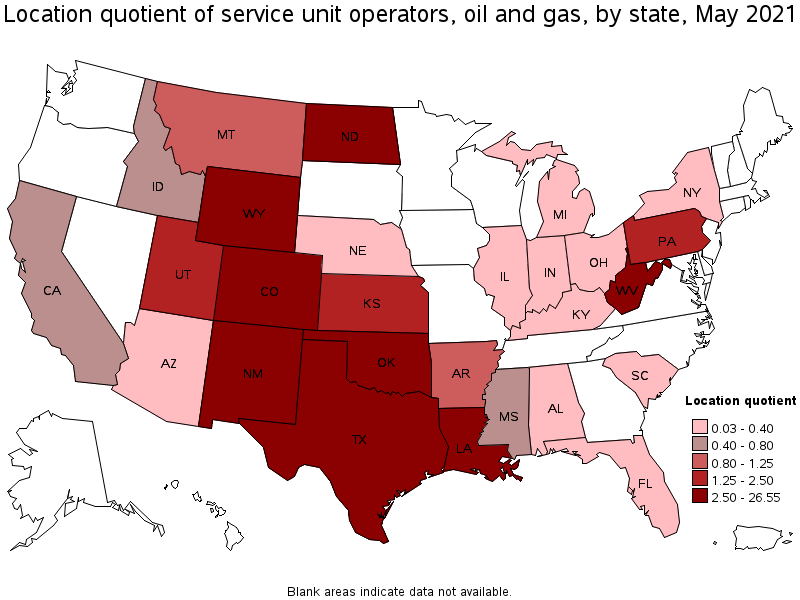
States with the highest concentration of jobs and location quotients in Service Unit Operators, Oil and Gas:
| State | Employment (1) | Employment per thousand jobs | Location quotient (9) | Hourly mean wage | Annual mean wage (2) |
|---|---|---|---|---|---|
| North Dakota | 2,450 | 6.19 | 26.55 | $ 27.46 | $ 57,120 |
| Wyoming | 890 | 3.43 | 14.72 | $ 28.59 | $ 59,470 |
| New Mexico | 1,360 | 1.75 | 7.50 | $ 31.32 | $ 65,150 |
| West Virginia | 760 | 1.15 | 4.95 | $ 29.23 | $ 60,790 |
| Oklahoma | 1,800 | 1.15 | 4.95 | $ 25.58 | $ 53,200 |
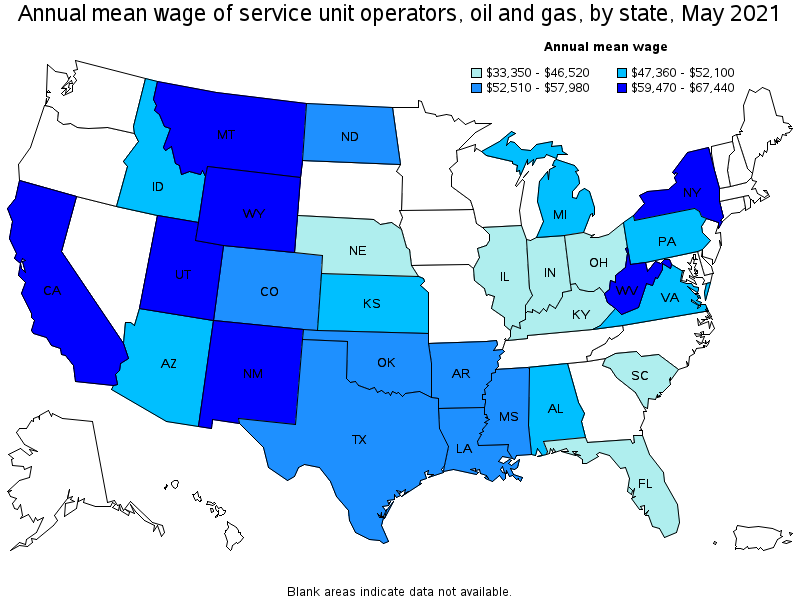
Top paying states for Service Unit Operators, Oil and Gas:
| State | Employment (1) | Employment per thousand jobs | Location quotient (9) | Hourly mean wage | Annual mean wage (2) |
|---|---|---|---|---|---|
| Utah | 470 | 0.30 | 1.29 | $ 32.42 | $ 67,440 |
| New Mexico | 1,360 | 1.75 | 7.50 | $ 31.32 | $ 65,150 |
| New York | 80 | 0.01 | 0.04 | $ 30.11 | $ 62,620 |
| California | 1,920 | 0.12 | 0.50 | $ 30.02 | $ 62,440 |
| Montana | 100 | 0.21 | 0.89 | $ 29.58 | $ 61,520 |
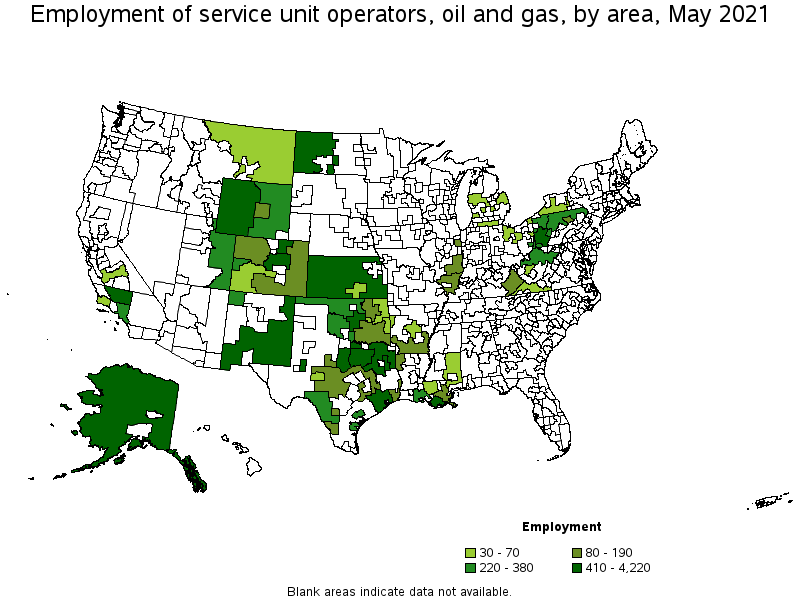
Metropolitan areas with the highest employment level in Service Unit Operators, Oil and Gas:
| Metropolitan area | Employment (1) | Employment per thousand jobs | Location quotient (9) | Hourly mean wage | Annual mean wage (2) |
|---|---|---|---|---|---|
| Houston-The Woodlands-Sugar Land, TX | 4,220 | 1.46 | 6.25 | $ 24.40 | $ 50,750 |
| Midland, TX | 2,350 | 24.71 | 105.92 | $ 24.20 | $ 50,340 |
| Bakersfield, CA | 1,020 | 3.28 | 14.06 | $ 29.54 | $ 61,440 |
| Dallas-Fort Worth-Arlington, TX | 1,000 | 0.28 | 1.19 | $ 27.25 | $ 56,680 |
| Greeley, CO | 1,000 | 9.77 | 41.89 | $ 26.40 | $ 54,910 |
| Pittsburgh, PA | 880 | 0.85 | 3.62 | $ 22.70 | $ 47,220 |
| Houma-Thibodaux, LA | 780 | 9.85 | 42.20 | $ 25.97 | $ 54,020 |
| Oklahoma City, OK | 670 | 1.10 | 4.72 | $ 26.01 | $ 54,100 |
| Denver-Aurora-Lakewood, CO | 560 | 0.38 | 1.64 | $ 29.81 | $ 61,990 |
| Longview, TX | 430 | 4.79 | 20.55 | $ 26.27 | $ 54,640 |
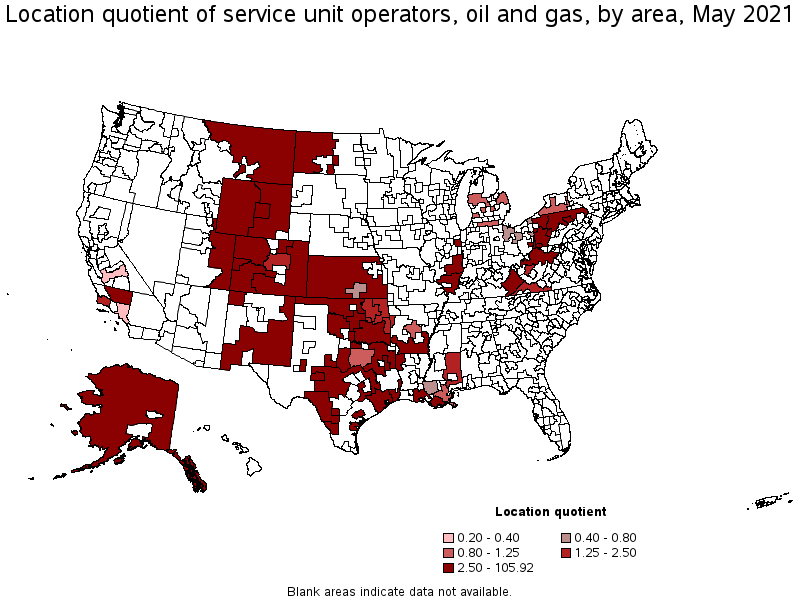
Metropolitan areas with the highest concentration of jobs and location quotients in Service Unit Operators, Oil and Gas:
| Metropolitan area | Employment (1) | Employment per thousand jobs | Location quotient (9) | Hourly mean wage | Annual mean wage (2) |
|---|---|---|---|---|---|
| Midland, TX | 2,350 | 24.71 | 105.92 | $ 24.20 | $ 50,340 |
| Houma-Thibodaux, LA | 780 | 9.85 | 42.20 | $ 25.97 | $ 54,020 |
| Greeley, CO | 1,000 | 9.77 | 41.89 | $ 26.40 | $ 54,910 |
| Farmington, NM | 380 | 9.16 | 39.28 | $ 29.63 | $ 61,630 |
| Victoria, TX | 220 | 6.02 | 25.82 | $ 22.06 | $ 45,890 |
| Longview, TX | 430 | 4.79 | 20.55 | $ 26.27 | $ 54,640 |
| Wheeling, WV-OH | 250 | 4.41 | 18.89 | (8) | (8) |
| Casper, WY | 160 | 4.31 | 18.48 | $ 26.92 | $ 55,990 |
| Grand Junction, CO | 260 | 4.13 | 17.69 | $ 24.75 | $ 51,480 |
| Bakersfield, CA | 1,020 | 3.28 | 14.06 | $ 29.54 | $ 61,440 |
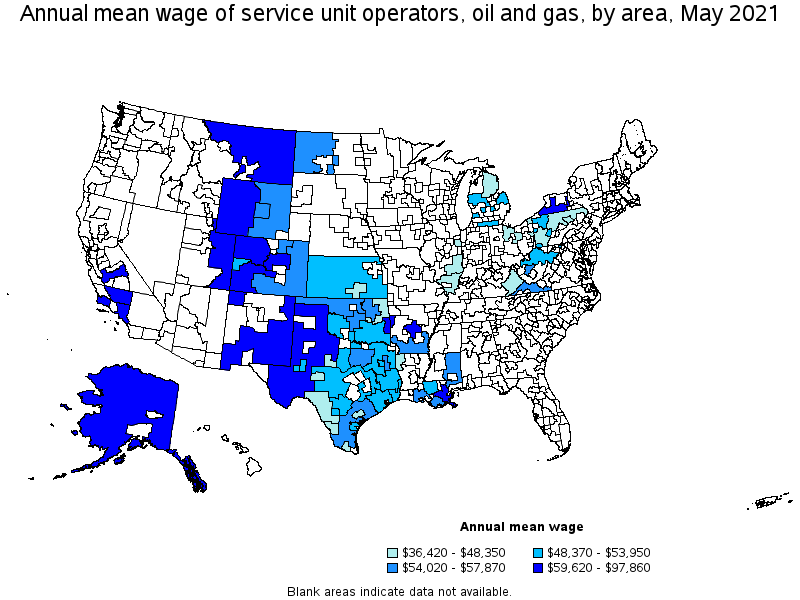
Top paying metropolitan areas for Service Unit Operators, Oil and Gas:
| Metropolitan area | Employment (1) | Employment per thousand jobs | Location quotient (9) | Hourly mean wage | Annual mean wage (2) |
|---|---|---|---|---|---|
| Fresno, CA | 30 | 0.08 | 0.36 | $ 38.00 | $ 79,050 |
| New Orleans-Metairie, LA | 130 | 0.26 | 1.13 | $ 35.15 | $ 73,100 |
| Little Rock-North Little Rock-Conway, AR | 70 | 0.21 | 0.92 | $ 31.26 | $ 65,030 |
| Santa Maria-Santa Barbara, CA | 70 | 0.37 | 1.57 | $ 30.77 | $ 64,000 |
| Denver-Aurora-Lakewood, CO | 560 | 0.38 | 1.64 | $ 29.81 | $ 61,990 |
| Farmington, NM | 380 | 9.16 | 39.28 | $ 29.63 | $ 61,630 |
| Bakersfield, CA | 1,020 | 3.28 | 14.06 | $ 29.54 | $ 61,440 |
| Los Angeles-Long Beach-Anaheim, CA | 300 | 0.05 | 0.23 | $ 29.52 | $ 61,390 |
| Fort Smith, AR-OK | 60 | 0.58 | 2.48 | $ 28.67 | $ 59,620 |
| Dallas-Fort Worth-Arlington, TX | 1,000 | 0.28 | 1.19 | $ 27.25 | $ 56,680 |
Nonmetropolitan areas with the highest employment in Service Unit Operators, Oil and Gas:
| Nonmetropolitan area | Employment (1) | Employment per thousand jobs | Location quotient (9) | Hourly mean wage | Annual mean wage (2) |
|---|---|---|---|---|---|
| West North Dakota nonmetropolitan area | 2,410 | 22.72 | 97.39 | $ 27.48 | $ 57,160 |
| Eastern New Mexico nonmetropolitan area | 870 | 5.95 | 25.50 | $ 31.84 | $ 66,220 |
| Alaska nonmetropolitan area | 860 | 8.87 | 38.01 | $ 47.05 | $ 97,860 |
| Kansas nonmetropolitan area | 510 | 1.37 | 5.86 | $ 23.30 | $ 48,460 |
| North Texas Region of Texas nonmetropolitan area | 440 | 1.66 | 7.13 | $ 25.54 | $ 53,120 |
Nonmetropolitan areas with the highest concentration of jobs and location quotients in Service Unit Operators, Oil and Gas:
| Nonmetropolitan area | Employment (1) | Employment per thousand jobs | Location quotient (9) | Hourly mean wage | Annual mean wage (2) |
|---|---|---|---|---|---|
| West North Dakota nonmetropolitan area | 2,410 | 22.72 | 97.39 | $ 27.48 | $ 57,160 |
| Alaska nonmetropolitan area | 860 | 8.87 | 38.01 | $ 47.05 | $ 97,860 |
| Southwest Oklahoma nonmetropolitan area | 350 | 6.02 | 25.79 | $ 24.42 | $ 50,780 |
| Eastern New Mexico nonmetropolitan area | 870 | 5.95 | 25.50 | $ 31.84 | $ 66,220 |
| Border Region of Texas nonmetropolitan area | 290 | 5.27 | 22.58 | $ 22.97 | $ 47,770 |
Top paying nonmetropolitan areas for Service Unit Operators, Oil and Gas:
| Nonmetropolitan area | Employment (1) | Employment per thousand jobs | Location quotient (9) | Hourly mean wage | Annual mean wage (2) |
|---|---|---|---|---|---|
| Alaska nonmetropolitan area | 860 | 8.87 | 38.01 | $ 47.05 | $ 97,860 |
| West Texas Region of Texas nonmetropolitan area | (8) | (8) | (8) | $ 33.18 | $ 69,010 |
| Eastern New Mexico nonmetropolitan area | 870 | 5.95 | 25.50 | $ 31.84 | $ 66,220 |
| Eastern Utah nonmetropolitan area | 310 | 3.91 | 16.78 | $ 31.27 | $ 65,040 |
| Western Wyoming nonmetropolitan area | 410 | 4.35 | 18.66 | $ 31.18 | $ 64,850 |
These estimates are calculated with data collected from employers in all industry sectors, all metropolitan and nonmetropolitan areas, and all states and the District of Columbia. The top employment and wage figures are provided above. The complete list is available in the downloadable XLS files.
The percentile wage estimate is the value of a wage below which a certain percent of workers fall. The median wage is the 50th percentile wage estimate—50 percent of workers earn less than the median and 50 percent of workers earn more than the median. More about percentile wages.
(1) Estimates for detailed occupations do not sum to the totals because the totals include occupations not shown separately. Estimates do not include self-employed workers.
(2) Annual wages have been calculated by multiplying the hourly mean wage by a "year-round, full-time" hours figure of 2,080 hours; for those occupations where there is not an hourly wage published, the annual wage has been directly calculated from the reported survey data.
(3) The relative standard error (RSE) is a measure of the reliability of a survey statistic. The smaller the relative standard error, the more precise the estimate.
(8) Estimate not released.
(9) The location quotient is the ratio of the area concentration of occupational employment to the national average concentration. A location quotient greater than one indicates the occupation has a higher share of employment than average, and a location quotient less than one indicates the occupation is less prevalent in the area than average.
Other OEWS estimates and related information:
May 2021 National Occupational Employment and Wage Estimates
May 2021 State Occupational Employment and Wage Estimates
May 2021 Metropolitan and Nonmetropolitan Area Occupational Employment and Wage Estimates
May 2021 National Industry-Specific Occupational Employment and Wage Estimates
Last Modified Date: March 31, 2022