
An official website of the United States government
An official website of the United States government
The .gov means it's official.
Federal government websites often end in .gov or .mil. Before sharing sensitive information,
make sure you're on a federal government site.
The site is secure.
The
https:// ensures that you are connecting to the official website and that any
information you provide is encrypted and transmitted securely.
Place and detonate explosives to demolish structures or to loosen, remove, or displace earth, rock, or other materials. May perform specialized handling, storage, and accounting procedures.
Employment estimate and mean wage estimates for Explosives Workers, Ordnance Handling Experts, and Blasters:
| Employment (1) | Employment RSE (3) |
Mean hourly wage |
Mean annual wage (2) |
Wage RSE (3) |
|---|---|---|---|---|
| 5,370 | 6.1 % | $ 27.44 | $ 57,070 | 1.6 % |
Percentile wage estimates for Explosives Workers, Ordnance Handling Experts, and Blasters:
| Percentile | 10% | 25% | 50% (Median) |
75% | 90% |
|---|---|---|---|---|---|
| Hourly Wage | $ 17.73 | $ 21.93 | $ 25.50 | $ 31.66 | $ 38.14 |
| Annual Wage (2) | $ 36,880 | $ 45,610 | $ 53,040 | $ 65,850 | $ 79,320 |
Industries with the highest published employment and wages for Explosives Workers, Ordnance Handling Experts, and Blasters are provided. For a list of all industries with employment in Explosives Workers, Ordnance Handling Experts, and Blasters, see the Create Customized Tables function.
Industries with the highest levels of employment in Explosives Workers, Ordnance Handling Experts, and Blasters:
| Industry | Employment (1) | Percent of industry employment | Hourly mean wage | Annual mean wage (2) |
|---|---|---|---|---|
| Merchant Wholesalers, Nondurable Goods (4242 and 4246 only) | 860 | 0.23 | $ 27.26 | $ 56,690 |
| Other Specialty Trade Contractors | 790 | 0.11 | $ 29.37 | $ 61,090 |
| Nonmetallic Mineral Mining and Quarrying | 340 | 0.35 | $ 31.32 | $ 65,140 |
| Support Activities for Mining | 290 | 0.14 | $ 29.78 | $ 61,940 |
| Architectural, Engineering, and Related Services | 270 | 0.02 | $ 31.38 | $ 65,260 |
Industries with the highest concentration of employment in Explosives Workers, Ordnance Handling Experts, and Blasters:
| Industry | Employment (1) | Percent of industry employment | Hourly mean wage | Annual mean wage (2) |
|---|---|---|---|---|
| Metal Ore Mining | 180 | 0.44 | $ 29.23 | $ 60,790 |
| Nonmetallic Mineral Mining and Quarrying | 340 | 0.35 | $ 31.32 | $ 65,140 |
| Coal Mining | 90 | 0.24 | $ 35.52 | $ 73,890 |
| Merchant Wholesalers, Nondurable Goods (4242 and 4246 only) | 860 | 0.23 | $ 27.26 | $ 56,690 |
| Support Activities for Mining | 290 | 0.14 | $ 29.78 | $ 61,940 |
Top paying industries for Explosives Workers, Ordnance Handling Experts, and Blasters:
| Industry | Employment (1) | Percent of industry employment | Hourly mean wage | Annual mean wage (2) |
|---|---|---|---|---|
| Utility System Construction | (8) | (8) | $ 37.33 | $ 77,650 |
| Coal Mining | 90 | 0.24 | $ 35.52 | $ 73,890 |
| Remediation and Other Waste Management Services | 90 | 0.05 | $ 34.60 | $ 71,960 |
| State Government, excluding schools and hospitals (OEWS Designation) | 40 | (7) | $ 32.59 | $ 67,790 |
| Architectural, Engineering, and Related Services | 270 | 0.02 | $ 31.38 | $ 65,260 |
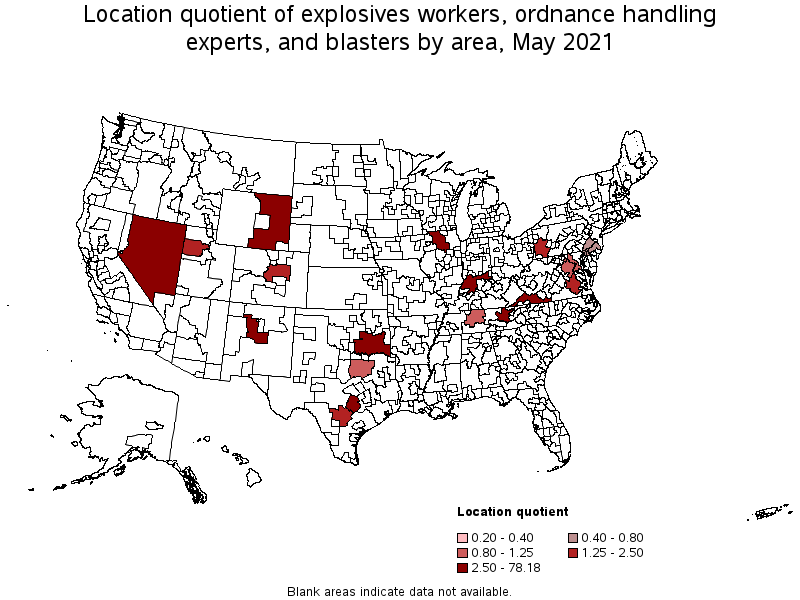
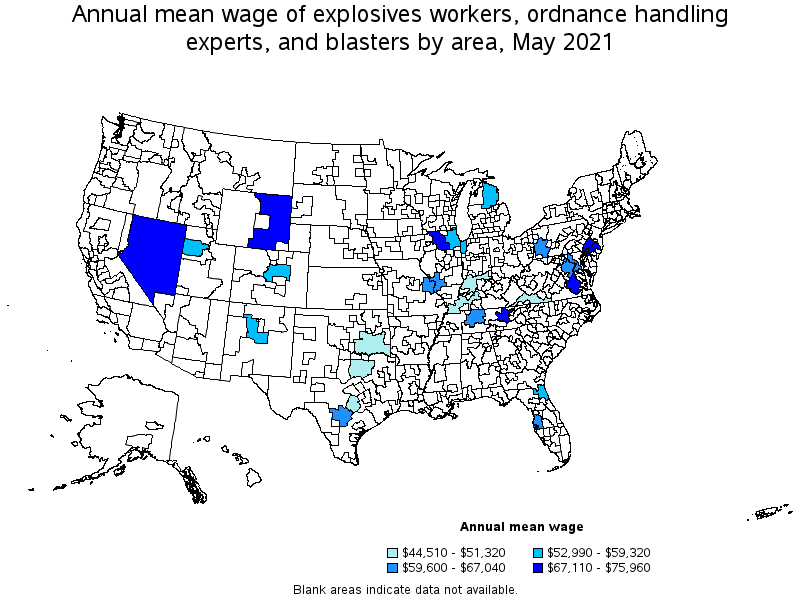
States and areas with the highest published employment, location quotients, and wages for Explosives Workers, Ordnance Handling Experts, and Blasters are provided. For a list of all areas with employment in Explosives Workers, Ordnance Handling Experts, and Blasters, see the Create Customized Tables function.
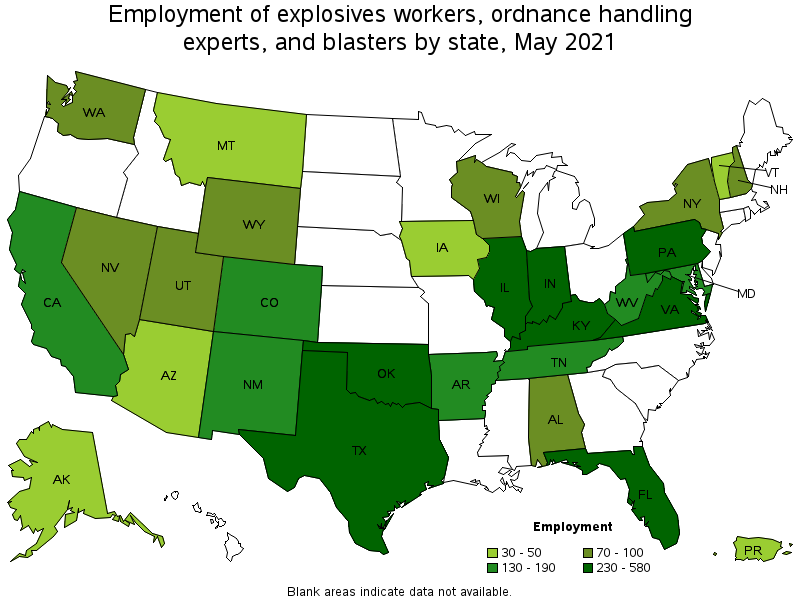
States with the highest employment level in Explosives Workers, Ordnance Handling Experts, and Blasters:
| State | Employment (1) | Employment per thousand jobs | Location quotient (9) | Hourly mean wage | Annual mean wage (2) |
|---|---|---|---|---|---|
| Texas | 580 | 0.05 | 1.23 | $ 25.07 | $ 52,140 |
| Oklahoma | 510 | 0.33 | 8.54 | $ 23.21 | $ 48,270 |
| Indiana | 390 | 0.13 | 3.44 | $ 23.85 | $ 49,600 |
| Kentucky | 330 | 0.18 | 4.77 | $ 23.26 | $ 48,380 |
| Pennsylvania | 330 | 0.06 | 1.56 | $ 28.58 | $ 59,450 |
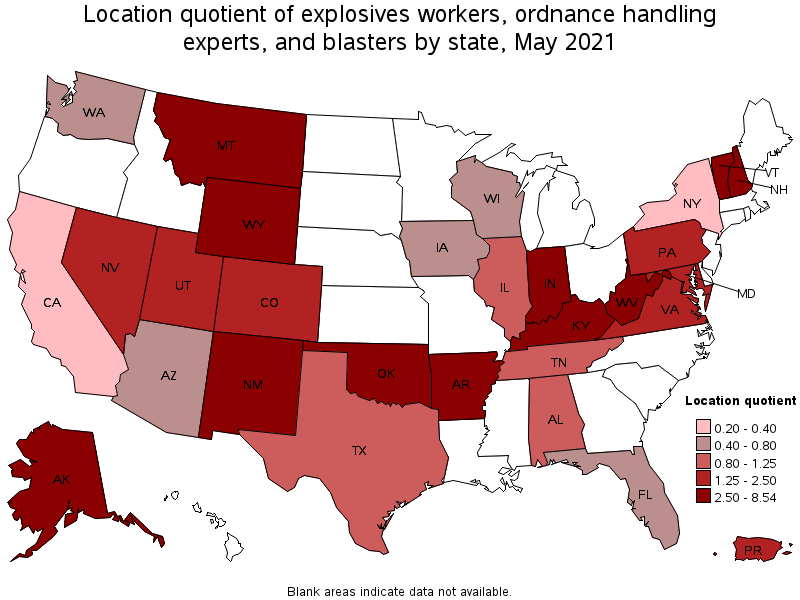
States with the highest concentration of jobs and location quotients in Explosives Workers, Ordnance Handling Experts, and Blasters:
| State | Employment (1) | Employment per thousand jobs | Location quotient (9) | Hourly mean wage | Annual mean wage (2) |
|---|---|---|---|---|---|
| Oklahoma | 510 | 0.33 | 8.54 | $ 23.21 | $ 48,270 |
| Wyoming | 70 | 0.27 | 7.11 | $ 32.92 | $ 68,470 |
| West Virginia | 130 | 0.20 | 5.36 | $ 23.64 | $ 49,180 |
| Kentucky | 330 | 0.18 | 4.77 | $ 23.26 | $ 48,380 |
| New Mexico | 130 | 0.17 | 4.54 | $ 29.08 | $ 60,490 |
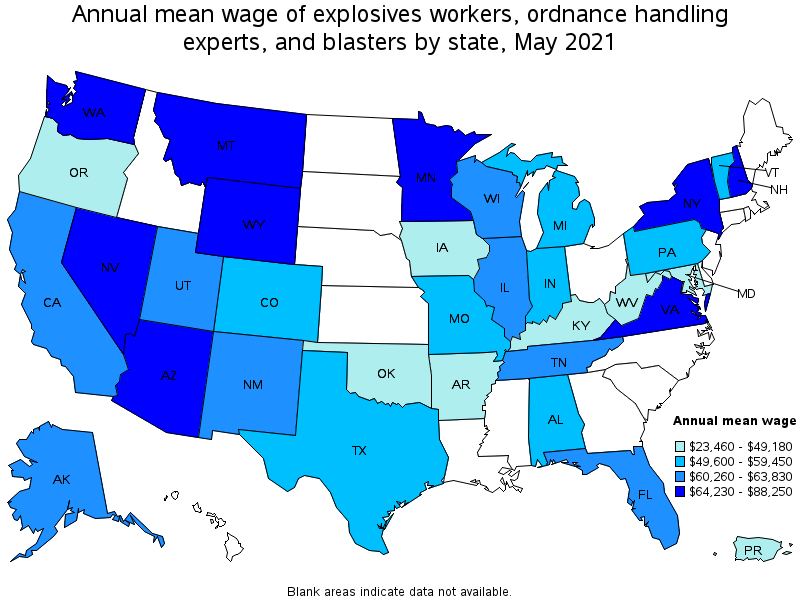
Top paying states for Explosives Workers, Ordnance Handling Experts, and Blasters:
| State | Employment (1) | Employment per thousand jobs | Location quotient (9) | Hourly mean wage | Annual mean wage (2) |
|---|---|---|---|---|---|
| Washington | 80 | 0.02 | 0.65 | $ 42.43 | $ 88,250 |
| Arizona | 50 | 0.02 | 0.42 | $ 42.12 | $ 87,600 |
| New York | 70 | 0.01 | 0.20 | $ 38.02 | $ 79,070 |
| Nevada | 80 | 0.06 | 1.68 | $ 37.49 | $ 77,980 |
| New Hampshire | 100 | 0.16 | 4.12 | $ 37.47 | $ 77,940 |
Metropolitan areas with the highest employment level in Explosives Workers, Ordnance Handling Experts, and Blasters:
| Metropolitan area | Employment (1) | Employment per thousand jobs | Location quotient (9) | Hourly mean wage | Annual mean wage (2) |
|---|---|---|---|---|---|
| Dallas-Fort Worth-Arlington, TX | 150 | 0.04 | 1.10 | $ 23.60 | $ 49,090 |
| Washington-Arlington-Alexandria, DC-VA-MD-WV | 140 | 0.05 | 1.23 | $ 32.23 | $ 67,040 |
| Austin-Round Rock, TX | 120 | 0.12 | 3.03 | $ 24.67 | $ 51,320 |
| Denver-Aurora-Lakewood, CO | 100 | 0.07 | 1.83 | $ 26.61 | $ 55,350 |
| Pittsburgh, PA | 60 | 0.06 | 1.58 | $ 29.66 | $ 61,690 |
| Salt Lake City, UT | 60 | 0.08 | 2.08 | $ 26.64 | $ 55,420 |
| San Antonio-New Braunfels, TX | 60 | 0.06 | 1.50 | $ 28.66 | $ 59,600 |
| Philadelphia-Camden-Wilmington, PA-NJ-DE-MD | 60 | 0.02 | 0.55 | $ 32.27 | $ 67,110 |
| Richmond, VA | 50 | 0.08 | 2.08 | $ 32.33 | $ 67,250 |
| Nashville-Davidson--Murfreesboro--Franklin, TN | 40 | 0.04 | 1.15 | $ 29.51 | $ 61,380 |
Metropolitan areas with the highest concentration of jobs and location quotients in Explosives Workers, Ordnance Handling Experts, and Blasters:
| Metropolitan area | Employment (1) | Employment per thousand jobs | Location quotient (9) | Hourly mean wage | Annual mean wage (2) |
|---|---|---|---|---|---|
| Austin-Round Rock, TX | 120 | 0.12 | 3.03 | $ 24.67 | $ 51,320 |
| Knoxville, TN | 40 | 0.10 | 2.75 | $ 34.42 | $ 71,590 |
| Albuquerque, NM | 40 | 0.10 | 2.63 | $ 28.34 | $ 58,950 |
| Richmond, VA | 50 | 0.08 | 2.08 | $ 32.33 | $ 67,250 |
| Salt Lake City, UT | 60 | 0.08 | 2.08 | $ 26.64 | $ 55,420 |
| Denver-Aurora-Lakewood, CO | 100 | 0.07 | 1.83 | $ 26.61 | $ 55,350 |
| Pittsburgh, PA | 60 | 0.06 | 1.58 | $ 29.66 | $ 61,690 |
| San Antonio-New Braunfels, TX | 60 | 0.06 | 1.50 | $ 28.66 | $ 59,600 |
| Washington-Arlington-Alexandria, DC-VA-MD-WV | 140 | 0.05 | 1.23 | $ 32.23 | $ 67,040 |
| Nashville-Davidson--Murfreesboro--Franklin, TN | 40 | 0.04 | 1.15 | $ 29.51 | $ 61,380 |
Top paying metropolitan areas for Explosives Workers, Ordnance Handling Experts, and Blasters:
| Metropolitan area | Employment (1) | Employment per thousand jobs | Location quotient (9) | Hourly mean wage | Annual mean wage (2) |
|---|---|---|---|---|---|
| Knoxville, TN | 40 | 0.10 | 2.75 | $ 34.42 | $ 71,590 |
| Richmond, VA | 50 | 0.08 | 2.08 | $ 32.33 | $ 67,250 |
| Philadelphia-Camden-Wilmington, PA-NJ-DE-MD | 60 | 0.02 | 0.55 | $ 32.27 | $ 67,110 |
| Washington-Arlington-Alexandria, DC-VA-MD-WV | 140 | 0.05 | 1.23 | $ 32.23 | $ 67,040 |
| Tampa-St. Petersburg-Clearwater, FL | (8) | (8) | (8) | $ 31.00 | $ 64,480 |
| Pittsburgh, PA | 60 | 0.06 | 1.58 | $ 29.66 | $ 61,690 |
| Nashville-Davidson--Murfreesboro--Franklin, TN | 40 | 0.04 | 1.15 | $ 29.51 | $ 61,380 |
| St. Louis, MO-IL | (8) | (8) | (8) | $ 29.19 | $ 60,720 |
| San Antonio-New Braunfels, TX | 60 | 0.06 | 1.50 | $ 28.66 | $ 59,600 |
| Chicago-Naperville-Elgin, IL-IN-WI | (8) | (8) | (8) | $ 28.52 | $ 59,320 |
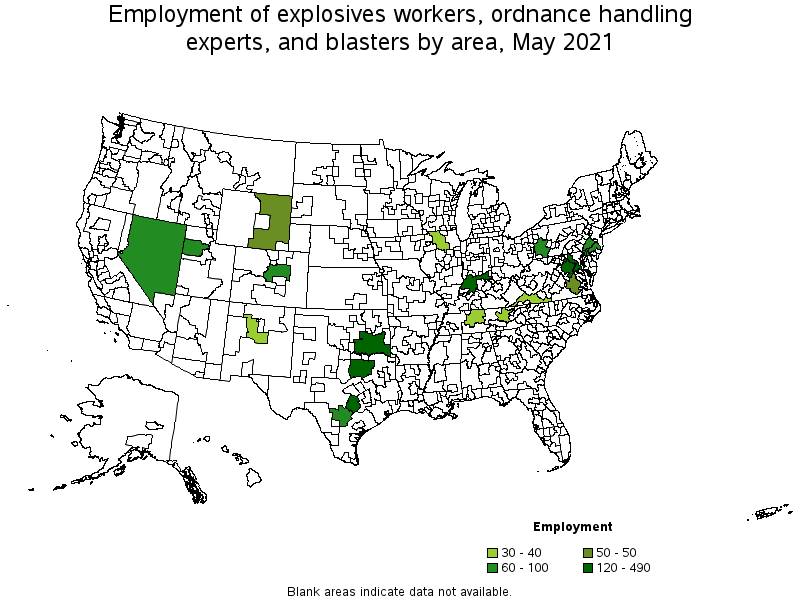
Nonmetropolitan areas with the highest employment in Explosives Workers, Ordnance Handling Experts, and Blasters:
| Nonmetropolitan area | Employment (1) | Employment per thousand jobs | Location quotient (9) | Hourly mean wage | Annual mean wage (2) |
|---|---|---|---|---|---|
| Southeast Oklahoma nonmetropolitan area | 490 | 2.98 | 78.18 | $ 23.27 | $ 48,410 |
| Southern Indiana nonmetropolitan area | 250 | 1.38 | 36.17 | $ 23.45 | $ 48,780 |
| Nevada nonmetropolitan area | 70 | 0.71 | 18.59 | $ 36.52 | $ 75,960 |
| Eastern Wyoming nonmetropolitan area | 50 | 0.67 | 17.59 | $ 32.38 | $ 67,340 |
| Southwest Virginia nonmetropolitan area | 40 | 0.34 | 8.91 | $ 21.40 | $ 44,510 |
Nonmetropolitan areas with the highest concentration of jobs and location quotients in Explosives Workers, Ordnance Handling Experts, and Blasters:
| Nonmetropolitan area | Employment (1) | Employment per thousand jobs | Location quotient (9) | Hourly mean wage | Annual mean wage (2) |
|---|---|---|---|---|---|
| Southeast Oklahoma nonmetropolitan area | 490 | 2.98 | 78.18 | $ 23.27 | $ 48,410 |
| Southern Indiana nonmetropolitan area | 250 | 1.38 | 36.17 | $ 23.45 | $ 48,780 |
| Nevada nonmetropolitan area | 70 | 0.71 | 18.59 | $ 36.52 | $ 75,960 |
| Eastern Wyoming nonmetropolitan area | 50 | 0.67 | 17.59 | $ 32.38 | $ 67,340 |
| Southwest Virginia nonmetropolitan area | 40 | 0.34 | 8.91 | $ 21.40 | $ 44,510 |
Top paying nonmetropolitan areas for Explosives Workers, Ordnance Handling Experts, and Blasters:
| Nonmetropolitan area | Employment (1) | Employment per thousand jobs | Location quotient (9) | Hourly mean wage | Annual mean wage (2) |
|---|---|---|---|---|---|
| Nevada nonmetropolitan area | 70 | 0.71 | 18.59 | $ 36.52 | $ 75,960 |
| Northwest Illinois nonmetropolitan area | 30 | 0.25 | 6.48 | $ 35.15 | $ 73,110 |
| Eastern Wyoming nonmetropolitan area | 50 | 0.67 | 17.59 | $ 32.38 | $ 67,340 |
| Northeast Lower Peninsula of Michigan nonmetropolitan area | (8) | (8) | (8) | $ 25.48 | $ 52,990 |
| West Kentucky nonmetropolitan area | (8) | (8) | (8) | $ 23.67 | $ 49,230 |
These estimates are calculated with data collected from employers in all industry sectors, all metropolitan and nonmetropolitan areas, and all states and the District of Columbia. The top employment and wage figures are provided above. The complete list is available in the downloadable XLS files.
The percentile wage estimate is the value of a wage below which a certain percent of workers fall. The median wage is the 50th percentile wage estimate—50 percent of workers earn less than the median and 50 percent of workers earn more than the median. More about percentile wages.
(1) Estimates for detailed occupations do not sum to the totals because the totals include occupations not shown separately. Estimates do not include self-employed workers.
(2) Annual wages have been calculated by multiplying the hourly mean wage by a "year-round, full-time" hours figure of 2,080 hours; for those occupations where there is not an hourly wage published, the annual wage has been directly calculated from the reported survey data.
(3) The relative standard error (RSE) is a measure of the reliability of a survey statistic. The smaller the relative standard error, the more precise the estimate.
(7) The value is less than .005 percent of industry employment.
(8) Estimate not released.
(9) The location quotient is the ratio of the area concentration of occupational employment to the national average concentration. A location quotient greater than one indicates the occupation has a higher share of employment than average, and a location quotient less than one indicates the occupation is less prevalent in the area than average.
Other OEWS estimates and related information:
May 2021 National Occupational Employment and Wage Estimates
May 2021 State Occupational Employment and Wage Estimates
May 2021 Metropolitan and Nonmetropolitan Area Occupational Employment and Wage Estimates
May 2021 National Industry-Specific Occupational Employment and Wage Estimates
Last Modified Date: March 31, 2022