
An official website of the United States government
An official website of the United States government
The .gov means it's official.
Federal government websites often end in .gov or .mil. Before sharing sensitive information,
make sure you're on a federal government site.
The site is secure.
The
https:// ensures that you are connecting to the official website and that any
information you provide is encrypted and transmitted securely.
Install, inspect, test, adjust, or repair avionics equipment, such as radar, radio, navigation, and missile control systems in aircraft or space vehicles.
Employment estimate and mean wage estimates for Avionics Technicians:
| Employment (1) | Employment RSE (3) |
Mean hourly wage |
Mean annual wage (2) |
Wage RSE (3) |
|---|---|---|---|---|
| 18,910 | 2.8 % | $ 33.59 | $ 69,860 | 0.9 % |
Percentile wage estimates for Avionics Technicians:
| Percentile | 10% | 25% | 50% (Median) |
75% | 90% |
|---|---|---|---|---|---|
| Hourly Wage | $ 18.61 | $ 27.38 | $ 33.31 | $ 38.79 | $ 48.49 |
| Annual Wage (2) | $ 38,700 | $ 56,960 | $ 69,280 | $ 80,690 | $ 100,860 |
Industries with the highest published employment and wages for Avionics Technicians are provided. For a list of all industries with employment in Avionics Technicians, see the Create Customized Tables function.
Industries with the highest levels of employment in Avionics Technicians:
| Industry | Employment (1) | Percent of industry employment | Hourly mean wage | Annual mean wage (2) |
|---|---|---|---|---|
| Support Activities for Air Transportation | 6,580 | 3.37 | $ 28.37 | $ 59,010 |
| Aerospace Product and Parts Manufacturing | 6,020 | 1.28 | $ 38.93 | $ 80,980 |
| Federal Executive Branch (OEWS Designation) | 1,340 | 0.06 | $ 30.98 | $ 64,440 |
| Scheduled Air Transportation | 1,100 | 0.28 | $ 41.91 | $ 87,180 |
| Navigational, Measuring, Electromedical, and Control Instruments Manufacturing | 910 | 0.23 | $ 33.06 | $ 68,770 |
Industries with the highest concentration of employment in Avionics Technicians:
| Industry | Employment (1) | Percent of industry employment | Hourly mean wage | Annual mean wage (2) |
|---|---|---|---|---|
| Support Activities for Air Transportation | 6,580 | 3.37 | $ 28.37 | $ 59,010 |
| Aerospace Product and Parts Manufacturing | 6,020 | 1.28 | $ 38.93 | $ 80,980 |
| Nonscheduled Air Transportation | 350 | 0.72 | $ 30.90 | $ 64,280 |
| Scheduled Air Transportation | 1,100 | 0.28 | $ 41.91 | $ 87,180 |
| Navigational, Measuring, Electromedical, and Control Instruments Manufacturing | 910 | 0.23 | $ 33.06 | $ 68,770 |
Top paying industries for Avionics Technicians:
| Industry | Employment (1) | Percent of industry employment | Hourly mean wage | Annual mean wage (2) |
|---|---|---|---|---|
| Other Professional, Scientific, and Technical Services | (8) | (8) | $ 42.82 | $ 89,070 |
| Scheduled Air Transportation | 1,100 | 0.28 | $ 41.91 | $ 87,180 |
| Computer Systems Design and Related Services | (8) | (8) | $ 41.91 | $ 87,170 |
| Aerospace Product and Parts Manufacturing | 6,020 | 1.28 | $ 38.93 | $ 80,980 |
| Architectural, Engineering, and Related Services | 560 | 0.04 | $ 38.22 | $ 79,500 |
States and areas with the highest published employment, location quotients, and wages for Avionics Technicians are provided. For a list of all areas with employment in Avionics Technicians, see the Create Customized Tables function.
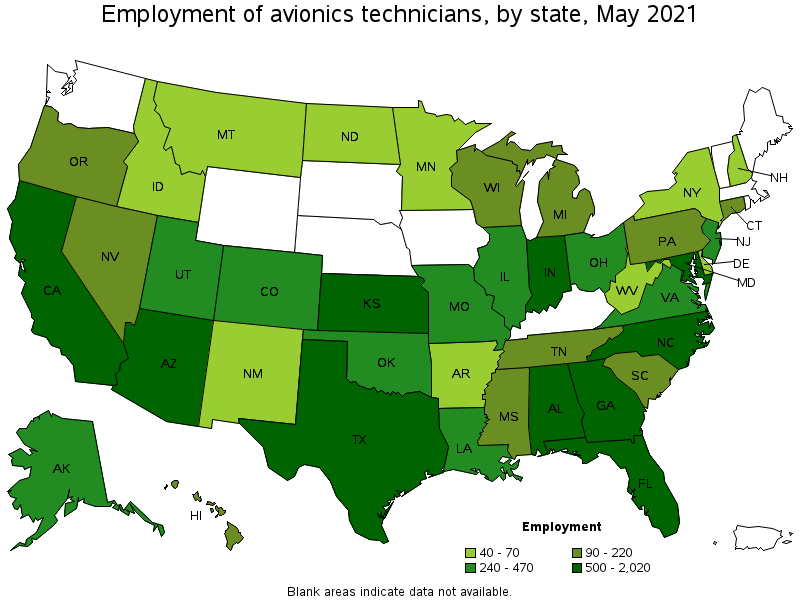
States with the highest employment level in Avionics Technicians:
| State | Employment (1) | Employment per thousand jobs | Location quotient (9) | Hourly mean wage | Annual mean wage (2) |
|---|---|---|---|---|---|
| Florida | 2,020 | 0.23 | 1.74 | $ 28.44 | $ 59,160 |
| California | 1,740 | 0.11 | 0.79 | $ 36.80 | $ 76,540 |
| Texas | 1,720 | 0.14 | 1.05 | $ 33.97 | $ 70,650 |
| Georgia | 1,010 | 0.23 | 1.73 | $ 34.52 | $ 71,810 |
| Alabama | 850 | 0.44 | 3.28 | $ 37.36 | $ 77,700 |
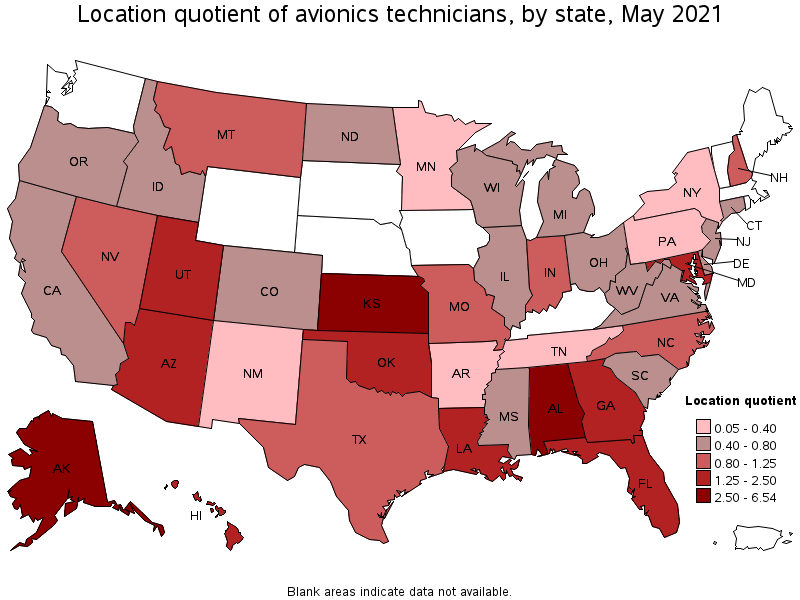
States with the highest concentration of jobs and location quotients in Avionics Technicians:
| State | Employment (1) | Employment per thousand jobs | Location quotient (9) | Hourly mean wage | Annual mean wage (2) |
|---|---|---|---|---|---|
| Alaska | 260 | 0.88 | 6.54 | $ 27.81 | $ 57,840 |
| Kansas | 650 | 0.49 | 3.61 | $ 30.41 | $ 63,250 |
| Alabama | 850 | 0.44 | 3.28 | $ 37.36 | $ 77,700 |
| Oklahoma | 470 | 0.30 | 2.27 | $ 27.12 | $ 56,420 |
| Maryland | 710 | 0.28 | 2.07 | $ 40.08 | $ 83,370 |
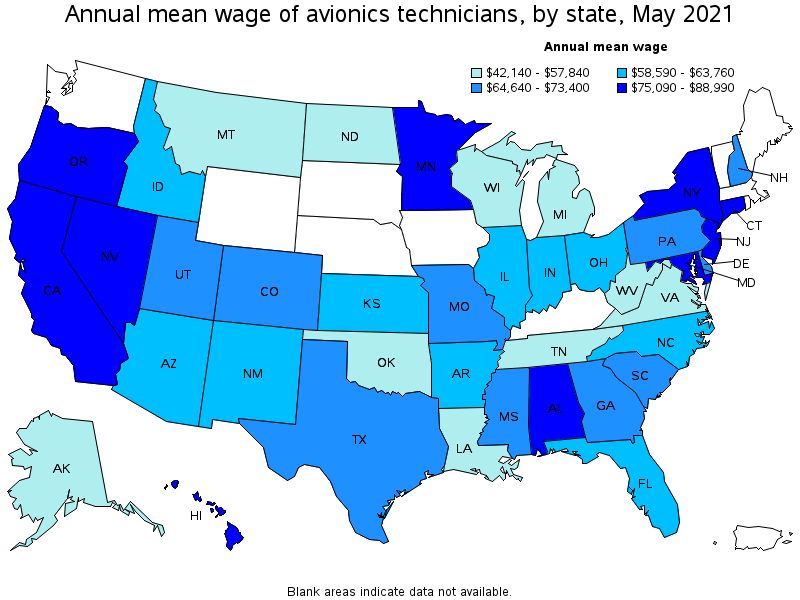
Top paying states for Avionics Technicians:
| State | Employment (1) | Employment per thousand jobs | Location quotient (9) | Hourly mean wage | Annual mean wage (2) |
|---|---|---|---|---|---|
| Connecticut | 90 | 0.06 | 0.41 | $ 42.78 | $ 88,990 |
| Maryland | 710 | 0.28 | 2.07 | $ 40.08 | $ 83,370 |
| New York | 60 | 0.01 | 0.05 | $ 38.31 | $ 79,690 |
| Oregon | 110 | 0.06 | 0.43 | $ 37.51 | $ 78,010 |
| Alabama | 850 | 0.44 | 3.28 | $ 37.36 | $ 77,700 |
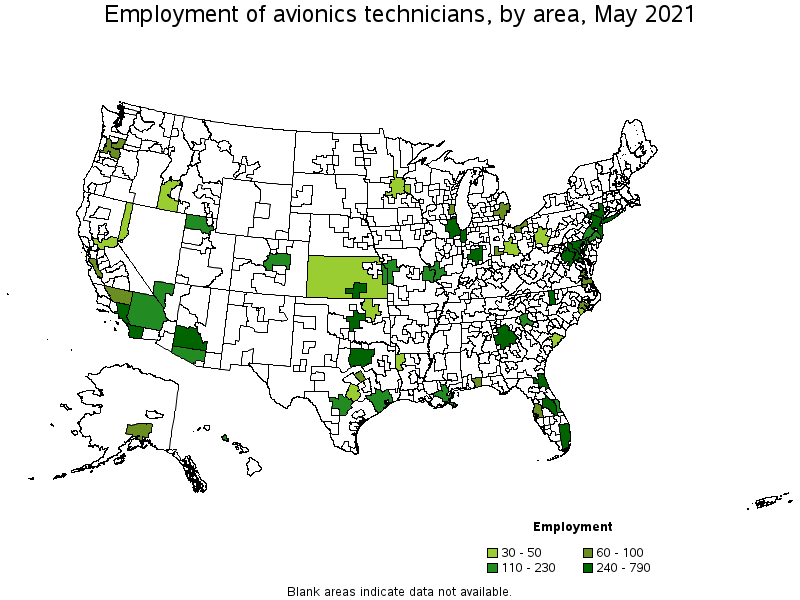
Metropolitan areas with the highest employment level in Avionics Technicians:
| Metropolitan area | Employment (1) | Employment per thousand jobs | Location quotient (9) | Hourly mean wage | Annual mean wage (2) |
|---|---|---|---|---|---|
| Dallas-Fort Worth-Arlington, TX | 790 | 0.22 | 1.63 | $ 34.83 | $ 72,450 |
| Miami-Fort Lauderdale-West Palm Beach, FL | 680 | 0.28 | 2.07 | $ 26.06 | $ 54,210 |
| San Diego-Carlsbad, CA | 550 | 0.39 | 2.93 | $ 36.35 | $ 75,610 |
| Los Angeles-Long Beach-Anaheim, CA | 510 | 0.09 | 0.67 | $ 37.35 | $ 77,690 |
| Wichita, KS | 500 | 1.77 | 13.22 | (8) | (8) |
| Atlanta-Sandy Springs-Roswell, GA | 440 | 0.17 | 1.26 | $ 36.32 | $ 75,550 |
| Indianapolis-Carmel-Anderson, IN | 380 | 0.38 | 2.83 | $ 28.22 | $ 58,690 |
| Jacksonville, FL | 380 | 0.55 | 4.09 | $ 29.12 | $ 60,570 |
| Oklahoma City, OK | 360 | 0.60 | 4.46 | $ 27.47 | $ 57,130 |
| Baltimore-Columbia-Towson, MD | 330 | 0.26 | 1.95 | $ 39.59 | $ 82,340 |
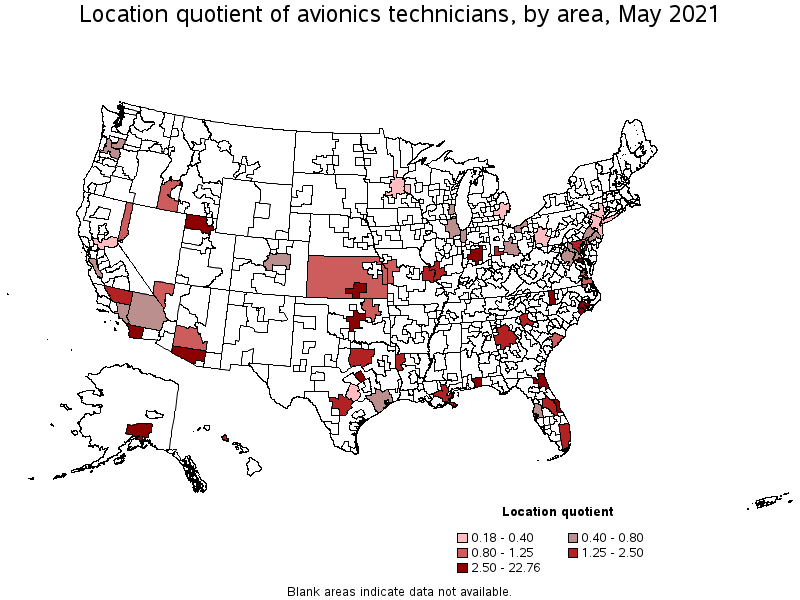
Metropolitan areas with the highest concentration of jobs and location quotients in Avionics Technicians:
| Metropolitan area | Employment (1) | Employment per thousand jobs | Location quotient (9) | Hourly mean wage | Annual mean wage (2) |
|---|---|---|---|---|---|
| California-Lexington Park, MD | 140 | 3.05 | 22.76 | $ 40.35 | $ 83,930 |
| Wichita, KS | 500 | 1.77 | 13.22 | (8) | (8) |
| New Bern, NC | 70 | 1.55 | 11.52 | $ 31.64 | $ 65,810 |
| Palm Bay-Melbourne-Titusville, FL | 230 | 1.05 | 7.84 | $ 29.52 | $ 61,400 |
| Jacksonville, NC | 40 | 0.88 | 6.54 | $ 30.77 | $ 64,000 |
| Greensboro-High Point, NC | 240 | 0.71 | 5.27 | $ 25.77 | $ 53,600 |
| Ogden-Clearfield, UT | 180 | 0.67 | 5.03 | $ 33.24 | $ 69,150 |
| Oklahoma City, OK | 360 | 0.60 | 4.46 | $ 27.47 | $ 57,130 |
| Jacksonville, FL | 380 | 0.55 | 4.09 | $ 29.12 | $ 60,570 |
| Tucson, AZ | 200 | 0.54 | 4.04 | $ 31.47 | $ 65,450 |
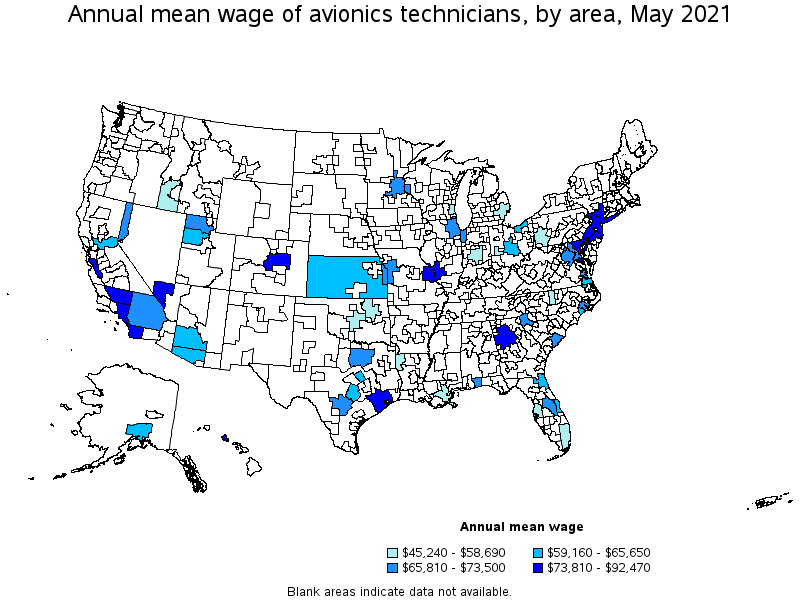
Top paying metropolitan areas for Avionics Technicians:
| Metropolitan area | Employment (1) | Employment per thousand jobs | Location quotient (9) | Hourly mean wage | Annual mean wage (2) |
|---|---|---|---|---|---|
| San Jose-Sunnyvale-Santa Clara, CA | 80 | 0.08 | 0.59 | $ 44.46 | $ 92,470 |
| Houston-The Woodlands-Sugar Land, TX | 200 | 0.07 | 0.51 | $ 42.15 | $ 87,670 |
| California-Lexington Park, MD | 140 | 3.05 | 22.76 | $ 40.35 | $ 83,930 |
| Baltimore-Columbia-Towson, MD | 330 | 0.26 | 1.95 | $ 39.59 | $ 82,340 |
| Los Angeles-Long Beach-Anaheim, CA | 510 | 0.09 | 0.67 | $ 37.35 | $ 77,690 |
| Las Vegas-Henderson-Paradise, NV | 140 | 0.15 | 1.15 | $ 36.96 | $ 76,880 |
| Philadelphia-Camden-Wilmington, PA-NJ-DE-MD | 150 | 0.06 | 0.41 | $ 36.95 | $ 76,850 |
| New York-Newark-Jersey City, NY-NJ-PA | 240 | 0.03 | 0.21 | $ 36.92 | $ 76,790 |
| Urban Honolulu, HI | 110 | 0.28 | 2.10 | $ 36.72 | $ 76,370 |
| San Diego-Carlsbad, CA | 550 | 0.39 | 2.93 | $ 36.35 | $ 75,610 |
Nonmetropolitan areas with the highest employment in Avionics Technicians:
| Nonmetropolitan area | Employment (1) | Employment per thousand jobs | Location quotient (9) | Hourly mean wage | Annual mean wage (2) |
|---|---|---|---|---|---|
| Kansas nonmetropolitan area | 50 | 0.13 | 0.95 | $ 28.44 | $ 59,160 |
Nonmetropolitan areas with the highest concentration of jobs and location quotients in Avionics Technicians:
| Nonmetropolitan area | Employment (1) | Employment per thousand jobs | Location quotient (9) | Hourly mean wage | Annual mean wage (2) |
|---|---|---|---|---|---|
| Kansas nonmetropolitan area | 50 | 0.13 | 0.95 | $ 28.44 | $ 59,160 |
Top paying nonmetropolitan areas for Avionics Technicians:
| Nonmetropolitan area | Employment (1) | Employment per thousand jobs | Location quotient (9) | Hourly mean wage | Annual mean wage (2) |
|---|---|---|---|---|---|
| Kansas nonmetropolitan area | 50 | 0.13 | 0.95 | $ 28.44 | $ 59,160 |
These estimates are calculated with data collected from employers in all industry sectors, all metropolitan and nonmetropolitan areas, and all states and the District of Columbia. The top employment and wage figures are provided above. The complete list is available in the downloadable XLS files.
The percentile wage estimate is the value of a wage below which a certain percent of workers fall. The median wage is the 50th percentile wage estimate—50 percent of workers earn less than the median and 50 percent of workers earn more than the median. More about percentile wages.
(1) Estimates for detailed occupations do not sum to the totals because the totals include occupations not shown separately. Estimates do not include self-employed workers.
(2) Annual wages have been calculated by multiplying the hourly mean wage by a "year-round, full-time" hours figure of 2,080 hours; for those occupations where there is not an hourly wage published, the annual wage has been directly calculated from the reported survey data.
(3) The relative standard error (RSE) is a measure of the reliability of a survey statistic. The smaller the relative standard error, the more precise the estimate.
(8) Estimate not released.
(9) The location quotient is the ratio of the area concentration of occupational employment to the national average concentration. A location quotient greater than one indicates the occupation has a higher share of employment than average, and a location quotient less than one indicates the occupation is less prevalent in the area than average.
Other OEWS estimates and related information:
May 2021 National Occupational Employment and Wage Estimates
May 2021 State Occupational Employment and Wage Estimates
May 2021 Metropolitan and Nonmetropolitan Area Occupational Employment and Wage Estimates
May 2021 National Industry-Specific Occupational Employment and Wage Estimates
Last Modified Date: March 31, 2022