
An official website of the United States government
An official website of the United States government
The .gov means it's official.
Federal government websites often end in .gov or .mil. Before sharing sensitive information,
make sure you're on a federal government site.
The site is secure.
The
https:// ensures that you are connecting to the official website and that any
information you provide is encrypted and transmitted securely.
Repair, maintain, or install electric motors, wiring, or switches.
Employment estimate and mean wage estimates for Electric Motor, Power Tool, and Related Repairers:
| Employment (1) | Employment RSE (3) |
Mean hourly wage |
Mean annual wage (2) |
Wage RSE (3) |
|---|---|---|---|---|
| 15,880 | 5.0 % | $ 23.43 | $ 48,740 | 1.1 % |
Percentile wage estimates for Electric Motor, Power Tool, and Related Repairers:
| Percentile | 10% | 25% | 50% (Median) |
75% | 90% |
|---|---|---|---|---|---|
| Hourly Wage | $ 14.39 | $ 17.96 | $ 22.55 | $ 28.35 | $ 33.75 |
| Annual Wage (2) | $ 29,920 | $ 37,360 | $ 46,910 | $ 58,970 | $ 70,200 |
Industries with the highest published employment and wages for Electric Motor, Power Tool, and Related Repairers are provided. For a list of all industries with employment in Electric Motor, Power Tool, and Related Repairers, see the Create Customized Tables function.
Industries with the highest levels of employment in Electric Motor, Power Tool, and Related Repairers:
| Industry | Employment (1) | Percent of industry employment | Hourly mean wage | Annual mean wage (2) |
|---|---|---|---|---|
| Merchant Wholesalers, Durable Goods (4232, 4233, 4235, 4236, 4237, and 4239 only) | 5,990 | 0.44 | $ 24.70 | $ 51,380 |
| Commercial and Industrial Machinery and Equipment (except Automotive and Electronic) Repair and Maintenance | 2,830 | 1.35 | $ 23.59 | $ 49,070 |
| Electrical Equipment Manufacturing | 710 | 0.53 | $ 25.64 | $ 53,330 |
| Building Equipment Contractors | 690 | 0.03 | $ 21.99 | $ 45,740 |
| Warehousing and Storage | 680 | 0.04 | $ 22.09 | $ 45,950 |
Industries with the highest concentration of employment in Electric Motor, Power Tool, and Related Repairers:
| Industry | Employment (1) | Percent of industry employment | Hourly mean wage | Annual mean wage (2) |
|---|---|---|---|---|
| Commercial and Industrial Machinery and Equipment (except Automotive and Electronic) Repair and Maintenance | 2,830 | 1.35 | $ 23.59 | $ 49,070 |
| Electrical Equipment Manufacturing | 710 | 0.53 | $ 25.64 | $ 53,330 |
| Merchant Wholesalers, Durable Goods (4232, 4233, 4235, 4236, 4237, and 4239 only) | 5,990 | 0.44 | $ 24.70 | $ 51,380 |
| Electronic and Precision Equipment Repair and Maintenance | 190 | 0.19 | $ 19.68 | $ 40,920 |
| Personal and Household Goods Repair and Maintenance | 70 | 0.09 | $ 16.64 | $ 34,610 |
Top paying industries for Electric Motor, Power Tool, and Related Repairers:
| Industry | Employment (1) | Percent of industry employment | Hourly mean wage | Annual mean wage (2) |
|---|---|---|---|---|
| Local Government, excluding schools and hospitals (OEWS Designation) | 420 | 0.01 | $ 43.69 | $ 90,880 |
| Navigational, Measuring, Electromedical, and Control Instruments Manufacturing | 40 | 0.01 | $ 28.38 | $ 59,030 |
| Electrical Equipment Manufacturing | 710 | 0.53 | $ 25.64 | $ 53,330 |
| Merchant Wholesalers, Durable Goods (4232, 4233, 4235, 4236, 4237, and 4239 only) | 5,990 | 0.44 | $ 24.70 | $ 51,380 |
| Foundation, Structure, and Building Exterior Contractors | 40 | (7) | $ 24.13 | $ 50,190 |
States and areas with the highest published employment, location quotients, and wages for Electric Motor, Power Tool, and Related Repairers are provided. For a list of all areas with employment in Electric Motor, Power Tool, and Related Repairers, see the Create Customized Tables function.
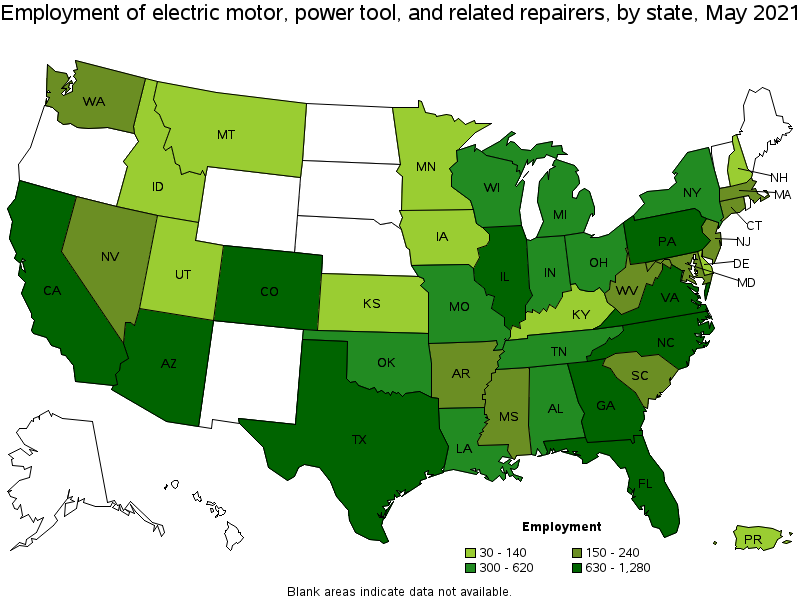
States with the highest employment level in Electric Motor, Power Tool, and Related Repairers:
| State | Employment (1) | Employment per thousand jobs | Location quotient (9) | Hourly mean wage | Annual mean wage (2) |
|---|---|---|---|---|---|
| Texas | 1,280 | 0.10 | 0.93 | $ 19.85 | $ 41,280 |
| Florida | 1,240 | 0.14 | 1.28 | $ 21.20 | $ 44,100 |
| California | 1,020 | 0.06 | 0.55 | $ 25.64 | $ 53,330 |
| Georgia | 990 | 0.23 | 2.02 | $ 22.83 | $ 47,490 |
| Illinois | 840 | 0.15 | 1.33 | $ 36.46 | $ 75,840 |
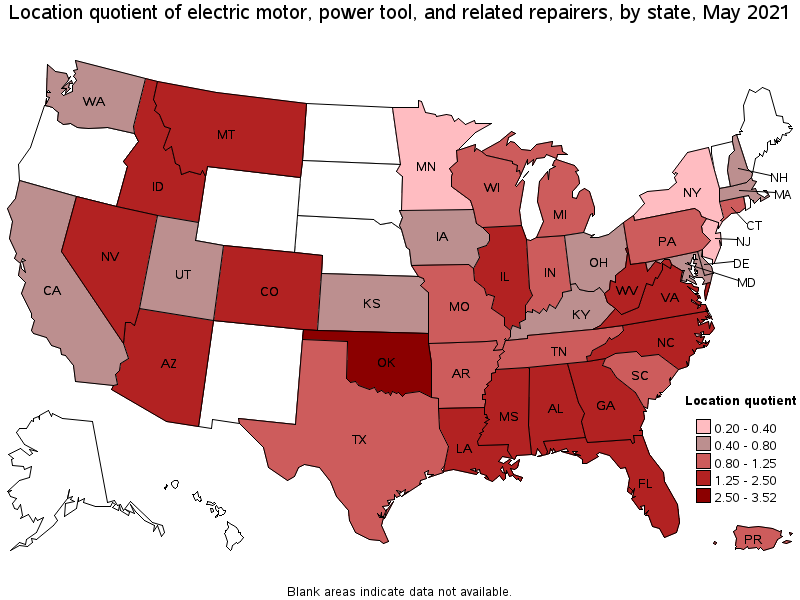
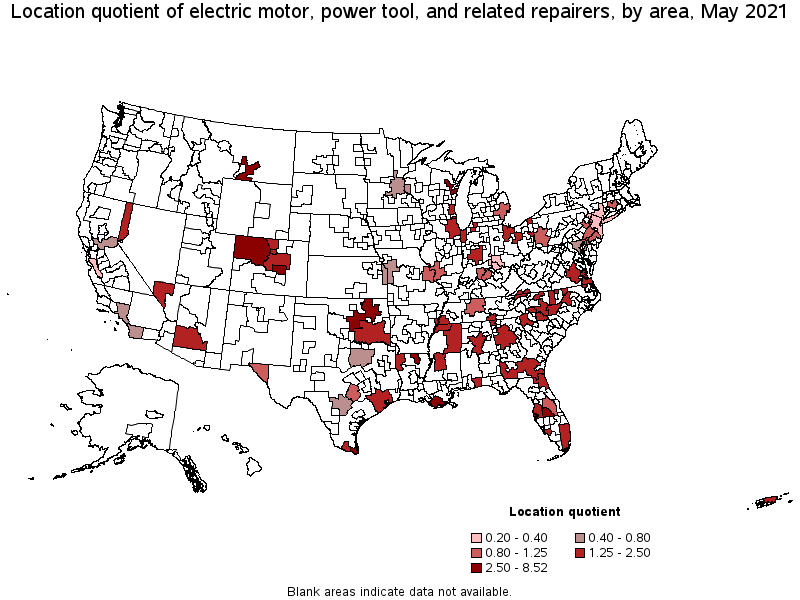
States with the highest concentration of jobs and location quotients in Electric Motor, Power Tool, and Related Repairers:
| State | Employment (1) | Employment per thousand jobs | Location quotient (9) | Hourly mean wage | Annual mean wage (2) |
|---|---|---|---|---|---|
| Oklahoma | 620 | 0.40 | 3.52 | $ 18.25 | $ 37,960 |
| West Virginia | 170 | 0.27 | 2.35 | $ 18.47 | $ 38,420 |
| Colorado | 690 | 0.26 | 2.33 | $ 20.33 | $ 42,280 |
| Georgia | 990 | 0.23 | 2.02 | $ 22.83 | $ 47,490 |
| Virginia | 830 | 0.22 | 1.97 | $ 22.09 | $ 45,950 |
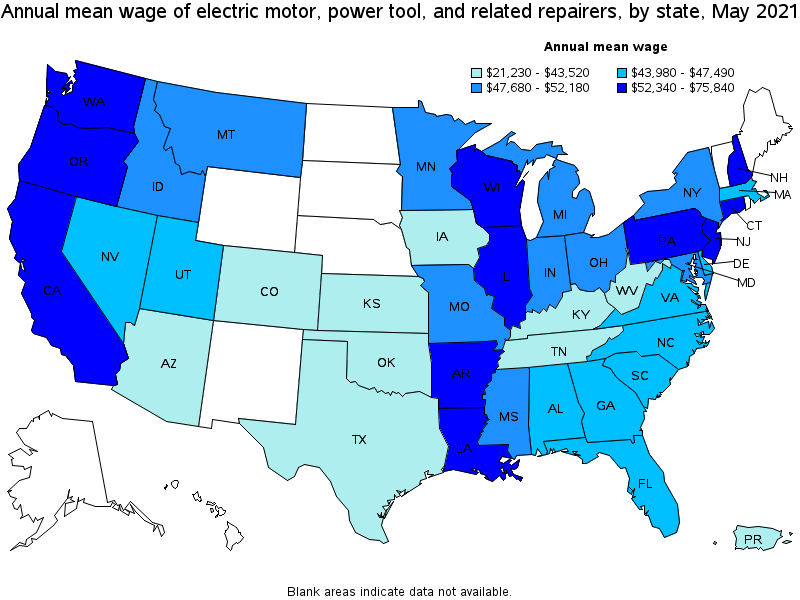
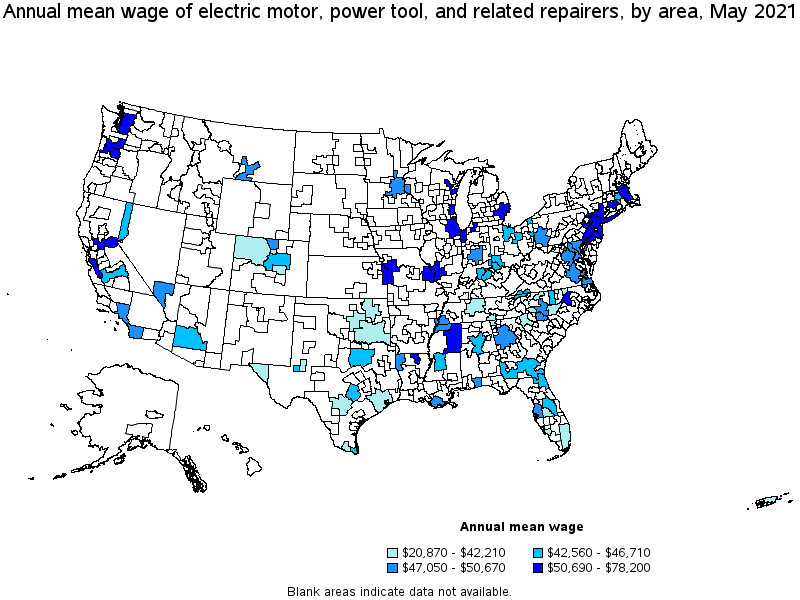
Top paying states for Electric Motor, Power Tool, and Related Repairers:
| State | Employment (1) | Employment per thousand jobs | Location quotient (9) | Hourly mean wage | Annual mean wage (2) |
|---|---|---|---|---|---|
| Illinois | 840 | 0.15 | 1.33 | $ 36.46 | $ 75,840 |
| Connecticut | 180 | 0.12 | 1.04 | $ 33.83 | $ 70,360 |
| New Hampshire | 40 | 0.06 | 0.57 | $ 29.53 | $ 61,410 |
| Washington | 240 | 0.08 | 0.67 | $ 28.70 | $ 59,690 |
| New Jersey | 170 | 0.04 | 0.39 | $ 27.52 | $ 57,240 |
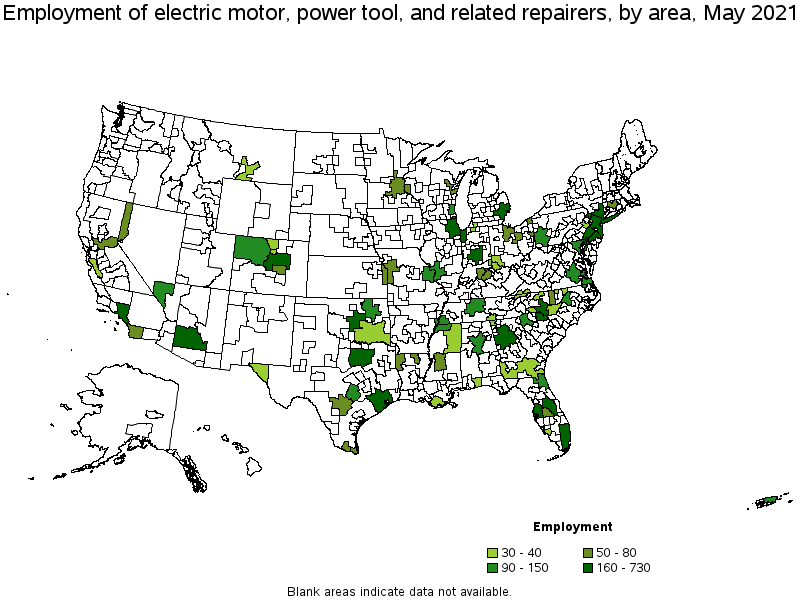
Metropolitan areas with the highest employment level in Electric Motor, Power Tool, and Related Repairers:
| Metropolitan area | Employment (1) | Employment per thousand jobs | Location quotient (9) | Hourly mean wage | Annual mean wage (2) |
|---|---|---|---|---|---|
| Chicago-Naperville-Elgin, IL-IN-WI | 730 | 0.17 | 1.52 | $ 37.60 | $ 78,200 |
| Atlanta-Sandy Springs-Roswell, GA | 700 | 0.27 | 2.41 | $ 24.36 | $ 50,670 |
| Phoenix-Mesa-Scottsdale, AZ | 500 | 0.23 | 2.08 | $ 20.46 | $ 42,560 |
| Houston-The Woodlands-Sugar Land, TX | 410 | 0.14 | 1.26 | $ 19.48 | $ 40,520 |
| Oklahoma City, OK | 400 | 0.66 | 5.90 | $ 18.42 | $ 38,310 |
| Miami-Fort Lauderdale-West Palm Beach, FL | 380 | 0.15 | 1.36 | $ 20.15 | $ 41,920 |
| Los Angeles-Long Beach-Anaheim, CA | 370 | 0.06 | 0.57 | $ 24.34 | $ 50,630 |
| New York-Newark-Jersey City, NY-NJ-PA | 360 | 0.04 | 0.37 | $ 26.65 | $ 55,440 |
| Denver-Aurora-Lakewood, CO | 310 | 0.21 | 1.88 | $ 20.86 | $ 43,400 |
| Dallas-Fort Worth-Arlington, TX | 250 | 0.07 | 0.61 | $ 21.55 | $ 44,820 |
Metropolitan areas with the highest concentration of jobs and location quotients in Electric Motor, Power Tool, and Related Repairers:
| Metropolitan area | Employment (1) | Employment per thousand jobs | Location quotient (9) | Hourly mean wage | Annual mean wage (2) |
|---|---|---|---|---|---|
| Oklahoma City, OK | 400 | 0.66 | 5.90 | $ 18.42 | $ 38,310 |
| Monroe, LA | 50 | 0.62 | 5.50 | $ 26.91 | $ 55,970 |
| Brownsville-Harlingen, TX | 80 | 0.59 | 5.27 | $ 22.46 | $ 46,710 |
| Houma-Thibodaux, LA | 40 | 0.52 | 4.60 | $ 23.99 | $ 49,900 |
| Billings, MT | 40 | 0.45 | 3.99 | $ 23.40 | $ 48,670 |
| Lakeland-Winter Haven, FL | 80 | 0.35 | 3.10 | $ 20.29 | $ 42,200 |
| Tulsa, OK | 140 | 0.32 | 2.88 | $ 18.78 | $ 39,070 |
| Colorado Springs, CO | 80 | 0.29 | 2.59 | $ 19.86 | $ 41,310 |
| Green Bay, WI | 50 | 0.28 | 2.51 | $ 27.63 | $ 57,480 |
| Kingsport-Bristol-Bristol, TN-VA | 30 | 0.28 | 2.49 | $ 20.72 | $ 43,100 |
Top paying metropolitan areas for Electric Motor, Power Tool, and Related Repairers:
| Metropolitan area | Employment (1) | Employment per thousand jobs | Location quotient (9) | Hourly mean wage | Annual mean wage (2) |
|---|---|---|---|---|---|
| Chicago-Naperville-Elgin, IL-IN-WI | 730 | 0.17 | 1.52 | $ 37.60 | $ 78,200 |
| Hartford-West Hartford-East Hartford, CT | 70 | 0.13 | 1.16 | $ 33.52 | $ 69,720 |
| San Jose-Sunnyvale-Santa Clara, CA | 40 | 0.04 | 0.33 | $ 33.33 | $ 69,320 |
| Portland-Vancouver-Hillsboro, OR-WA | (8) | (8) | (8) | $ 31.12 | $ 64,730 |
| Seattle-Tacoma-Bellevue, WA | (8) | (8) | (8) | $ 30.41 | $ 63,250 |
| Green Bay, WI | 50 | 0.28 | 2.51 | $ 27.63 | $ 57,480 |
| Boston-Cambridge-Nashua, MA-NH | (8) | (8) | (8) | $ 27.55 | $ 57,300 |
| Allentown-Bethlehem-Easton, PA-NJ | 40 | 0.11 | 0.98 | $ 26.91 | $ 55,970 |
| Monroe, LA | 50 | 0.62 | 5.50 | $ 26.91 | $ 55,970 |
| Philadelphia-Camden-Wilmington, PA-NJ-DE-MD | 240 | 0.09 | 0.81 | $ 26.87 | $ 55,900 |
Nonmetropolitan areas with the highest employment in Electric Motor, Power Tool, and Related Repairers:
| Nonmetropolitan area | Employment (1) | Employment per thousand jobs | Location quotient (9) | Hourly mean wage | Annual mean wage (2) |
|---|---|---|---|---|---|
| Northwest Colorado nonmetropolitan area | 110 | 0.96 | 8.52 | $ 19.12 | $ 39,760 |
| North Northeastern Ohio nonmetropolitan area (noncontiguous) | 60 | 0.19 | 1.65 | $ 21.53 | $ 44,790 |
| Piedmont North Carolina nonmetropolitan area | 40 | 0.15 | 1.36 | $ 18.40 | $ 38,260 |
| Southeast Oklahoma nonmetropolitan area | 30 | 0.21 | 1.87 | $ 14.53 | $ 30,220 |
| South Georgia nonmetropolitan area | 30 | 0.19 | 1.65 | $ 22.13 | $ 46,040 |
Nonmetropolitan areas with the highest concentration of jobs and location quotients in Electric Motor, Power Tool, and Related Repairers:
| Nonmetropolitan area | Employment (1) | Employment per thousand jobs | Location quotient (9) | Hourly mean wage | Annual mean wage (2) |
|---|---|---|---|---|---|
| Northwest Colorado nonmetropolitan area | 110 | 0.96 | 8.52 | $ 19.12 | $ 39,760 |
| Southeast Oklahoma nonmetropolitan area | 30 | 0.21 | 1.87 | $ 14.53 | $ 30,220 |
| North Northeastern Ohio nonmetropolitan area (noncontiguous) | 60 | 0.19 | 1.65 | $ 21.53 | $ 44,790 |
| South Georgia nonmetropolitan area | 30 | 0.19 | 1.65 | $ 22.13 | $ 46,040 |
| Piedmont North Carolina nonmetropolitan area | 40 | 0.15 | 1.36 | $ 18.40 | $ 38,260 |
Top paying nonmetropolitan areas for Electric Motor, Power Tool, and Related Repairers:
| Nonmetropolitan area | Employment (1) | Employment per thousand jobs | Location quotient (9) | Hourly mean wage | Annual mean wage (2) |
|---|---|---|---|---|---|
| Northeast Mississippi nonmetropolitan area | 30 | 0.14 | 1.28 | $ 24.64 | $ 51,260 |
| South Georgia nonmetropolitan area | 30 | 0.19 | 1.65 | $ 22.13 | $ 46,040 |
| North Northeastern Ohio nonmetropolitan area (noncontiguous) | 60 | 0.19 | 1.65 | $ 21.53 | $ 44,790 |
| Northwest Colorado nonmetropolitan area | 110 | 0.96 | 8.52 | $ 19.12 | $ 39,760 |
| Piedmont North Carolina nonmetropolitan area | 40 | 0.15 | 1.36 | $ 18.40 | $ 38,260 |
These estimates are calculated with data collected from employers in all industry sectors, all metropolitan and nonmetropolitan areas, and all states and the District of Columbia. The top employment and wage figures are provided above. The complete list is available in the downloadable XLS files.
The percentile wage estimate is the value of a wage below which a certain percent of workers fall. The median wage is the 50th percentile wage estimate—50 percent of workers earn less than the median and 50 percent of workers earn more than the median. More about percentile wages.
(1) Estimates for detailed occupations do not sum to the totals because the totals include occupations not shown separately. Estimates do not include self-employed workers.
(2) Annual wages have been calculated by multiplying the hourly mean wage by a "year-round, full-time" hours figure of 2,080 hours; for those occupations where there is not an hourly wage published, the annual wage has been directly calculated from the reported survey data.
(3) The relative standard error (RSE) is a measure of the reliability of a survey statistic. The smaller the relative standard error, the more precise the estimate.
(7) The value is less than .005 percent of industry employment.
(8) Estimate not released.
(9) The location quotient is the ratio of the area concentration of occupational employment to the national average concentration. A location quotient greater than one indicates the occupation has a higher share of employment than average, and a location quotient less than one indicates the occupation is less prevalent in the area than average.
Other OEWS estimates and related information:
May 2021 National Occupational Employment and Wage Estimates
May 2021 State Occupational Employment and Wage Estimates
May 2021 Metropolitan and Nonmetropolitan Area Occupational Employment and Wage Estimates
May 2021 National Industry-Specific Occupational Employment and Wage Estimates
Last Modified Date: March 31, 2022