
An official website of the United States government
An official website of the United States government
The .gov means it's official.
Federal government websites often end in .gov or .mil. Before sharing sensitive information,
make sure you're on a federal government site.
The site is secure.
The
https:// ensures that you are connecting to the official website and that any
information you provide is encrypted and transmitted securely.
Diagnose, adjust, repair, or overhaul motorcycles, scooters, mopeds, dirt bikes, or similar motorized vehicles.
Employment estimate and mean wage estimates for Motorcycle Mechanics:
| Employment (1) | Employment RSE (3) |
Mean hourly wage |
Mean annual wage (2) |
Wage RSE (3) |
|---|---|---|---|---|
| 15,020 | 2.7 % | $ 20.18 | $ 41,970 | 1.0 % |
Percentile wage estimates for Motorcycle Mechanics:
| Percentile | 10% | 25% | 50% (Median) |
75% | 90% |
|---|---|---|---|---|---|
| Hourly Wage | $ 13.41 | $ 14.58 | $ 18.35 | $ 23.11 | $ 29.05 |
| Annual Wage (2) | $ 27,890 | $ 30,320 | $ 38,170 | $ 48,060 | $ 60,420 |
Industries with the highest published employment and wages for Motorcycle Mechanics are provided. For a list of all industries with employment in Motorcycle Mechanics, see the Create Customized Tables function.
Industries with the highest levels of employment in Motorcycle Mechanics:
| Industry | Employment (1) | Percent of industry employment | Hourly mean wage | Annual mean wage (2) |
|---|---|---|---|---|
| Other Motor Vehicle Dealers | 12,550 | 7.68 | $ 20.23 | $ 42,070 |
| Personal and Household Goods Repair and Maintenance | 1,470 | 1.92 | $ 20.31 | $ 42,250 |
| Automotive Repair and Maintenance | 160 | 0.02 | $ 19.11 | $ 39,750 |
| Other Transportation Equipment Manufacturing | 120 | 0.33 | $ 21.60 | $ 44,920 |
| Rental and leasing services (5322, 5323, and 5324 only) | 110 | 0.04 | $ 21.61 | $ 44,940 |
Industries with the highest concentration of employment in Motorcycle Mechanics:
| Industry | Employment (1) | Percent of industry employment | Hourly mean wage | Annual mean wage (2) |
|---|---|---|---|---|
| Other Motor Vehicle Dealers | 12,550 | 7.68 | $ 20.23 | $ 42,070 |
| Personal and Household Goods Repair and Maintenance | 1,470 | 1.92 | $ 20.31 | $ 42,250 |
| Other Transportation Equipment Manufacturing | 120 | 0.33 | $ 21.60 | $ 44,920 |
| Rental and leasing services (5322, 5323, and 5324 only) | 110 | 0.04 | $ 21.61 | $ 44,940 |
| Lawn and Garden Equipment and Supplies Stores | 30 | 0.02 | $ 21.65 | $ 45,040 |
Top paying industries for Motorcycle Mechanics:
| Industry | Employment (1) | Percent of industry employment | Hourly mean wage | Annual mean wage (2) |
|---|---|---|---|---|
| Lawn and Garden Equipment and Supplies Stores | 30 | 0.02 | $ 21.65 | $ 45,040 |
| Rental and leasing services (5322, 5323, and 5324 only) | 110 | 0.04 | $ 21.61 | $ 44,940 |
| Other Transportation Equipment Manufacturing | 120 | 0.33 | $ 21.60 | $ 44,920 |
| Personal and Household Goods Repair and Maintenance | 1,470 | 1.92 | $ 20.31 | $ 42,250 |
| Other Motor Vehicle Dealers | 12,550 | 7.68 | $ 20.23 | $ 42,070 |
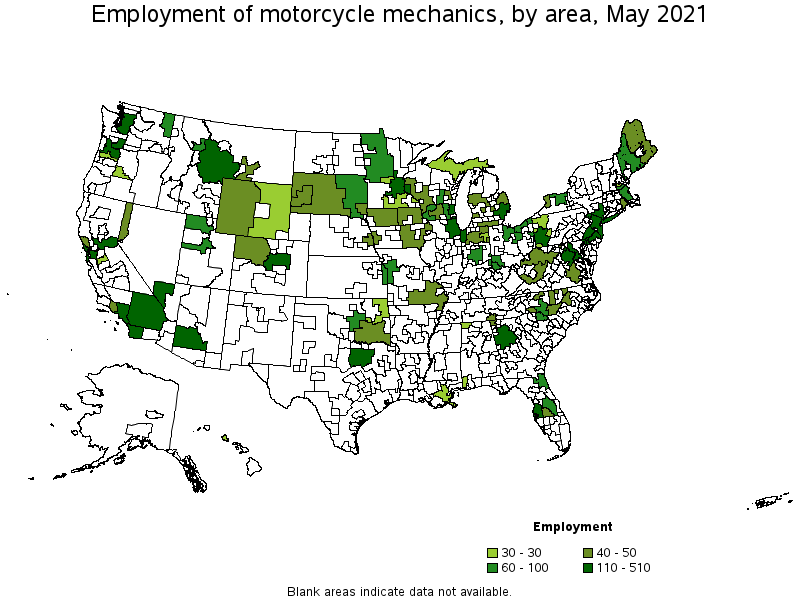
States and areas with the highest published employment, location quotients, and wages for Motorcycle Mechanics are provided. For a list of all areas with employment in Motorcycle Mechanics, see the Create Customized Tables function.
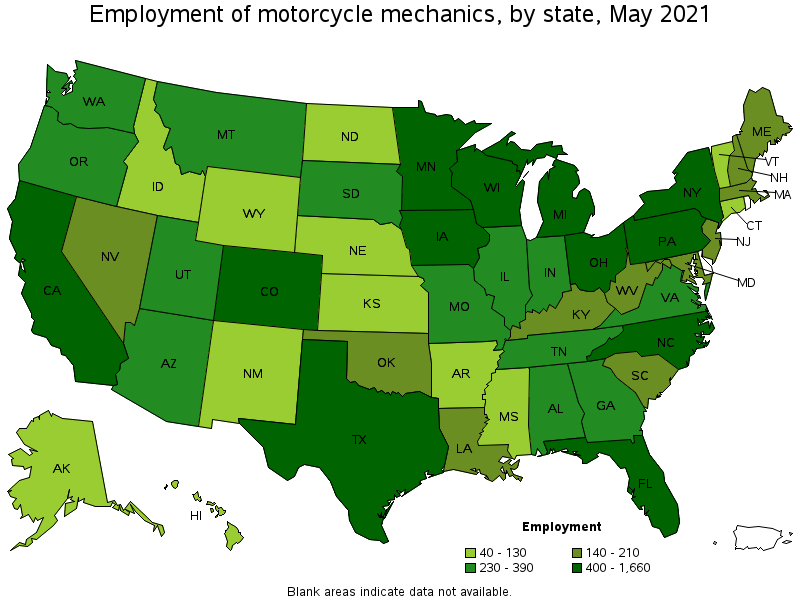
States with the highest employment level in Motorcycle Mechanics:
| State | Employment (1) | Employment per thousand jobs | Location quotient (9) | Hourly mean wage | Annual mean wage (2) |
|---|---|---|---|---|---|
| California | 1,660 | 0.10 | 0.94 | $ 24.35 | $ 50,640 |
| Florida | 920 | 0.11 | 1.00 | $ 19.83 | $ 41,240 |
| Texas | 830 | 0.07 | 0.64 | $ 19.42 | $ 40,380 |
| Pennsylvania | 660 | 0.12 | 1.11 | $ 18.07 | $ 37,590 |
| New York | 620 | 0.07 | 0.67 | $ 20.96 | $ 43,600 |
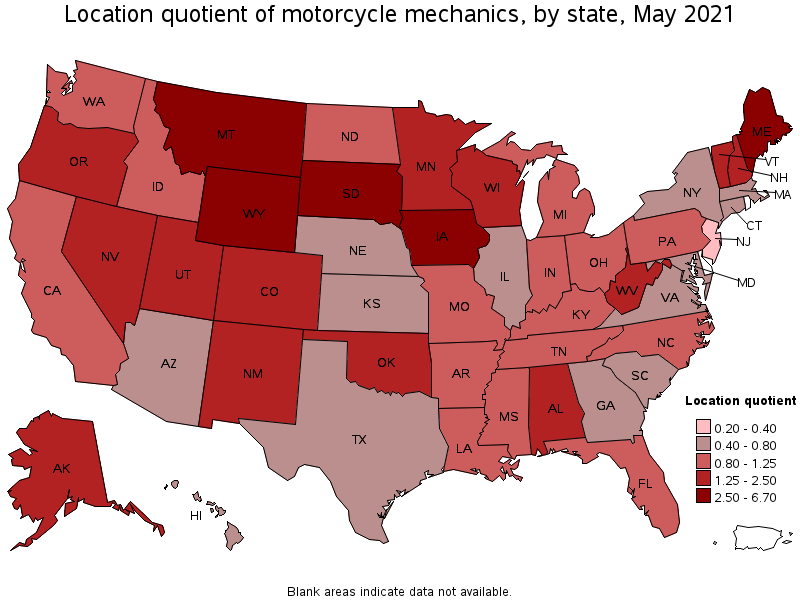
States with the highest concentration of jobs and location quotients in Motorcycle Mechanics:
| State | Employment (1) | Employment per thousand jobs | Location quotient (9) | Hourly mean wage | Annual mean wage (2) |
|---|---|---|---|---|---|
| Montana | 340 | 0.71 | 6.70 | $ 18.76 | $ 39,020 |
| South Dakota | 230 | 0.54 | 5.10 | $ 17.57 | $ 36,550 |
| Wyoming | 100 | 0.38 | 3.58 | $ 20.10 | $ 41,810 |
| Maine | 210 | 0.36 | 3.33 | $ 19.26 | $ 40,060 |
| Iowa | 400 | 0.27 | 2.55 | $ 19.26 | $ 40,060 |
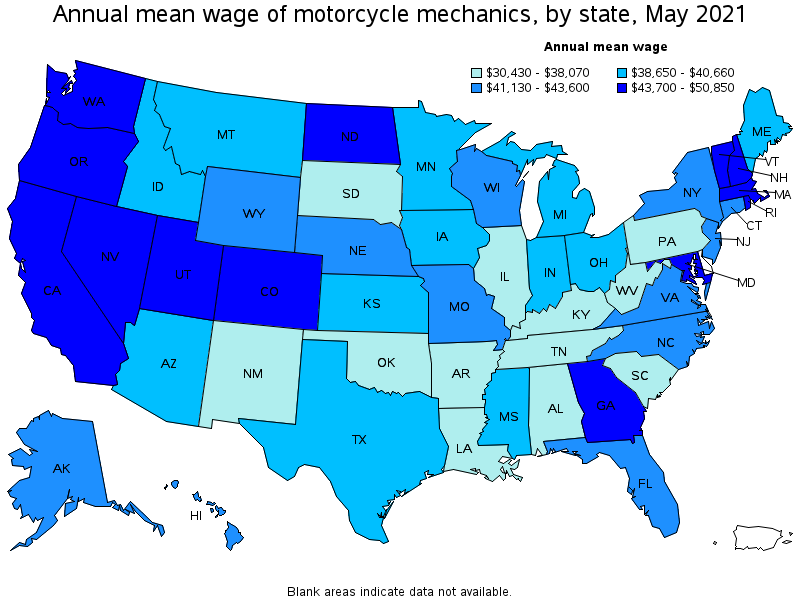
Top paying states for Motorcycle Mechanics:
| State | Employment (1) | Employment per thousand jobs | Location quotient (9) | Hourly mean wage | Annual mean wage (2) |
|---|---|---|---|---|---|
| Nevada | 180 | 0.14 | 1.34 | $ 24.45 | $ 50,850 |
| Vermont | 50 | 0.16 | 1.50 | $ 24.39 | $ 50,720 |
| California | 1,660 | 0.10 | 0.94 | $ 24.35 | $ 50,640 |
| Rhode Island | (8) | (8) | (8) | $ 23.84 | $ 49,590 |
| New Hampshire | 150 | 0.24 | 2.22 | $ 23.40 | $ 48,660 |
Metropolitan areas with the highest employment level in Motorcycle Mechanics:
| Metropolitan area | Employment (1) | Employment per thousand jobs | Location quotient (9) | Hourly mean wage | Annual mean wage (2) |
|---|---|---|---|---|---|
| Los Angeles-Long Beach-Anaheim, CA | 510 | 0.09 | 0.84 | $ 26.63 | $ 55,390 |
| New York-Newark-Jersey City, NY-NJ-PA | 420 | 0.05 | 0.46 | $ 20.97 | $ 43,610 |
| Minneapolis-St. Paul-Bloomington, MN-WI | 280 | 0.15 | 1.44 | $ 20.75 | $ 43,160 |
| Riverside-San Bernardino-Ontario, CA | 220 | 0.15 | 1.37 | $ 21.95 | $ 45,650 |
| Chicago-Naperville-Elgin, IL-IN-WI | 200 | 0.05 | 0.44 | $ 19.60 | $ 40,770 |
| San Diego-Carlsbad, CA | 190 | 0.14 | 1.31 | $ 23.80 | $ 49,510 |
| Washington-Arlington-Alexandria, DC-VA-MD-WV | 190 | 0.06 | 0.60 | $ 23.24 | $ 48,340 |
| Denver-Aurora-Lakewood, CO | 190 | 0.13 | 1.21 | $ 22.09 | $ 45,940 |
| Philadelphia-Camden-Wilmington, PA-NJ-DE-MD | 190 | 0.07 | 0.66 | $ 18.89 | $ 39,300 |
| Dallas-Fort Worth-Arlington, TX | 170 | 0.05 | 0.44 | $ 21.74 | $ 45,220 |
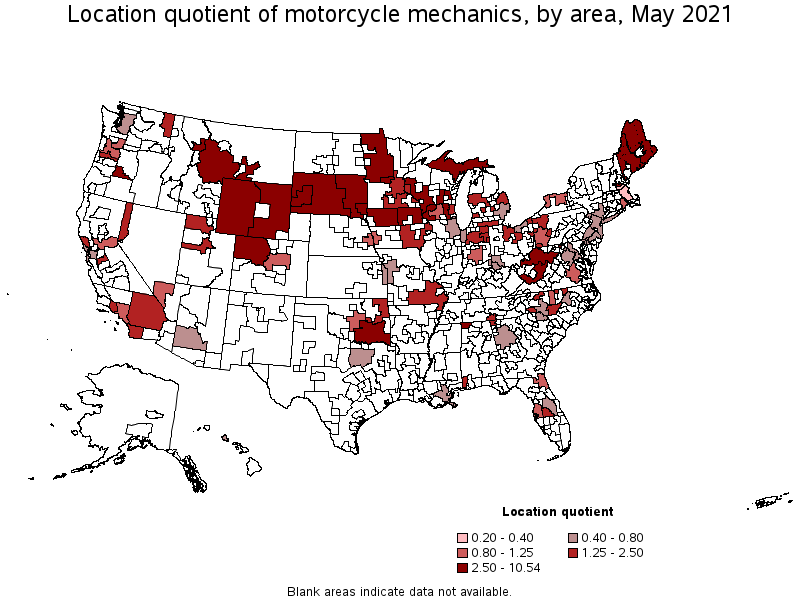
Metropolitan areas with the highest concentration of jobs and location quotients in Motorcycle Mechanics:
| Metropolitan area | Employment (1) | Employment per thousand jobs | Location quotient (9) | Hourly mean wage | Annual mean wage (2) |
|---|---|---|---|---|---|
| Missoula, MT | 70 | 1.12 | 10.54 | $ 17.34 | $ 36,070 |
| Rapid City, SD | 50 | 0.76 | 7.14 | $ 19.64 | $ 40,840 |
| Florence-Muscle Shoals, AL | 30 | 0.63 | 5.93 | $ 18.46 | $ 38,390 |
| Billings, MT | 50 | 0.57 | 5.32 | $ 17.70 | $ 36,810 |
| Bend-Redmond, OR | 30 | 0.38 | 3.55 | $ 21.94 | $ 45,630 |
| Appleton, WI | 40 | 0.37 | 3.49 | $ 20.89 | $ 43,440 |
| St. Cloud, MN | 30 | 0.32 | 2.98 | $ 18.71 | $ 38,920 |
| Manchester, NH | 30 | 0.31 | 2.86 | $ 25.13 | $ 52,280 |
| Sioux Falls, SD | 50 | 0.29 | 2.74 | $ 17.27 | $ 35,920 |
| Spokane-Spokane Valley, WA | 60 | 0.26 | 2.42 | $ 21.20 | $ 44,090 |
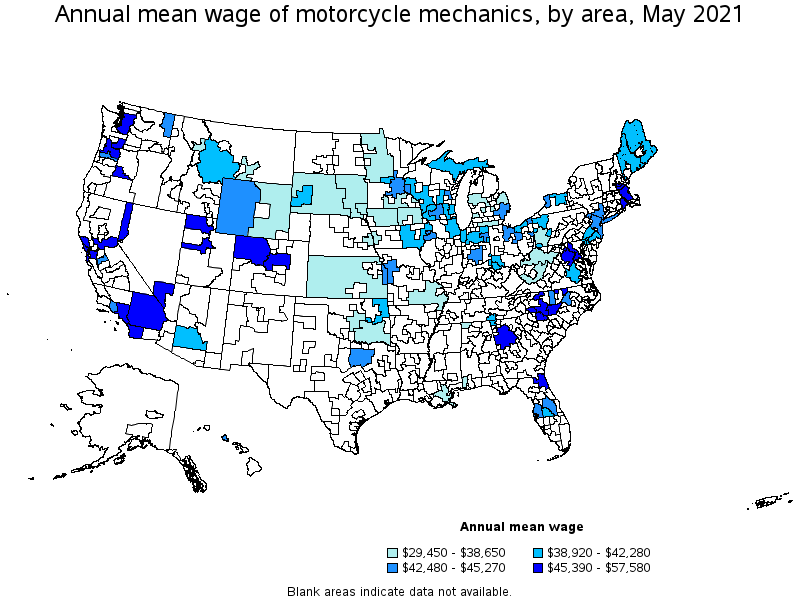
Top paying metropolitan areas for Motorcycle Mechanics:
| Metropolitan area | Employment (1) | Employment per thousand jobs | Location quotient (9) | Hourly mean wage | Annual mean wage (2) |
|---|---|---|---|---|---|
| San Francisco-Oakland-Hayward, CA | 140 | 0.06 | 0.59 | $ 27.68 | $ 57,580 |
| Los Angeles-Long Beach-Anaheim, CA | 510 | 0.09 | 0.84 | $ 26.63 | $ 55,390 |
| Manchester, NH | 30 | 0.31 | 2.86 | $ 25.13 | $ 52,280 |
| Las Vegas-Henderson-Paradise, NV | 110 | 0.12 | 1.11 | $ 24.77 | $ 51,520 |
| San Diego-Carlsbad, CA | 190 | 0.14 | 1.31 | $ 23.80 | $ 49,510 |
| Reno, NV | 50 | 0.20 | 1.85 | $ 23.72 | $ 49,340 |
| Santa Rosa, CA | 40 | 0.18 | 1.73 | $ 23.71 | $ 49,330 |
| Boston-Cambridge-Nashua, MA-NH | 90 | 0.03 | 0.33 | $ 23.46 | $ 48,810 |
| Washington-Arlington-Alexandria, DC-VA-MD-WV | 190 | 0.06 | 0.60 | $ 23.24 | $ 48,340 |
| Providence-Warwick, RI-MA | 50 | 0.10 | 0.93 | $ 23.16 | $ 48,170 |
Nonmetropolitan areas with the highest employment in Motorcycle Mechanics:
| Nonmetropolitan area | Employment (1) | Employment per thousand jobs | Location quotient (9) | Hourly mean wage | Annual mean wage (2) |
|---|---|---|---|---|---|
| Southwest Montana nonmetropolitan area | 110 | 0.77 | 7.18 | $ 19.70 | $ 40,980 |
| East South Dakota nonmetropolitan area | 90 | 0.71 | 6.64 | $ 17.20 | $ 35,770 |
| Southwest Maine nonmetropolitan area | 80 | 0.45 | 4.26 | $ 19.15 | $ 39,840 |
| South Central Wisconsin nonmetropolitan area | 60 | 0.32 | 3.04 | $ 19.38 | $ 40,300 |
| North Northeastern Ohio nonmetropolitan area (noncontiguous) | 60 | 0.20 | 1.85 | $ 20.83 | $ 43,330 |
Nonmetropolitan areas with the highest concentration of jobs and location quotients in Motorcycle Mechanics:
| Nonmetropolitan area | Employment (1) | Employment per thousand jobs | Location quotient (9) | Hourly mean wage | Annual mean wage (2) |
|---|---|---|---|---|---|
| Northeast Maine nonmetropolitan area | 50 | 0.81 | 7.56 | $ 18.92 | $ 39,340 |
| Southwest Montana nonmetropolitan area | 110 | 0.77 | 7.18 | $ 19.70 | $ 40,980 |
| East South Dakota nonmetropolitan area | 90 | 0.71 | 6.64 | $ 17.20 | $ 35,770 |
| West South Dakota nonmetropolitan area | 40 | 0.68 | 6.41 | $ 16.25 | $ 33,790 |
| Southern West Virginia nonmetropolitan area | 40 | 0.55 | 5.19 | $ 14.27 | $ 29,690 |
Top paying nonmetropolitan areas for Motorcycle Mechanics:
| Nonmetropolitan area | Employment (1) | Employment per thousand jobs | Location quotient (9) | Hourly mean wage | Annual mean wage (2) |
|---|---|---|---|---|---|
| Northwest Colorado nonmetropolitan area | 40 | 0.35 | 3.25 | $ 22.07 | $ 45,900 |
| Piedmont North Carolina nonmetropolitan area | 50 | 0.20 | 1.85 | $ 21.82 | $ 45,390 |
| North Northeastern Ohio nonmetropolitan area (noncontiguous) | 60 | 0.20 | 1.85 | $ 20.83 | $ 43,330 |
| Western Wyoming nonmetropolitan area | 40 | 0.46 | 4.27 | $ 20.76 | $ 43,190 |
| Upper Peninsula of Michigan nonmetropolitan area | 30 | 0.31 | 2.88 | $ 20.12 | $ 41,840 |
These estimates are calculated with data collected from employers in all industry sectors, all metropolitan and nonmetropolitan areas, and all states and the District of Columbia. The top employment and wage figures are provided above. The complete list is available in the downloadable XLS files.
The percentile wage estimate is the value of a wage below which a certain percent of workers fall. The median wage is the 50th percentile wage estimate—50 percent of workers earn less than the median and 50 percent of workers earn more than the median. More about percentile wages.
(1) Estimates for detailed occupations do not sum to the totals because the totals include occupations not shown separately. Estimates do not include self-employed workers.
(2) Annual wages have been calculated by multiplying the hourly mean wage by a "year-round, full-time" hours figure of 2,080 hours; for those occupations where there is not an hourly wage published, the annual wage has been directly calculated from the reported survey data.
(3) The relative standard error (RSE) is a measure of the reliability of a survey statistic. The smaller the relative standard error, the more precise the estimate.
(8) Estimate not released.
(9) The location quotient is the ratio of the area concentration of occupational employment to the national average concentration. A location quotient greater than one indicates the occupation has a higher share of employment than average, and a location quotient less than one indicates the occupation is less prevalent in the area than average.
Other OEWS estimates and related information:
May 2021 National Occupational Employment and Wage Estimates
May 2021 State Occupational Employment and Wage Estimates
May 2021 Metropolitan and Nonmetropolitan Area Occupational Employment and Wage Estimates
May 2021 National Industry-Specific Occupational Employment and Wage Estimates
Last Modified Date: March 31, 2022