
An official website of the United States government
An official website of the United States government
The .gov means it's official.
Federal government websites often end in .gov or .mil. Before sharing sensitive information,
make sure you're on a federal government site.
The site is secure.
The
https:// ensures that you are connecting to the official website and that any
information you provide is encrypted and transmitted securely.
Repair and service bicycles.
Employment estimate and mean wage estimates for Bicycle Repairers:
| Employment (1) | Employment RSE (3) |
Mean hourly wage |
Mean annual wage (2) |
Wage RSE (3) |
|---|---|---|---|---|
| 14,760 | 5.1 % | $ 16.52 | $ 34,360 | 0.8 % |
Percentile wage estimates for Bicycle Repairers:
| Percentile | 10% | 25% | 50% (Median) |
75% | 90% |
|---|---|---|---|---|---|
| Hourly Wage | $ 12.00 | $ 14.00 | $ 16.68 | $ 18.23 | $ 22.22 |
| Annual Wage (2) | $ 24,960 | $ 29,120 | $ 34,690 | $ 37,920 | $ 46,210 |
Industries with the highest published employment and wages for Bicycle Repairers are provided. For a list of all industries with employment in Bicycle Repairers, see the Create Customized Tables function.
Industries with the highest levels of employment in Bicycle Repairers:
| Industry | Employment (1) | Percent of industry employment | Hourly mean wage | Annual mean wage (2) |
|---|---|---|---|---|
| Sporting Goods, Hobby, and Musical Instrument Stores | 12,400 | 2.70 | $ 16.34 | $ 33,990 |
| Rental and leasing services (5322, 5323, and 5324 only) | 590 | 0.20 | $ 19.35 | $ 40,240 |
| Personal and Household Goods Repair and Maintenance | 480 | 0.62 | $ 17.09 | $ 35,550 |
| Miscellaneous Store Retailers (4532 and 4533 only) | 190 | 0.05 | $ 13.07 | $ 27,190 |
| Other Amusement and Recreation Industries | 120 | 0.01 | $ 17.45 | $ 36,300 |
Industries with the highest concentration of employment in Bicycle Repairers:
| Industry | Employment (1) | Percent of industry employment | Hourly mean wage | Annual mean wage (2) |
|---|---|---|---|---|
| Sporting Goods, Hobby, and Musical Instrument Stores | 12,400 | 2.70 | $ 16.34 | $ 33,990 |
| Personal and Household Goods Repair and Maintenance | 480 | 0.62 | $ 17.09 | $ 35,550 |
| Rental and leasing services (5322, 5323, and 5324 only) | 590 | 0.20 | $ 19.35 | $ 40,240 |
| Other Motor Vehicle Dealers | 100 | 0.06 | $ 17.85 | $ 37,120 |
| Miscellaneous Store Retailers (4532 and 4533 only) | 190 | 0.05 | $ 13.07 | $ 27,190 |
Top paying industries for Bicycle Repairers:
| Industry | Employment (1) | Percent of industry employment | Hourly mean wage | Annual mean wage (2) |
|---|---|---|---|---|
| Merchant Wholesalers, Durable Goods (4232, 4233, 4235, 4236, 4237, and 4239 only) | 100 | 0.01 | $ 21.46 | $ 44,630 |
| Rental and leasing services (5322, 5323, and 5324 only) | 590 | 0.20 | $ 19.35 | $ 40,240 |
| Electronic Shopping and Mail-Order Houses | (8) | (8) | $ 18.59 | $ 38,680 |
| Other Motor Vehicle Dealers | 100 | 0.06 | $ 17.85 | $ 37,120 |
| Other Amusement and Recreation Industries | 120 | 0.01 | $ 17.45 | $ 36,300 |
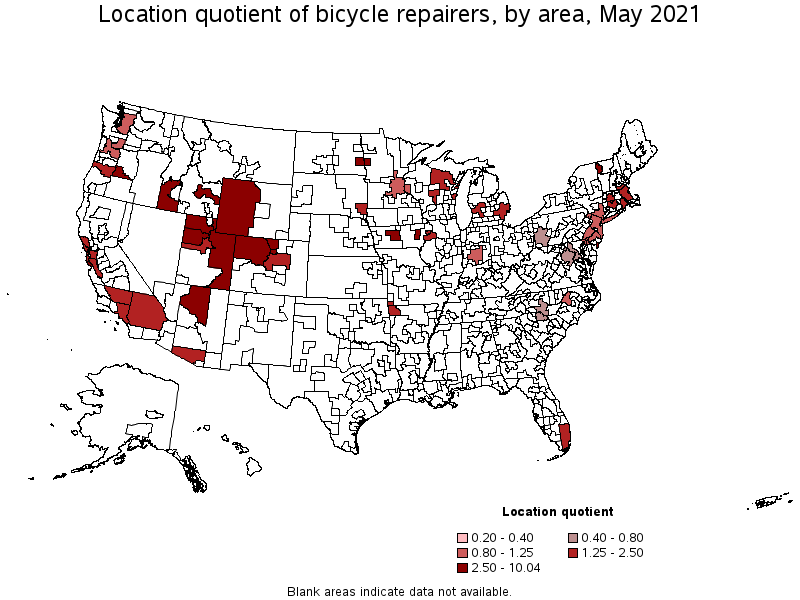
States and areas with the highest published employment, location quotients, and wages for Bicycle Repairers are provided. For a list of all areas with employment in Bicycle Repairers, see the Create Customized Tables function.
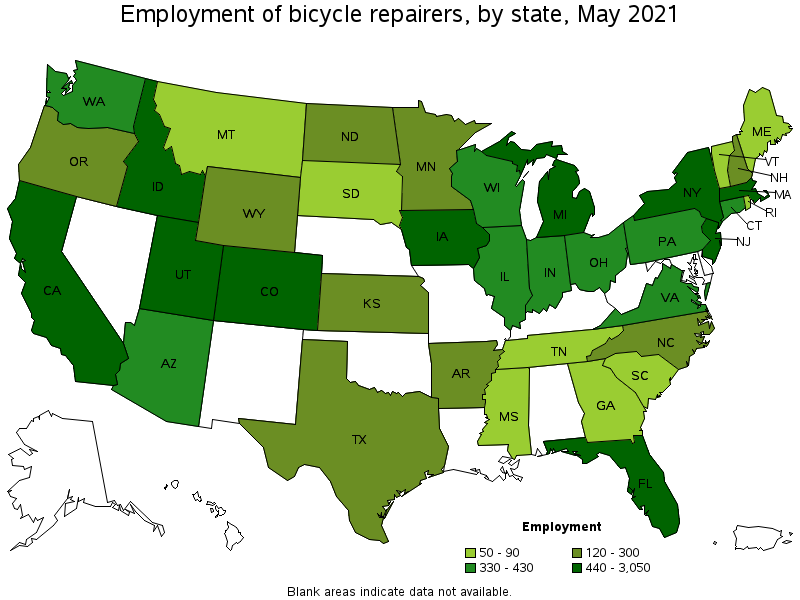
States with the highest employment level in Bicycle Repairers:
| State | Employment (1) | Employment per thousand jobs | Location quotient (9) | Hourly mean wage | Annual mean wage (2) |
|---|---|---|---|---|---|
| California | 3,050 | 0.18 | 1.76 | $ 17.83 | $ 37,080 |
| New Jersey | 710 | 0.18 | 1.75 | $ 17.96 | $ 37,350 |
| Florida | 700 | 0.08 | 0.78 | $ 16.13 | $ 33,550 |
| Michigan | 650 | 0.16 | 1.52 | $ 15.03 | $ 31,260 |
| Colorado | 590 | 0.23 | 2.16 | $ 18.42 | $ 38,310 |
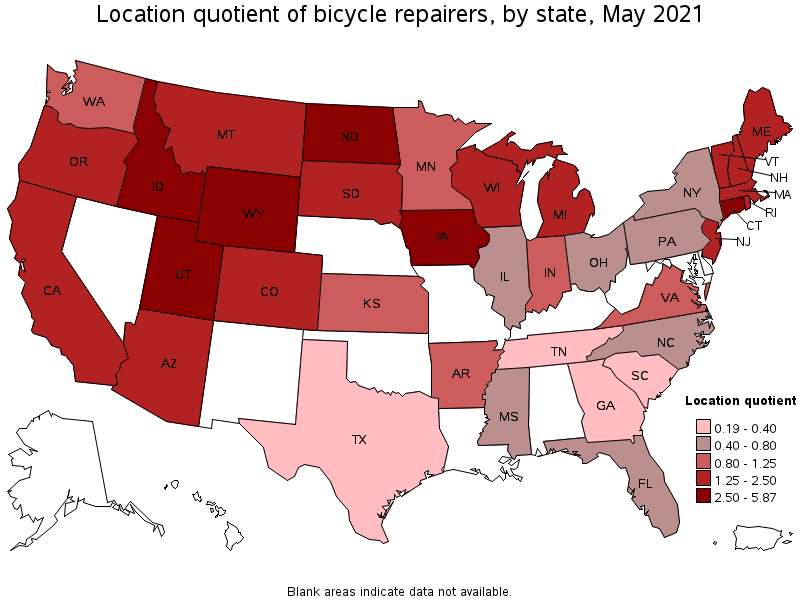
States with the highest concentration of jobs and location quotients in Bicycle Repairers:
| State | Employment (1) | Employment per thousand jobs | Location quotient (9) | Hourly mean wage | Annual mean wage (2) |
|---|---|---|---|---|---|
| Idaho | 470 | 0.61 | 5.87 | $ 14.96 | $ 31,130 |
| North Dakota | 220 | 0.56 | 5.34 | $ 14.83 | $ 30,850 |
| Wyoming | 120 | 0.45 | 4.31 | $ 20.06 | $ 41,710 |
| Utah | 540 | 0.34 | 3.29 | $ 15.16 | $ 31,540 |
| Iowa | 470 | 0.32 | 3.05 | $ 13.58 | $ 28,250 |
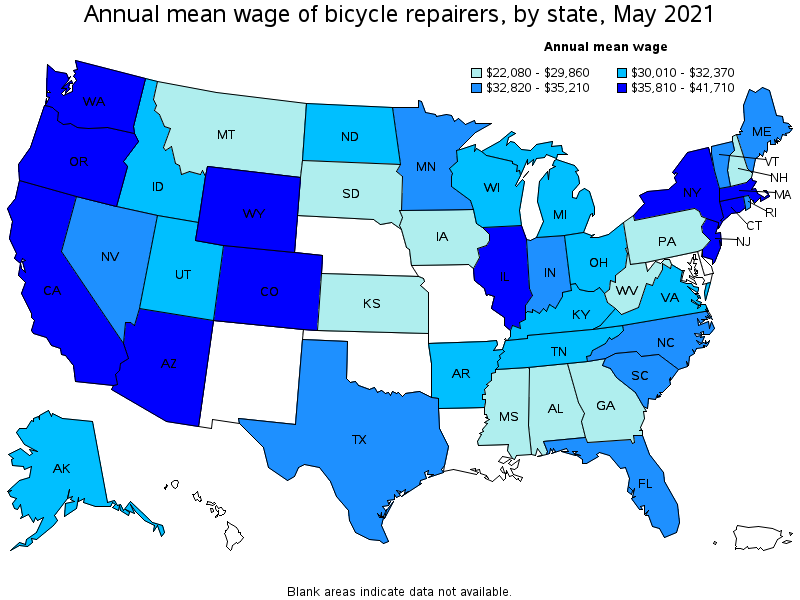
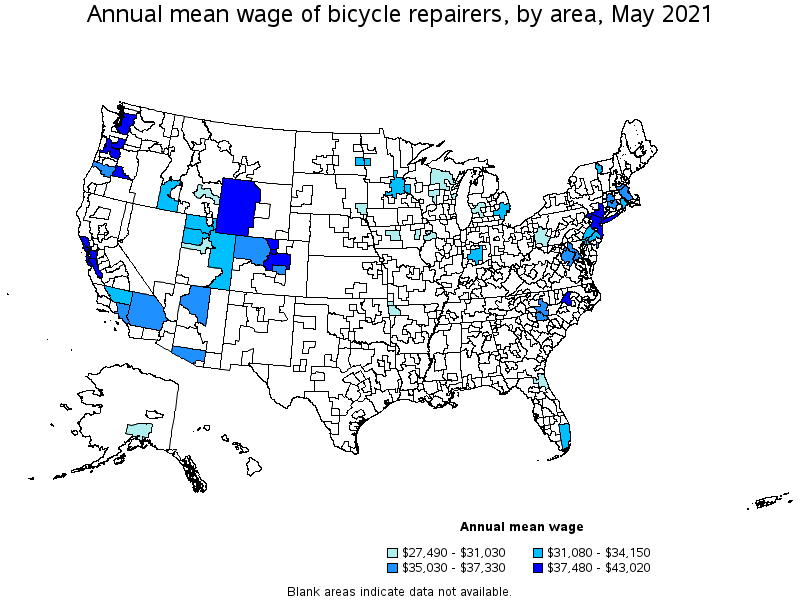
Top paying states for Bicycle Repairers:
| State | Employment (1) | Employment per thousand jobs | Location quotient (9) | Hourly mean wage | Annual mean wage (2) |
|---|---|---|---|---|---|
| Wyoming | 120 | 0.45 | 4.31 | $ 20.06 | $ 41,710 |
| New York | 440 | 0.05 | 0.49 | $ 18.89 | $ 39,300 |
| Colorado | 590 | 0.23 | 2.16 | $ 18.42 | $ 38,310 |
| Washington | 370 | 0.12 | 1.11 | $ 18.17 | $ 37,790 |
| New Jersey | 710 | 0.18 | 1.75 | $ 17.96 | $ 37,350 |
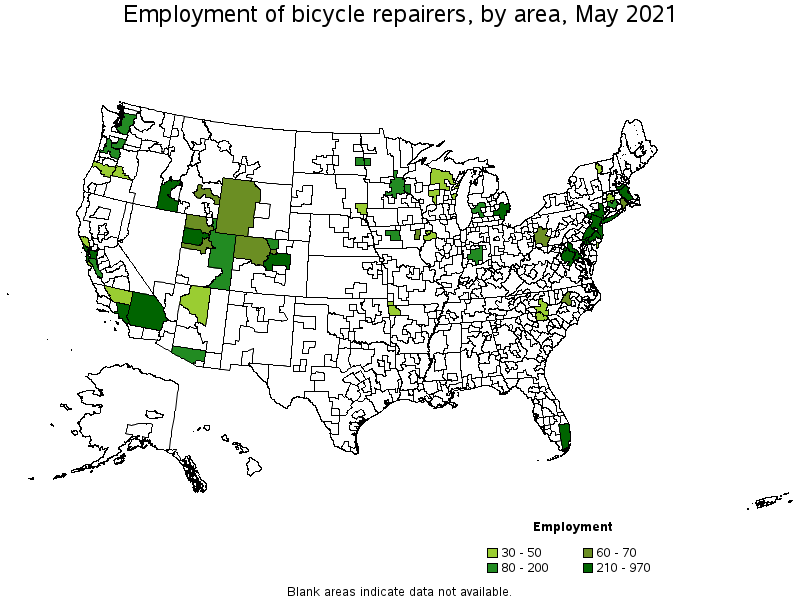
Metropolitan areas with the highest employment level in Bicycle Repairers:
| Metropolitan area | Employment (1) | Employment per thousand jobs | Location quotient (9) | Hourly mean wage | Annual mean wage (2) |
|---|---|---|---|---|---|
| Los Angeles-Long Beach-Anaheim, CA | 970 | 0.17 | 1.61 | $ 17.33 | $ 36,040 |
| New York-Newark-Jersey City, NY-NJ-PA | 810 | 0.09 | 0.89 | $ 18.94 | $ 39,380 |
| Miami-Fort Lauderdale-West Palm Beach, FL | 390 | 0.16 | 1.51 | $ 16.36 | $ 34,030 |
| Boston-Cambridge-Nashua, MA-NH | 380 | 0.15 | 1.39 | $ 17.95 | $ 37,330 |
| San Francisco-Oakland-Hayward, CA | 370 | 0.17 | 1.59 | $ 20.02 | $ 41,650 |
| Detroit-Warren-Dearborn, MI | 280 | 0.15 | 1.48 | $ 15.54 | $ 32,310 |
| Riverside-San Bernardino-Ontario, CA | 260 | 0.17 | 1.65 | $ 17.00 | $ 35,360 |
| Washington-Arlington-Alexandria, DC-VA-MD-WV | 240 | 0.08 | 0.78 | $ 17.61 | $ 36,620 |
| Salt Lake City, UT | 230 | 0.31 | 2.99 | $ 16.17 | $ 33,640 |
| Philadelphia-Camden-Wilmington, PA-NJ-DE-MD | 230 | 0.09 | 0.82 | $ 16.11 | $ 33,520 |
Metropolitan areas with the highest concentration of jobs and location quotients in Bicycle Repairers:
| Metropolitan area | Employment (1) | Employment per thousand jobs | Location quotient (9) | Hourly mean wage | Annual mean wage (2) |
|---|---|---|---|---|---|
| Idaho Falls, ID | 60 | 0.88 | 8.37 | $ 14.61 | $ 30,390 |
| Ocean City, NJ | 30 | 0.77 | 7.33 | $ 17.79 | $ 37,000 |
| Iowa City, IA | 70 | 0.76 | 7.26 | $ 13.22 | $ 27,490 |
| Boise City, ID | 210 | 0.63 | 6.00 | $ 15.03 | $ 31,250 |
| Flagstaff, AZ | 40 | 0.62 | 5.92 | $ 16.98 | $ 35,320 |
| Bend-Redmond, OR | 50 | 0.57 | 5.48 | $ 18.02 | $ 37,480 |
| Fargo, ND-MN | 80 | 0.56 | 5.36 | $ 14.94 | $ 31,080 |
| Santa Cruz-Watsonville, CA | 50 | 0.55 | 5.23 | $ 18.83 | $ 39,160 |
| Fort Collins, CO | 80 | 0.50 | 4.72 | $ 18.47 | $ 38,410 |
| Boulder, CO | 70 | 0.39 | 3.73 | $ 19.62 | $ 40,810 |
Top paying metropolitan areas for Bicycle Repairers:
| Metropolitan area | Employment (1) | Employment per thousand jobs | Location quotient (9) | Hourly mean wage | Annual mean wage (2) |
|---|---|---|---|---|---|
| San Jose-Sunnyvale-Santa Clara, CA | 160 | 0.15 | 1.43 | $ 20.27 | $ 42,150 |
| San Francisco-Oakland-Hayward, CA | 370 | 0.17 | 1.59 | $ 20.02 | $ 41,650 |
| Boulder, CO | 70 | 0.39 | 3.73 | $ 19.62 | $ 40,810 |
| Seattle-Tacoma-Bellevue, WA | 200 | 0.11 | 1.00 | $ 19.22 | $ 39,980 |
| Denver-Aurora-Lakewood, CO | 220 | 0.15 | 1.42 | $ 19.17 | $ 39,870 |
| New York-Newark-Jersey City, NY-NJ-PA | 810 | 0.09 | 0.89 | $ 18.94 | $ 39,380 |
| Santa Cruz-Watsonville, CA | 50 | 0.55 | 5.23 | $ 18.83 | $ 39,160 |
| Santa Rosa, CA | 40 | 0.23 | 2.19 | $ 18.77 | $ 39,040 |
| Fort Collins, CO | 80 | 0.50 | 4.72 | $ 18.47 | $ 38,410 |
| Portland-Vancouver-Hillsboro, OR-WA | 110 | 0.10 | 0.97 | $ 18.40 | $ 38,270 |
Nonmetropolitan areas with the highest employment in Bicycle Repairers:
| Nonmetropolitan area | Employment (1) | Employment per thousand jobs | Location quotient (9) | Hourly mean wage | Annual mean wage (2) |
|---|---|---|---|---|---|
| Eastern Utah nonmetropolitan area | 80 | 1.05 | 10.04 | $ 14.99 | $ 31,180 |
| Northwest Colorado nonmetropolitan area | 70 | 0.63 | 6.03 | $ 17.13 | $ 35,620 |
| Western Wyoming nonmetropolitan area | 70 | 0.78 | 7.42 | $ 20.68 | $ 43,020 |
| Northeastern Wisconsin nonmetropolitan area | 40 | 0.18 | 1.75 | $ 14.46 | $ 30,080 |
Nonmetropolitan areas with the highest concentration of jobs and location quotients in Bicycle Repairers:
| Nonmetropolitan area | Employment (1) | Employment per thousand jobs | Location quotient (9) | Hourly mean wage | Annual mean wage (2) |
|---|---|---|---|---|---|
| Eastern Utah nonmetropolitan area | 80 | 1.05 | 10.04 | $ 14.99 | $ 31,180 |
| Western Wyoming nonmetropolitan area | 70 | 0.78 | 7.42 | $ 20.68 | $ 43,020 |
| Northwest Colorado nonmetropolitan area | 70 | 0.63 | 6.03 | $ 17.13 | $ 35,620 |
| Northeastern Wisconsin nonmetropolitan area | 40 | 0.18 | 1.75 | $ 14.46 | $ 30,080 |
Top paying nonmetropolitan areas for Bicycle Repairers:
| Nonmetropolitan area | Employment (1) | Employment per thousand jobs | Location quotient (9) | Hourly mean wage | Annual mean wage (2) |
|---|---|---|---|---|---|
| Western Wyoming nonmetropolitan area | 70 | 0.78 | 7.42 | $ 20.68 | $ 43,020 |
| Northwest Colorado nonmetropolitan area | 70 | 0.63 | 6.03 | $ 17.13 | $ 35,620 |
| Eastern Utah nonmetropolitan area | 80 | 1.05 | 10.04 | $ 14.99 | $ 31,180 |
| Northeastern Wisconsin nonmetropolitan area | 40 | 0.18 | 1.75 | $ 14.46 | $ 30,080 |
These estimates are calculated with data collected from employers in all industry sectors, all metropolitan and nonmetropolitan areas, and all states and the District of Columbia. The top employment and wage figures are provided above. The complete list is available in the downloadable XLS files.
The percentile wage estimate is the value of a wage below which a certain percent of workers fall. The median wage is the 50th percentile wage estimate—50 percent of workers earn less than the median and 50 percent of workers earn more than the median. More about percentile wages.
(1) Estimates for detailed occupations do not sum to the totals because the totals include occupations not shown separately. Estimates do not include self-employed workers.
(2) Annual wages have been calculated by multiplying the hourly mean wage by a "year-round, full-time" hours figure of 2,080 hours; for those occupations where there is not an hourly wage published, the annual wage has been directly calculated from the reported survey data.
(3) The relative standard error (RSE) is a measure of the reliability of a survey statistic. The smaller the relative standard error, the more precise the estimate.
(8) Estimate not released.
(9) The location quotient is the ratio of the area concentration of occupational employment to the national average concentration. A location quotient greater than one indicates the occupation has a higher share of employment than average, and a location quotient less than one indicates the occupation is less prevalent in the area than average.
Other OEWS estimates and related information:
May 2021 National Occupational Employment and Wage Estimates
May 2021 State Occupational Employment and Wage Estimates
May 2021 Metropolitan and Nonmetropolitan Area Occupational Employment and Wage Estimates
May 2021 National Industry-Specific Occupational Employment and Wage Estimates
Last Modified Date: March 31, 2022