
An official website of the United States government
An official website of the United States government
The .gov means it's official.
Federal government websites often end in .gov or .mil. Before sharing sensitive information,
make sure you're on a federal government site.
The site is secure.
The
https:// ensures that you are connecting to the official website and that any
information you provide is encrypted and transmitted securely.
Help installation, maintenance, and repair workers in maintenance, parts replacement, and repair of vehicles, industrial machinery, and electrical and electronic equipment. Perform duties such as furnishing tools, materials, and supplies to other workers; cleaning work area, machines, and tools; and holding materials or tools for other workers.
Employment estimate and mean wage estimates for Helpers--Installation, Maintenance, and Repair Workers:
| Employment (1) | Employment RSE (3) |
Mean hourly wage |
Mean annual wage (2) |
Wage RSE (3) |
|---|---|---|---|---|
| 88,480 | 2.1 % | $ 16.87 | $ 35,090 | 0.5 % |
Percentile wage estimates for Helpers--Installation, Maintenance, and Repair Workers:
| Percentile | 10% | 25% | 50% (Median) |
75% | 90% |
|---|---|---|---|---|---|
| Hourly Wage | $ 11.29 | $ 13.94 | $ 15.91 | $ 18.21 | $ 22.68 |
| Annual Wage (2) | $ 23,480 | $ 28,990 | $ 33,100 | $ 37,880 | $ 47,180 |
Industries with the highest published employment and wages for Helpers--Installation, Maintenance, and Repair Workers are provided. For a list of all industries with employment in Helpers--Installation, Maintenance, and Repair Workers, see the Create Customized Tables function.
Industries with the highest levels of employment in Helpers--Installation, Maintenance, and Repair Workers:
| Industry | Employment (1) | Percent of industry employment | Hourly mean wage | Annual mean wage (2) |
|---|---|---|---|---|
| Building Equipment Contractors | 25,860 | 1.15 | $ 16.76 | $ 34,860 |
| Automotive Repair and Maintenance | 12,610 | 1.37 | $ 15.15 | $ 31,520 |
| Local Government, excluding schools and hospitals (OEWS Designation) | 4,840 | 0.09 | $ 20.54 | $ 42,720 |
| Automobile Dealers | 3,720 | 0.30 | $ 15.22 | $ 31,670 |
| Commercial and Industrial Machinery and Equipment (except Automotive and Electronic) Repair and Maintenance | 2,910 | 1.39 | $ 15.80 | $ 32,870 |
Industries with the highest concentration of employment in Helpers--Installation, Maintenance, and Repair Workers:
| Industry | Employment (1) | Percent of industry employment | Hourly mean wage | Annual mean wage (2) |
|---|---|---|---|---|
| Commercial and Industrial Machinery and Equipment (except Automotive and Electronic) Repair and Maintenance | 2,910 | 1.39 | $ 15.80 | $ 32,870 |
| Automotive Repair and Maintenance | 12,610 | 1.37 | $ 15.15 | $ 31,520 |
| Building Equipment Contractors | 25,860 | 1.15 | $ 16.76 | $ 34,860 |
| Personal and Household Goods Repair and Maintenance | 800 | 1.04 | $ 14.12 | $ 29,370 |
| Scenic and Sightseeing Transportation, Land | 40 | 0.59 | $ 15.59 | $ 32,420 |
Top paying industries for Helpers--Installation, Maintenance, and Repair Workers:
| Industry | Employment (1) | Percent of industry employment | Hourly mean wage | Annual mean wage (2) |
|---|---|---|---|---|
| Cable and Other Subscription Programming | (8) | (8) | $ 28.22 | $ 58,690 |
| Water, Sewage and Other Systems | 130 | 0.25 | $ 27.46 | $ 57,130 |
| Electric Power Generation, Transmission and Distribution | 950 | 0.25 | $ 26.54 | $ 55,200 |
| Rail Transportation | 160 | 0.07 | $ 24.47 | $ 50,900 |
| Alumina and Aluminum Production and Processing | 40 | 0.07 | $ 24.04 | $ 50,000 |
States and areas with the highest published employment, location quotients, and wages for Helpers--Installation, Maintenance, and Repair Workers are provided. For a list of all areas with employment in Helpers--Installation, Maintenance, and Repair Workers, see the Create Customized Tables function.
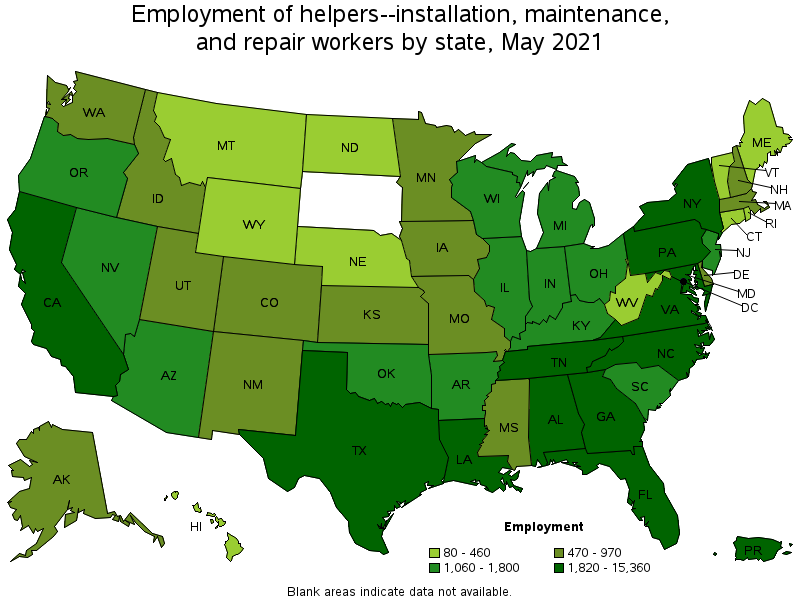
States with the highest employment level in Helpers--Installation, Maintenance, and Repair Workers:
| State | Employment (1) | Employment per thousand jobs | Location quotient (9) | Hourly mean wage | Annual mean wage (2) |
|---|---|---|---|---|---|
| Texas | 15,360 | 1.26 | 2.00 | $ 15.84 | $ 32,950 |
| California | 8,090 | 0.49 | 0.78 | $ 19.32 | $ 40,180 |
| Florida | 6,920 | 0.80 | 1.28 | $ 15.94 | $ 33,160 |
| New York | 4,480 | 0.52 | 0.82 | $ 19.99 | $ 41,580 |
| Georgia | 4,240 | 0.97 | 1.54 | $ 16.45 | $ 34,220 |
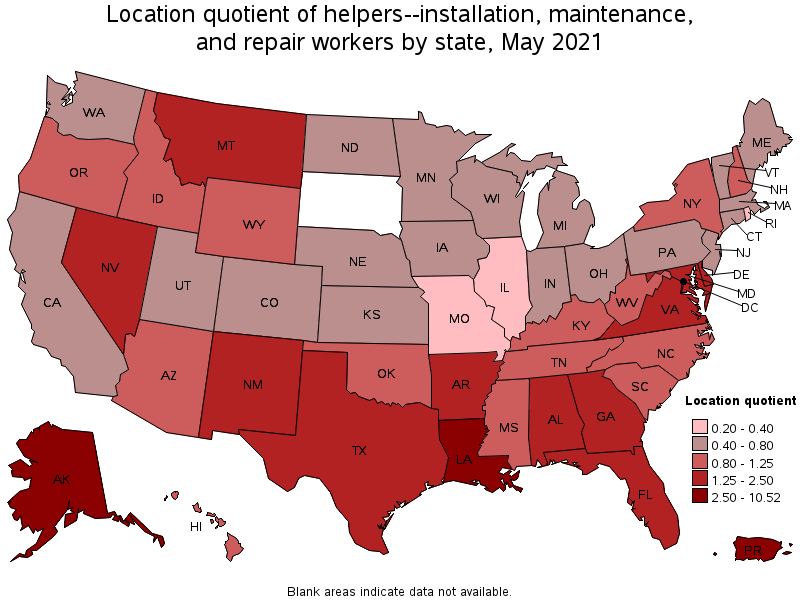
States with the highest concentration of jobs and location quotients in Helpers--Installation, Maintenance, and Repair Workers:
| State | Employment (1) | Employment per thousand jobs | Location quotient (9) | Hourly mean wage | Annual mean wage (2) |
|---|---|---|---|---|---|
| Louisiana | 3,090 | 1.72 | 2.74 | $ 15.70 | $ 32,650 |
| Alaska | 480 | 1.62 | 2.58 | $ 20.07 | $ 41,740 |
| Delaware | 660 | 1.52 | 2.43 | $ 15.21 | $ 31,630 |
| Arkansas | 1,680 | 1.41 | 2.24 | $ 14.76 | $ 30,690 |
| Texas | 15,360 | 1.26 | 2.00 | $ 15.84 | $ 32,950 |
Top paying states for Helpers--Installation, Maintenance, and Repair Workers:
| State | Employment (1) | Employment per thousand jobs | Location quotient (9) | Hourly mean wage | Annual mean wage (2) |
|---|---|---|---|---|---|
| District of Columbia | 200 | 0.30 | 0.48 | $ 26.88 | $ 55,910 |
| Washington | 940 | 0.29 | 0.47 | $ 22.11 | $ 46,000 |
| Massachusetts | 910 | 0.27 | 0.43 | $ 21.80 | $ 45,350 |
| Hawaii | 420 | 0.77 | 1.23 | $ 21.01 | $ 43,690 |
| Connecticut | 460 | 0.29 | 0.47 | $ 20.17 | $ 41,950 |
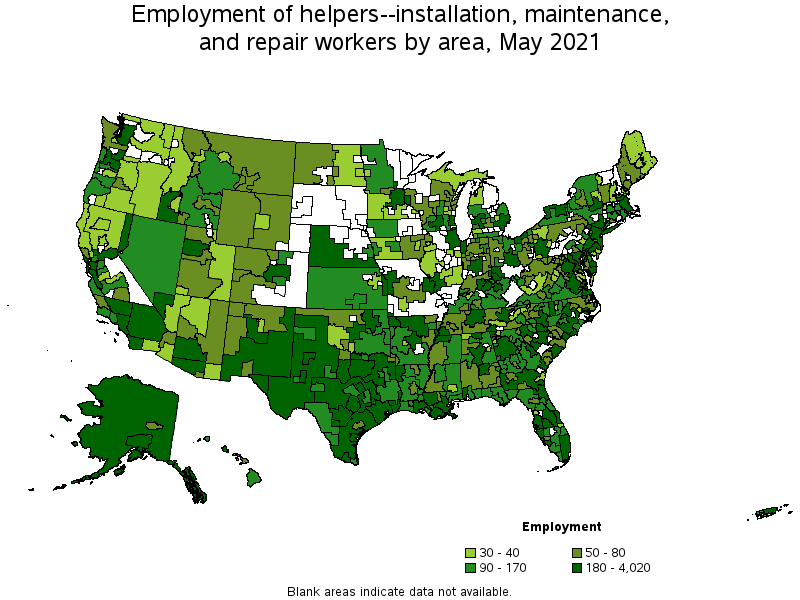
Metropolitan areas with the highest employment level in Helpers--Installation, Maintenance, and Repair Workers:
| Metropolitan area | Employment (1) | Employment per thousand jobs | Location quotient (9) | Hourly mean wage | Annual mean wage (2) |
|---|---|---|---|---|---|
| New York-Newark-Jersey City, NY-NJ-PA | 4,020 | 0.46 | 0.74 | $ 20.51 | $ 42,660 |
| Dallas-Fort Worth-Arlington, TX | 3,840 | 1.07 | 1.70 | $ 16.38 | $ 34,060 |
| Houston-The Woodlands-Sugar Land, TX | 3,720 | 1.29 | 2.05 | $ 16.70 | $ 34,740 |
| Washington-Arlington-Alexandria, DC-VA-MD-WV | 2,690 | 0.92 | 1.46 | $ 19.20 | $ 39,930 |
| Los Angeles-Long Beach-Anaheim, CA | 2,410 | 0.42 | 0.67 | $ 18.26 | $ 37,970 |
| Atlanta-Sandy Springs-Roswell, GA | 2,260 | 0.87 | 1.39 | $ 17.49 | $ 36,380 |
| Miami-Fort Lauderdale-West Palm Beach, FL | 1,620 | 0.66 | 1.05 | $ 16.24 | $ 33,790 |
| San Antonio-New Braunfels, TX | 1,560 | 1.57 | 2.50 | $ 16.25 | $ 33,800 |
| Philadelphia-Camden-Wilmington, PA-NJ-DE-MD | 1,460 | 0.55 | 0.88 | $ 16.51 | $ 34,340 |
| Phoenix-Mesa-Scottsdale, AZ | 1,270 | 0.60 | 0.95 | $ 16.97 | $ 35,310 |
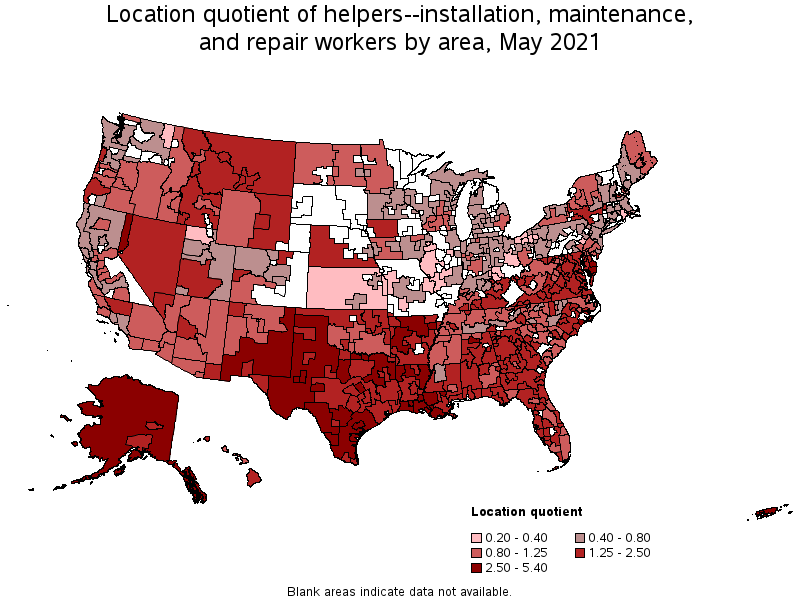
Metropolitan areas with the highest concentration of jobs and location quotients in Helpers--Installation, Maintenance, and Repair Workers:
| Metropolitan area | Employment (1) | Employment per thousand jobs | Location quotient (9) | Hourly mean wage | Annual mean wage (2) |
|---|---|---|---|---|---|
| Houma-Thibodaux, LA | 270 | 3.39 | 5.40 | $ 15.80 | $ 32,870 |
| San Angelo, TX | 120 | 2.70 | 4.29 | $ 14.18 | $ 29,490 |
| Reno, NV | 590 | 2.50 | 3.98 | $ 24.37 | $ 50,700 |
| Midland, TX | 220 | 2.34 | 3.73 | $ 18.31 | $ 38,090 |
| Odessa, TX | 150 | 2.30 | 3.67 | $ 16.20 | $ 33,690 |
| Lafayette, LA | 420 | 2.25 | 3.59 | $ 14.75 | $ 30,670 |
| Jacksonville, NC | 100 | 2.04 | 3.25 | $ 14.27 | $ 29,670 |
| Sherman-Denison, TX | 90 | 1.88 | 2.99 | $ 15.17 | $ 31,550 |
| Victoria, TX | 70 | 1.82 | 2.89 | $ 15.35 | $ 31,920 |
| Jonesboro, AR | 100 | 1.81 | 2.89 | $ 14.31 | $ 29,760 |
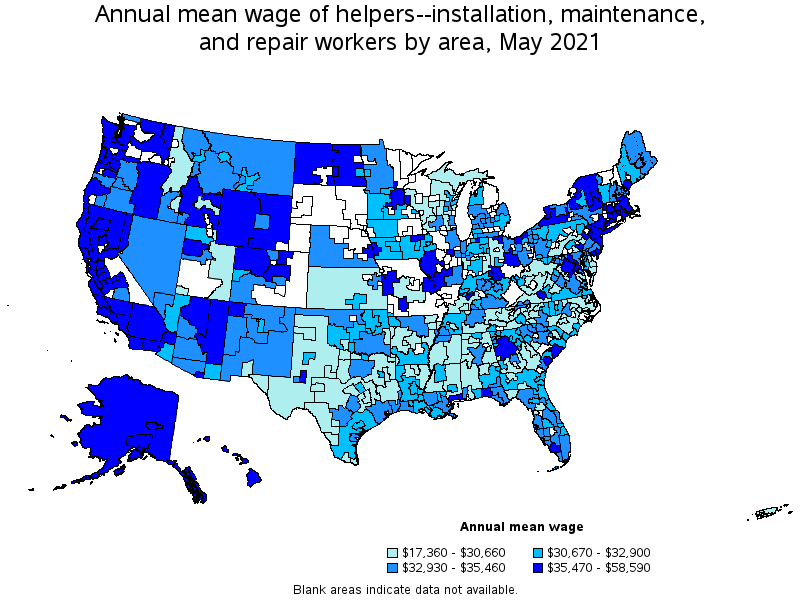
Top paying metropolitan areas for Helpers--Installation, Maintenance, and Repair Workers:
| Metropolitan area | Employment (1) | Employment per thousand jobs | Location quotient (9) | Hourly mean wage | Annual mean wage (2) |
|---|---|---|---|---|---|
| Pittsfield, MA | 40 | 0.95 | 1.52 | $ 28.17 | $ 58,590 |
| Reno, NV | 590 | 2.50 | 3.98 | $ 24.37 | $ 50,700 |
| Springfield, MA-CT | 90 | 0.29 | 0.47 | $ 24.33 | $ 50,600 |
| New Bedford, MA | 40 | 0.57 | 0.90 | $ 23.97 | $ 49,860 |
| Seattle-Tacoma-Bellevue, WA | 570 | 0.30 | 0.48 | $ 23.86 | $ 49,640 |
| San Jose-Sunnyvale-Santa Clara, CA | 440 | 0.41 | 0.65 | $ 23.48 | $ 48,850 |
| San Francisco-Oakland-Hayward, CA | 900 | 0.40 | 0.64 | $ 22.68 | $ 47,180 |
| Kahului-Wailuku-Lahaina, HI | 50 | 0.76 | 1.21 | $ 22.24 | $ 46,250 |
| Vallejo-Fairfield, CA | 90 | 0.71 | 1.13 | $ 21.93 | $ 45,610 |
| Olympia-Tumwater, WA | 40 | 0.32 | 0.51 | $ 21.90 | $ 45,540 |
Nonmetropolitan areas with the highest employment in Helpers--Installation, Maintenance, and Repair Workers:
| Nonmetropolitan area | Employment (1) | Employment per thousand jobs | Location quotient (9) | Hourly mean wage | Annual mean wage (2) |
|---|---|---|---|---|---|
| North Texas Region of Texas nonmetropolitan area | 440 | 1.67 | 2.66 | $ 13.54 | $ 28,170 |
| West Texas Region of Texas nonmetropolitan area | 310 | 1.67 | 2.65 | $ 13.83 | $ 28,760 |
| Hill Country Region of Texas nonmetropolitan area | 260 | 1.38 | 2.20 | $ 14.52 | $ 30,200 |
| Alaska nonmetropolitan area | 240 | 2.48 | 3.94 | $ 21.23 | $ 44,160 |
| Coastal Plains Region of Texas nonmetropolitan area | 230 | 1.66 | 2.65 | $ 15.21 | $ 31,630 |
Nonmetropolitan areas with the highest concentration of jobs and location quotients in Helpers--Installation, Maintenance, and Repair Workers:
| Nonmetropolitan area | Employment (1) | Employment per thousand jobs | Location quotient (9) | Hourly mean wage | Annual mean wage (2) |
|---|---|---|---|---|---|
| Alaska nonmetropolitan area | 240 | 2.48 | 3.94 | $ 21.23 | $ 44,160 |
| North Arkansas nonmetropolitan area | 210 | 1.88 | 2.99 | $ 16.15 | $ 33,600 |
| Southwest Louisiana nonmetropolitan area | 110 | 1.73 | 2.75 | $ 15.03 | $ 31,270 |
| Northeast Louisiana nonmetropolitan area | 110 | 1.71 | 2.73 | $ 13.67 | $ 28,440 |
| North Texas Region of Texas nonmetropolitan area | 440 | 1.67 | 2.66 | $ 13.54 | $ 28,170 |
Top paying nonmetropolitan areas for Helpers--Installation, Maintenance, and Repair Workers:
| Nonmetropolitan area | Employment (1) | Employment per thousand jobs | Location quotient (9) | Hourly mean wage | Annual mean wage (2) |
|---|---|---|---|---|---|
| Eastern Washington nonmetropolitan area | 40 | 0.47 | 0.74 | $ 22.34 | $ 46,470 |
| East North Dakota nonmetropolitan area | 30 | 0.50 | 0.80 | $ 22.05 | $ 45,870 |
| Alaska nonmetropolitan area | 240 | 2.48 | 3.94 | $ 21.23 | $ 44,160 |
| Western Washington nonmetropolitan area | 50 | 0.40 | 0.64 | $ 20.68 | $ 43,020 |
| West North Dakota nonmetropolitan area | 60 | 0.59 | 0.94 | $ 20.00 | $ 41,610 |
These estimates are calculated with data collected from employers in all industry sectors, all metropolitan and nonmetropolitan areas, and all states and the District of Columbia. The top employment and wage figures are provided above. The complete list is available in the downloadable XLS files.
The percentile wage estimate is the value of a wage below which a certain percent of workers fall. The median wage is the 50th percentile wage estimate—50 percent of workers earn less than the median and 50 percent of workers earn more than the median. More about percentile wages.
(1) Estimates for detailed occupations do not sum to the totals because the totals include occupations not shown separately. Estimates do not include self-employed workers.
(2) Annual wages have been calculated by multiplying the hourly mean wage by a "year-round, full-time" hours figure of 2,080 hours; for those occupations where there is not an hourly wage published, the annual wage has been directly calculated from the reported survey data.
(3) The relative standard error (RSE) is a measure of the reliability of a survey statistic. The smaller the relative standard error, the more precise the estimate.
(8) Estimate not released.
(9) The location quotient is the ratio of the area concentration of occupational employment to the national average concentration. A location quotient greater than one indicates the occupation has a higher share of employment than average, and a location quotient less than one indicates the occupation is less prevalent in the area than average.
Other OEWS estimates and related information:
May 2021 National Occupational Employment and Wage Estimates
May 2021 State Occupational Employment and Wage Estimates
May 2021 Metropolitan and Nonmetropolitan Area Occupational Employment and Wage Estimates
May 2021 National Industry-Specific Occupational Employment and Wage Estimates
Last Modified Date: March 31, 2022