
An official website of the United States government
An official website of the United States government
The .gov means it's official.
Federal government websites often end in .gov or .mil. Before sharing sensitive information,
make sure you're on a federal government site.
The site is secure.
The
https:// ensures that you are connecting to the official website and that any
information you provide is encrypted and transmitted securely.
Set up and operate machines, such as lathes, milling and engraving machines, and jig borers to make working models of metal or plastic objects. Includes template makers.
Employment estimate and mean wage estimates for Model Makers, Metal and Plastic:
| Employment (1) | Employment RSE (3) |
Mean hourly wage |
Mean annual wage (2) |
Wage RSE (3) |
|---|---|---|---|---|
| 3,690 | 6.8 % | $ 28.40 | $ 59,080 | 2.0 % |
Percentile wage estimates for Model Makers, Metal and Plastic:
| Percentile | 10% | 25% | 50% (Median) |
75% | 90% |
|---|---|---|---|---|---|
| Hourly Wage | $ 17.74 | $ 20.91 | $ 26.75 | $ 36.98 | $ 38.62 |
| Annual Wage (2) | $ 36,900 | $ 43,480 | $ 55,630 | $ 76,920 | $ 80,330 |
Industries with the highest published employment and wages for Model Makers, Metal and Plastic are provided. For a list of all industries with employment in Model Makers, Metal and Plastic, see the Create Customized Tables function.
Industries with the highest levels of employment in Model Makers, Metal and Plastic:
| Industry | Employment (1) | Percent of industry employment | Hourly mean wage | Annual mean wage (2) |
|---|---|---|---|---|
| Architectural, Engineering, and Related Services | 620 | 0.04 | $ 35.40 | $ 73,630 |
| Plastics Product Manufacturing | 510 | 0.09 | $ 22.01 | $ 45,780 |
| Specialized Design Services | 480 | 0.35 | $ 26.76 | $ 55,660 |
| Motor Vehicle Parts Manufacturing | 220 | 0.04 | $ 25.38 | $ 52,780 |
| Other Miscellaneous Manufacturing | 220 | 0.08 | $ 29.45 | $ 61,250 |
Industries with the highest concentration of employment in Model Makers, Metal and Plastic:
| Industry | Employment (1) | Percent of industry employment | Hourly mean wage | Annual mean wage (2) |
|---|---|---|---|---|
| Specialized Design Services | 480 | 0.35 | $ 26.76 | $ 55,660 |
| Nonferrous Metal (except Aluminum) Production and Processing | 80 | 0.14 | $ 21.86 | $ 45,460 |
| Metalworking Machinery Manufacturing | 150 | 0.10 | $ 22.30 | $ 46,380 |
| Plastics Product Manufacturing | 510 | 0.09 | $ 22.01 | $ 45,780 |
| Other Miscellaneous Manufacturing | 220 | 0.08 | $ 29.45 | $ 61,250 |
Top paying industries for Model Makers, Metal and Plastic:
| Industry | Employment (1) | Percent of industry employment | Hourly mean wage | Annual mean wage (2) |
|---|---|---|---|---|
| Scientific Research and Development Services | 80 | 0.01 | $ 40.85 | $ 84,970 |
| Navigational, Measuring, Electromedical, and Control Instruments Manufacturing | 70 | 0.02 | $ 39.21 | $ 81,570 |
| Management of Companies and Enterprises | 70 | (7) | $ 39.10 | $ 81,330 |
| Medical Equipment and Supplies Manufacturing | 90 | 0.03 | $ 36.75 | $ 76,430 |
| Architectural, Engineering, and Related Services | 620 | 0.04 | $ 35.40 | $ 73,630 |
States and areas with the highest published employment, location quotients, and wages for Model Makers, Metal and Plastic are provided. For a list of all areas with employment in Model Makers, Metal and Plastic, see the Create Customized Tables function.
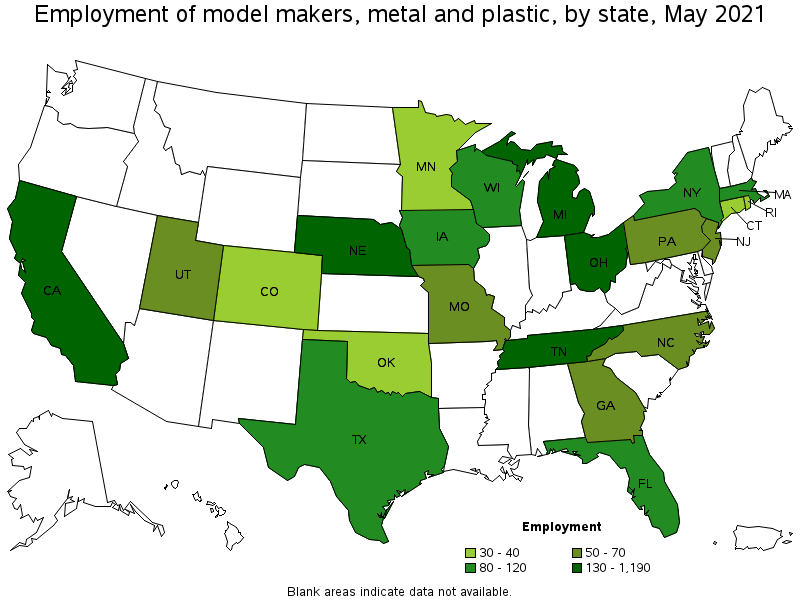
States with the highest employment level in Model Makers, Metal and Plastic:
| State | Employment (1) | Employment per thousand jobs | Location quotient (9) | Hourly mean wage | Annual mean wage (2) |
|---|---|---|---|---|---|
| Michigan | 1,190 | 0.29 | 11.22 | $ 32.22 | $ 67,010 |
| California | 270 | 0.02 | 0.63 | $ 32.67 | $ 67,960 |
| Ohio | 270 | 0.05 | 1.97 | $ 27.94 | $ 58,120 |
| Nebraska | 250 | 0.27 | 10.13 | $ 18.55 | $ 38,580 |
| Tennessee | 130 | 0.04 | 1.67 | $ 19.35 | $ 40,250 |
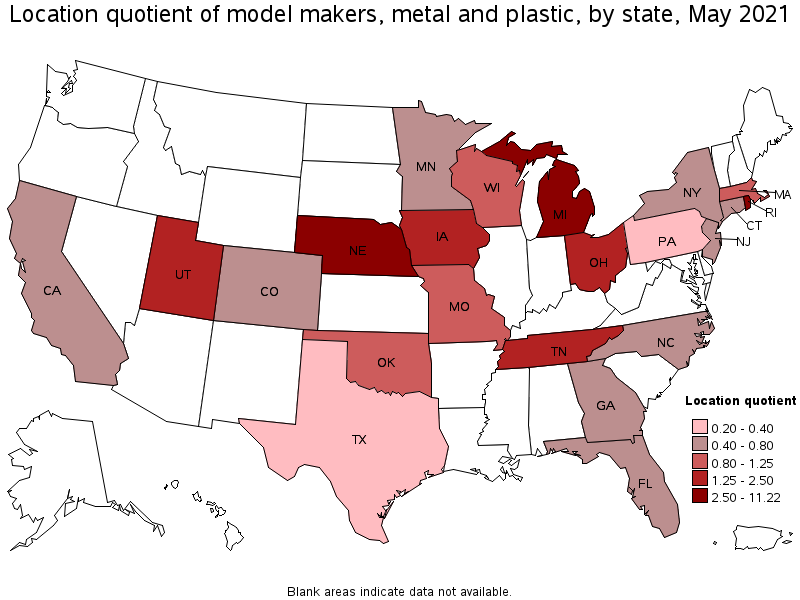
States with the highest concentration of jobs and location quotients in Model Makers, Metal and Plastic:
| State | Employment (1) | Employment per thousand jobs | Location quotient (9) | Hourly mean wage | Annual mean wage (2) |
|---|---|---|---|---|---|
| Michigan | 1,190 | 0.29 | 11.22 | $ 32.22 | $ 67,010 |
| Nebraska | 250 | 0.27 | 10.13 | $ 18.55 | $ 38,580 |
| Rhode Island | 30 | 0.07 | 2.60 | $ 28.02 | $ 58,280 |
| Iowa | 80 | 0.06 | 2.16 | $ 27.05 | $ 56,260 |
| Ohio | 270 | 0.05 | 1.97 | $ 27.94 | $ 58,120 |
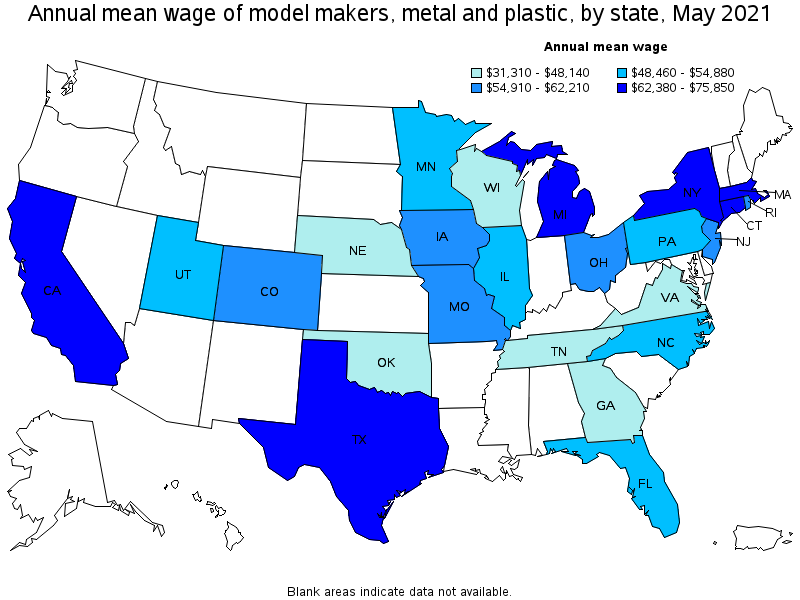
Top paying states for Model Makers, Metal and Plastic:
| State | Employment (1) | Employment per thousand jobs | Location quotient (9) | Hourly mean wage | Annual mean wage (2) |
|---|---|---|---|---|---|
| Connecticut | 30 | 0.02 | 0.76 | $ 36.46 | $ 75,850 |
| Massachusetts | 110 | 0.03 | 1.22 | $ 36.13 | $ 75,150 |
| California | 270 | 0.02 | 0.63 | $ 32.67 | $ 67,960 |
| Michigan | 1,190 | 0.29 | 11.22 | $ 32.22 | $ 67,010 |
| New York | 120 | 0.01 | 0.52 | $ 32.20 | $ 66,970 |
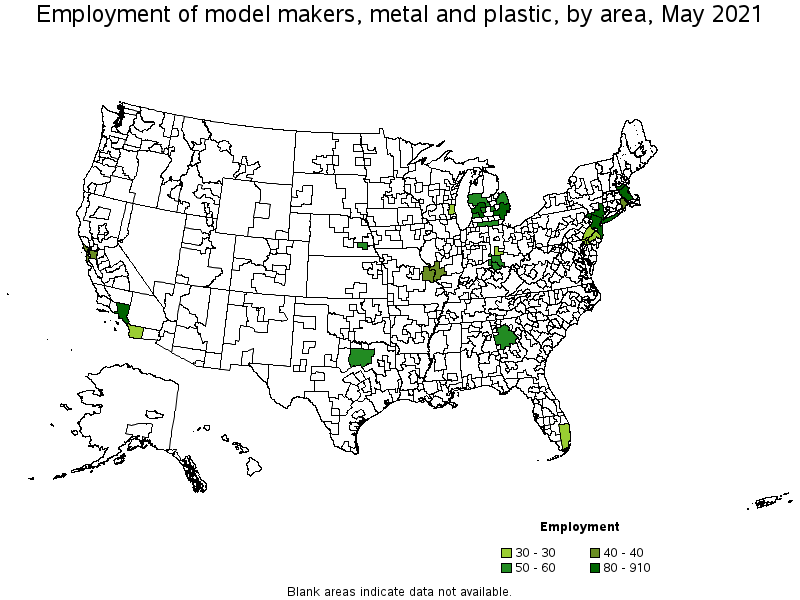
Metropolitan areas with the highest employment level in Model Makers, Metal and Plastic:
| Metropolitan area | Employment (1) | Employment per thousand jobs | Location quotient (9) | Hourly mean wage | Annual mean wage (2) |
|---|---|---|---|---|---|
| Detroit-Warren-Dearborn, MI | 910 | 0.50 | 19.20 | $ 33.17 | $ 69,000 |
| Los Angeles-Long Beach-Anaheim, CA | 120 | 0.02 | 0.79 | $ 32.49 | $ 67,580 |
| Grand Rapids-Wyoming, MI | 120 | 0.23 | 8.72 | $ 28.55 | $ 59,390 |
| New York-Newark-Jersey City, NY-NJ-PA | 100 | 0.01 | 0.46 | $ 31.20 | $ 64,900 |
| Boston-Cambridge-Nashua, MA-NH | 80 | 0.03 | 1.18 | $ 36.64 | $ 76,210 |
| Cincinnati, OH-KY-IN | 60 | 0.06 | 2.28 | $ 32.30 | $ 67,180 |
| Dallas-Fort Worth-Arlington, TX | 50 | 0.01 | 0.56 | $ 33.63 | $ 69,950 |
| Lincoln, NE | 50 | 0.28 | 10.82 | $ 17.08 | $ 35,530 |
| Atlanta-Sandy Springs-Roswell, GA | 50 | 0.02 | 0.69 | $ 24.17 | $ 50,280 |
| Providence-Warwick, RI-MA | 40 | 0.07 | 2.85 | $ 29.96 | $ 62,310 |
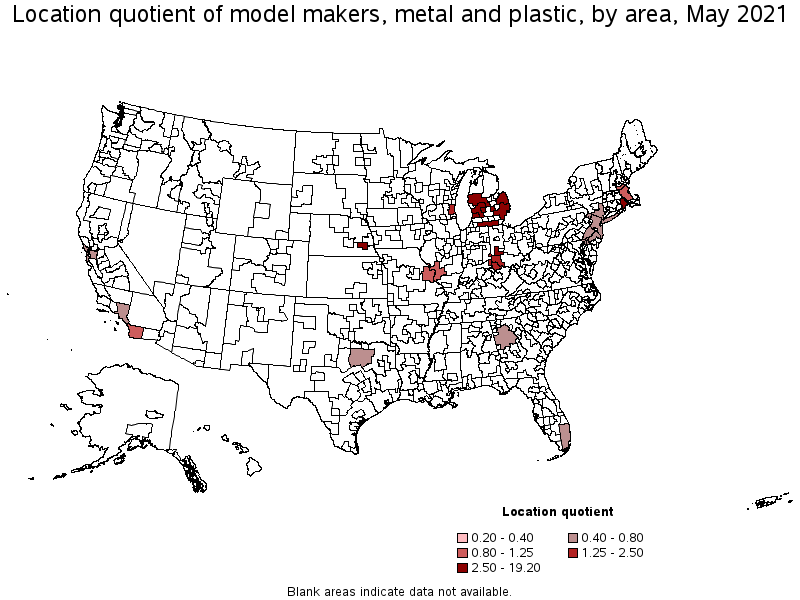
Metropolitan areas with the highest concentration of jobs and location quotients in Model Makers, Metal and Plastic:
| Metropolitan area | Employment (1) | Employment per thousand jobs | Location quotient (9) | Hourly mean wage | Annual mean wage (2) |
|---|---|---|---|---|---|
| Detroit-Warren-Dearborn, MI | 910 | 0.50 | 19.20 | $ 33.17 | $ 69,000 |
| Lincoln, NE | 50 | 0.28 | 10.82 | $ 17.08 | $ 35,530 |
| Grand Rapids-Wyoming, MI | 120 | 0.23 | 8.72 | $ 28.55 | $ 59,390 |
| Dayton, OH | 30 | 0.10 | 3.70 | $ 20.54 | $ 42,730 |
| Providence-Warwick, RI-MA | 40 | 0.07 | 2.85 | $ 29.96 | $ 62,310 |
| Cincinnati, OH-KY-IN | 60 | 0.06 | 2.28 | $ 32.30 | $ 67,180 |
| Milwaukee-Waukesha-West Allis, WI | 30 | 0.04 | 1.63 | $ 21.03 | $ 43,750 |
| Boston-Cambridge-Nashua, MA-NH | 80 | 0.03 | 1.18 | $ 36.64 | $ 76,210 |
| St. Louis, MO-IL | 40 | 0.03 | 1.14 | $ 30.75 | $ 63,970 |
| San Diego-Carlsbad, CA | 30 | 0.02 | 0.82 | $ 31.70 | $ 65,940 |
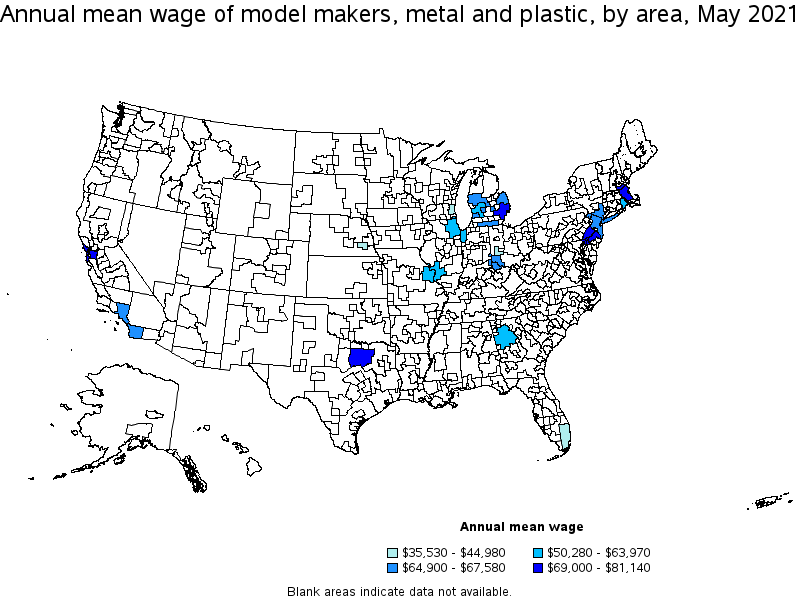
Top paying metropolitan areas for Model Makers, Metal and Plastic:
| Metropolitan area | Employment (1) | Employment per thousand jobs | Location quotient (9) | Hourly mean wage | Annual mean wage (2) |
|---|---|---|---|---|---|
| San Francisco-Oakland-Hayward, CA | 40 | 0.02 | 0.65 | $ 39.01 | $ 81,140 |
| Boston-Cambridge-Nashua, MA-NH | 80 | 0.03 | 1.18 | $ 36.64 | $ 76,210 |
| Philadelphia-Camden-Wilmington, PA-NJ-DE-MD | 30 | 0.01 | 0.49 | $ 35.68 | $ 74,210 |
| Dallas-Fort Worth-Arlington, TX | 50 | 0.01 | 0.56 | $ 33.63 | $ 69,950 |
| Detroit-Warren-Dearborn, MI | 910 | 0.50 | 19.20 | $ 33.17 | $ 69,000 |
| Los Angeles-Long Beach-Anaheim, CA | 120 | 0.02 | 0.79 | $ 32.49 | $ 67,580 |
| Cincinnati, OH-KY-IN | 60 | 0.06 | 2.28 | $ 32.30 | $ 67,180 |
| San Diego-Carlsbad, CA | 30 | 0.02 | 0.82 | $ 31.70 | $ 65,940 |
| New York-Newark-Jersey City, NY-NJ-PA | 100 | 0.01 | 0.46 | $ 31.20 | $ 64,900 |
| St. Louis, MO-IL | 40 | 0.03 | 1.14 | $ 30.75 | $ 63,970 |
Nonmetropolitan areas with the highest employment in Model Makers, Metal and Plastic:
| Nonmetropolitan area | Employment (1) | Employment per thousand jobs | Location quotient (9) | Hourly mean wage | Annual mean wage (2) |
|---|---|---|---|---|---|
| Balance of Lower Peninsula of Michigan nonmetropolitan area | 60 | 0.24 | 9.19 | $ 31.90 | $ 66,360 |
Nonmetropolitan areas with the highest concentration of jobs and location quotients in Model Makers, Metal and Plastic:
| Nonmetropolitan area | Employment (1) | Employment per thousand jobs | Location quotient (9) | Hourly mean wage | Annual mean wage (2) |
|---|---|---|---|---|---|
| Balance of Lower Peninsula of Michigan nonmetropolitan area | 60 | 0.24 | 9.19 | $ 31.90 | $ 66,360 |
Top paying nonmetropolitan areas for Model Makers, Metal and Plastic:
| Nonmetropolitan area | Employment (1) | Employment per thousand jobs | Location quotient (9) | Hourly mean wage | Annual mean wage (2) |
|---|---|---|---|---|---|
| Balance of Lower Peninsula of Michigan nonmetropolitan area | 60 | 0.24 | 9.19 | $ 31.90 | $ 66,360 |
These estimates are calculated with data collected from employers in all industry sectors, all metropolitan and nonmetropolitan areas, and all states and the District of Columbia. The top employment and wage figures are provided above. The complete list is available in the downloadable XLS files.
The percentile wage estimate is the value of a wage below which a certain percent of workers fall. The median wage is the 50th percentile wage estimate—50 percent of workers earn less than the median and 50 percent of workers earn more than the median. More about percentile wages.
(1) Estimates for detailed occupations do not sum to the totals because the totals include occupations not shown separately. Estimates do not include self-employed workers.
(2) Annual wages have been calculated by multiplying the hourly mean wage by a "year-round, full-time" hours figure of 2,080 hours; for those occupations where there is not an hourly wage published, the annual wage has been directly calculated from the reported survey data.
(3) The relative standard error (RSE) is a measure of the reliability of a survey statistic. The smaller the relative standard error, the more precise the estimate.
(7) The value is less than .005 percent of industry employment.
(9) The location quotient is the ratio of the area concentration of occupational employment to the national average concentration. A location quotient greater than one indicates the occupation has a higher share of employment than average, and a location quotient less than one indicates the occupation is less prevalent in the area than average.
Other OEWS estimates and related information:
May 2021 National Occupational Employment and Wage Estimates
May 2021 State Occupational Employment and Wage Estimates
May 2021 Metropolitan and Nonmetropolitan Area Occupational Employment and Wage Estimates
May 2021 National Industry-Specific Occupational Employment and Wage Estimates
Last Modified Date: March 31, 2022