
An official website of the United States government
An official website of the United States government
The .gov means it's official.
Federal government websites often end in .gov or .mil. Before sharing sensitive information,
make sure you're on a federal government site.
The site is secure.
The
https:// ensures that you are connecting to the official website and that any
information you provide is encrypted and transmitted securely.
Set up, operate, or tend plating machines to coat metal or plastic products with chromium, zinc, copper, cadmium, nickel, or other metal to protect or decorate surfaces. Typically, the product being coated is immersed in molten metal or an electrolytic solution. Excludes �Coating, Painting, and Spraying Machine Setters, Operators, and Tenders� (51-9124).
Employment estimate and mean wage estimates for Plating Machine Setters, Operators, and Tenders, Metal and Plastic:
| Employment (1) | Employment RSE (3) |
Mean hourly wage |
Mean annual wage (2) |
Wage RSE (3) |
|---|---|---|---|---|
| 32,310 | 2.2 % | $ 18.55 | $ 38,580 | 0.6 % |
Percentile wage estimates for Plating Machine Setters, Operators, and Tenders, Metal and Plastic:
| Percentile | 10% | 25% | 50% (Median) |
75% | 90% |
|---|---|---|---|---|---|
| Hourly Wage | $ 13.86 | $ 14.48 | $ 17.89 | $ 22.00 | $ 23.77 |
| Annual Wage (2) | $ 28,820 | $ 30,120 | $ 37,200 | $ 45,760 | $ 49,440 |
Industries with the highest published employment and wages for Plating Machine Setters, Operators, and Tenders, Metal and Plastic are provided. For a list of all industries with employment in Plating Machine Setters, Operators, and Tenders, Metal and Plastic, see the Create Customized Tables function.
Industries with the highest levels of employment in Plating Machine Setters, Operators, and Tenders, Metal and Plastic:
| Industry | Employment (1) | Percent of industry employment | Hourly mean wage | Annual mean wage (2) |
|---|---|---|---|---|
| Coating, Engraving, Heat Treating, and Allied Activities | 19,730 | 15.95 | $ 17.80 | $ 37,020 |
| Semiconductor and Other Electronic Component Manufacturing | 1,870 | 0.52 | $ 18.74 | $ 38,970 |
| Fabricated Metal Product Manufacturing (3321, 3322, 3325, 3326, and 3329 only) | 1,350 | 0.30 | $ 17.95 | $ 37,330 |
| Motor Vehicle Parts Manufacturing | 1,040 | 0.19 | $ 17.42 | $ 36,240 |
| Aerospace Product and Parts Manufacturing | 810 | 0.17 | $ 30.23 | $ 62,870 |
Industries with the highest concentration of employment in Plating Machine Setters, Operators, and Tenders, Metal and Plastic:
| Industry | Employment (1) | Percent of industry employment | Hourly mean wage | Annual mean wage (2) |
|---|---|---|---|---|
| Coating, Engraving, Heat Treating, and Allied Activities | 19,730 | 15.95 | $ 17.80 | $ 37,020 |
| Steel Product Manufacturing from Purchased Steel | 400 | 0.75 | $ 18.42 | $ 38,300 |
| Alumina and Aluminum Production and Processing | 290 | 0.52 | $ 19.02 | $ 39,550 |
| Semiconductor and Other Electronic Component Manufacturing | 1,870 | 0.52 | $ 18.74 | $ 38,970 |
| Nonferrous Metal (except Aluminum) Production and Processing | 200 | 0.36 | $ 20.56 | $ 42,770 |
Top paying industries for Plating Machine Setters, Operators, and Tenders, Metal and Plastic:
| Industry | Employment (1) | Percent of industry employment | Hourly mean wage | Annual mean wage (2) |
|---|---|---|---|---|
| Aerospace Product and Parts Manufacturing | 810 | 0.17 | $ 30.23 | $ 62,870 |
| Federal Executive Branch (OEWS Designation) | 380 | 0.02 | $ 27.75 | $ 57,720 |
| Navigational, Measuring, Electromedical, and Control Instruments Manufacturing | 150 | 0.04 | $ 23.52 | $ 48,920 |
| Commercial and Service Industry Machinery Manufacturing | 60 | 0.07 | $ 23.08 | $ 48,010 |
| Engine, Turbine, and Power Transmission Equipment Manufacturing | 230 | 0.26 | $ 22.90 | $ 47,640 |
States and areas with the highest published employment, location quotients, and wages for Plating Machine Setters, Operators, and Tenders, Metal and Plastic are provided. For a list of all areas with employment in Plating Machine Setters, Operators, and Tenders, Metal and Plastic, see the Create Customized Tables function.
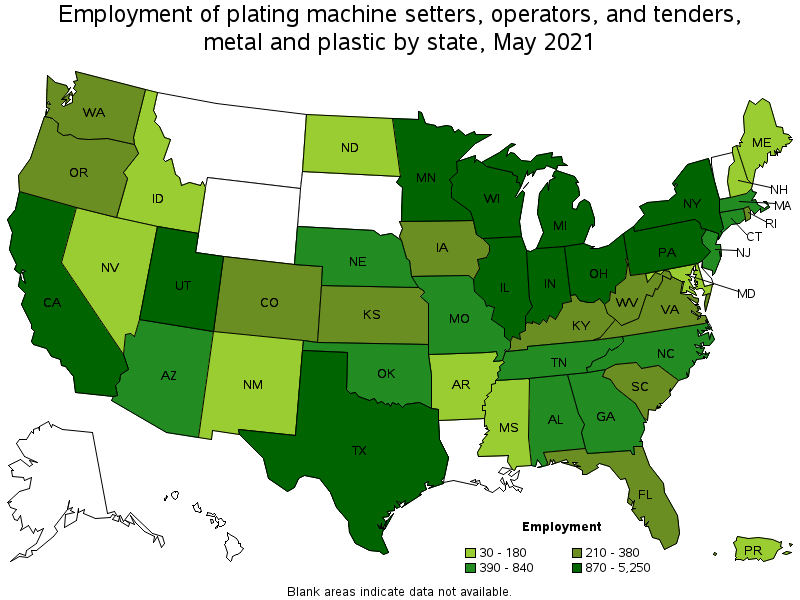
States with the highest employment level in Plating Machine Setters, Operators, and Tenders, Metal and Plastic:
| State | Employment (1) | Employment per thousand jobs | Location quotient (9) | Hourly mean wage | Annual mean wage (2) |
|---|---|---|---|---|---|
| California | 5,250 | 0.32 | 1.39 | $ 20.39 | $ 42,410 |
| Michigan | 2,140 | 0.53 | 2.30 | $ 16.66 | $ 34,650 |
| Ohio | 2,040 | 0.39 | 1.71 | $ 17.86 | $ 37,140 |
| Illinois | 1,790 | 0.32 | 1.39 | $ 18.03 | $ 37,490 |
| Texas | 1,760 | 0.14 | 0.63 | $ 17.73 | $ 36,870 |
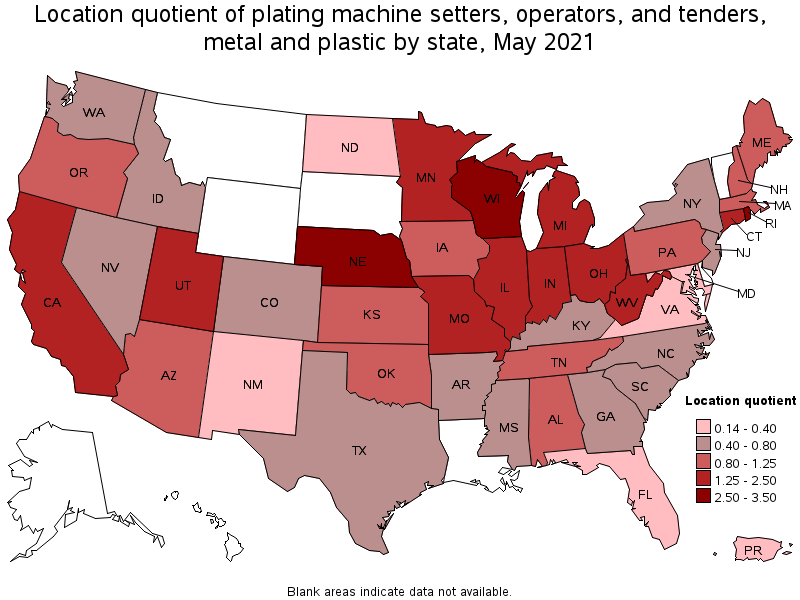
States with the highest concentration of jobs and location quotients in Plating Machine Setters, Operators, and Tenders, Metal and Plastic:
| State | Employment (1) | Employment per thousand jobs | Location quotient (9) | Hourly mean wage | Annual mean wage (2) |
|---|---|---|---|---|---|
| Rhode Island | 350 | 0.76 | 3.32 | $ 14.72 | $ 30,610 |
| Nebraska | 630 | 0.66 | 2.87 | $ 18.09 | $ 37,630 |
| Wisconsin | 1,730 | 0.63 | 2.75 | $ 17.58 | $ 36,560 |
| Utah | 870 | 0.56 | 2.43 | $ 19.27 | $ 40,090 |
| Indiana | 1,590 | 0.53 | 2.33 | $ 16.81 | $ 34,960 |
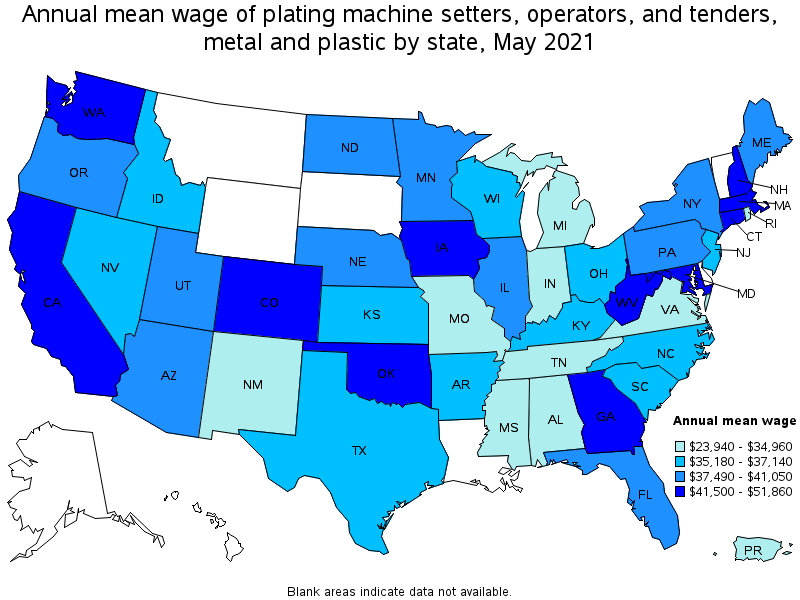
Top paying states for Plating Machine Setters, Operators, and Tenders, Metal and Plastic:
| State | Employment (1) | Employment per thousand jobs | Location quotient (9) | Hourly mean wage | Annual mean wage (2) |
|---|---|---|---|---|---|
| West Virginia | 210 | 0.32 | 1.41 | $ 24.93 | $ 51,860 |
| Georgia | 630 | 0.15 | 0.63 | $ 23.93 | $ 49,770 |
| Colorado | 240 | 0.09 | 0.40 | $ 22.05 | $ 45,870 |
| Washington | 380 | 0.12 | 0.52 | $ 21.80 | $ 45,340 |
| Oklahoma | 390 | 0.25 | 1.09 | $ 20.73 | $ 43,120 |
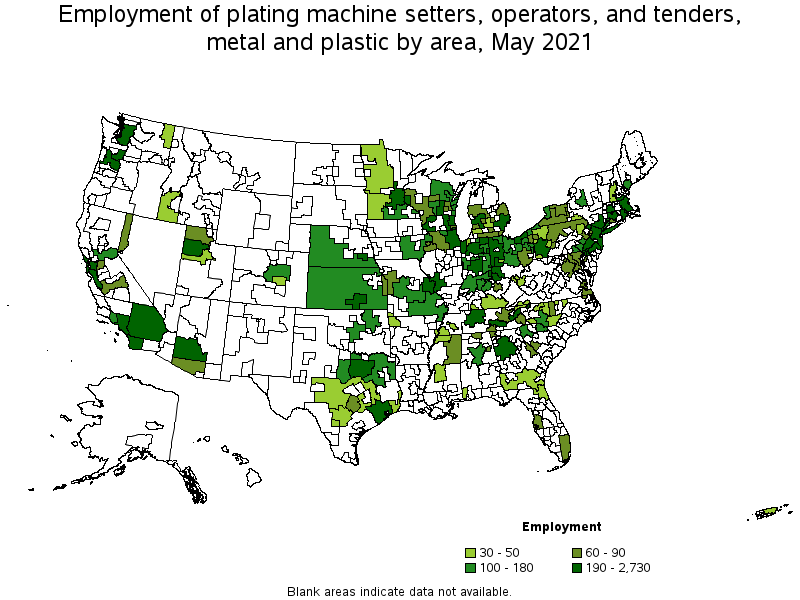
Metropolitan areas with the highest employment level in Plating Machine Setters, Operators, and Tenders, Metal and Plastic:
| Metropolitan area | Employment (1) | Employment per thousand jobs | Location quotient (9) | Hourly mean wage | Annual mean wage (2) |
|---|---|---|---|---|---|
| Los Angeles-Long Beach-Anaheim, CA | 2,730 | 0.48 | 2.08 | $ 20.10 | $ 41,810 |
| Chicago-Naperville-Elgin, IL-IN-WI | 1,530 | 0.36 | 1.58 | $ 18.36 | $ 38,200 |
| Detroit-Warren-Dearborn, MI | 1,080 | 0.60 | 2.62 | $ 16.65 | $ 34,640 |
| New York-Newark-Jersey City, NY-NJ-PA | 870 | 0.10 | 0.44 | $ 18.83 | $ 39,160 |
| Minneapolis-St. Paul-Bloomington, MN-WI | 760 | 0.42 | 1.82 | $ 19.55 | $ 40,670 |
| Salt Lake City, UT | 700 | 0.95 | 4.13 | $ 18.74 | $ 38,970 |
| San Jose-Sunnyvale-Santa Clara, CA | 700 | 0.65 | 2.85 | $ 22.14 | $ 46,050 |
| Phoenix-Mesa-Scottsdale, AZ | 560 | 0.26 | 1.15 | $ 18.65 | $ 38,790 |
| Houston-The Woodlands-Sugar Land, TX | 550 | 0.19 | 0.82 | $ 17.60 | $ 36,610 |
| Cleveland-Elyria, OH | 530 | 0.55 | 2.38 | $ 17.12 | $ 35,600 |
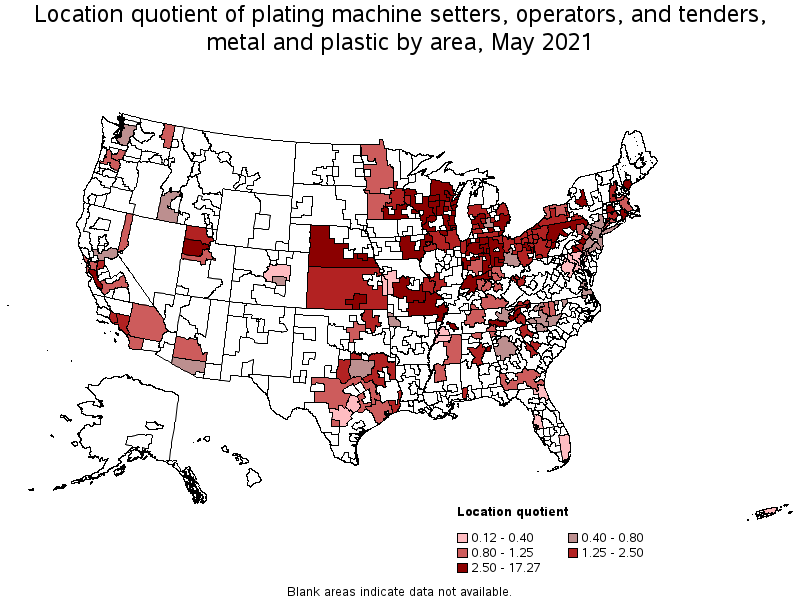
Metropolitan areas with the highest concentration of jobs and location quotients in Plating Machine Setters, Operators, and Tenders, Metal and Plastic:
| Metropolitan area | Employment (1) | Employment per thousand jobs | Location quotient (9) | Hourly mean wage | Annual mean wage (2) |
|---|---|---|---|---|---|
| Weirton-Steubenville, WV-OH | 140 | 3.96 | 17.27 | $ 27.65 | $ 57,520 |
| Monroe, MI | 70 | 2.00 | 8.71 | $ 19.32 | $ 40,190 |
| Lincoln, NE | 310 | 1.80 | 7.86 | $ 18.49 | $ 38,450 |
| Sheboygan, WI | 100 | 1.75 | 7.65 | $ 18.24 | $ 37,940 |
| Waterbury, CT | 100 | 1.52 | 6.61 | $ 16.44 | $ 34,200 |
| Anniston-Oxford-Jacksonville, AL | 60 | 1.49 | 6.49 | $ 19.35 | $ 40,250 |
| Johnstown, PA | 60 | 1.32 | 5.74 | (8) | (8) |
| Rockford, IL | 160 | 1.22 | 5.33 | $ 16.82 | $ 34,990 |
| Jackson, MI | 60 | 1.18 | 5.13 | $ 16.38 | $ 34,070 |
| Wausau, WI | 80 | 1.12 | 4.90 | $ 16.77 | $ 34,890 |
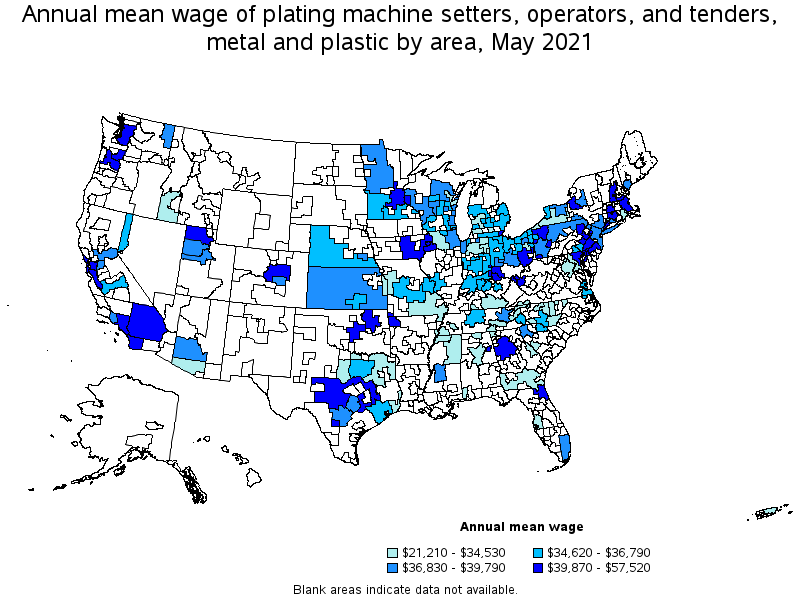
Top paying metropolitan areas for Plating Machine Setters, Operators, and Tenders, Metal and Plastic:
| Metropolitan area | Employment (1) | Employment per thousand jobs | Location quotient (9) | Hourly mean wage | Annual mean wage (2) |
|---|---|---|---|---|---|
| Weirton-Steubenville, WV-OH | 140 | 3.96 | 17.27 | $ 27.65 | $ 57,520 |
| Atlanta-Sandy Springs-Roswell, GA | 280 | 0.11 | 0.47 | $ 26.99 | $ 56,150 |
| Reading, PA | 130 | 0.79 | 3.46 | $ 25.80 | $ 53,660 |
| Bridgeport-Stamford-Norwalk, CT | 110 | 0.28 | 1.23 | $ 25.33 | $ 52,690 |
| Ogden-Clearfield, UT | 80 | 0.31 | 1.33 | $ 24.33 | $ 50,600 |
| Oklahoma City, OK | 140 | 0.24 | 1.03 | $ 23.53 | $ 48,950 |
| Denver-Aurora-Lakewood, CO | 110 | 0.08 | 0.33 | $ 23.00 | $ 47,850 |
| San Francisco-Oakland-Hayward, CA | 490 | 0.22 | 0.96 | $ 22.51 | $ 46,820 |
| Jacksonville, FL | 40 | 0.06 | 0.27 | $ 22.41 | $ 46,620 |
| San Jose-Sunnyvale-Santa Clara, CA | 700 | 0.65 | 2.85 | $ 22.14 | $ 46,050 |
Nonmetropolitan areas with the highest employment in Plating Machine Setters, Operators, and Tenders, Metal and Plastic:
| Nonmetropolitan area | Employment (1) | Employment per thousand jobs | Location quotient (9) | Hourly mean wage | Annual mean wage (2) |
|---|---|---|---|---|---|
| Northern Indiana nonmetropolitan area | 300 | 1.47 | 6.40 | $ 16.41 | $ 34,130 |
| West Northwestern Ohio nonmetropolitan area | 220 | 0.92 | 4.02 | $ 17.34 | $ 36,060 |
| East Tennessee nonmetropolitan area | 210 | 1.59 | 6.95 | $ 14.74 | $ 30,660 |
| South Central Wisconsin nonmetropolitan area | 200 | 1.00 | 4.37 | $ 17.69 | $ 36,790 |
| Central Missouri nonmetropolitan area | 180 | 1.17 | 5.09 | $ 16.92 | $ 35,190 |
Nonmetropolitan areas with the highest concentration of jobs and location quotients in Plating Machine Setters, Operators, and Tenders, Metal and Plastic:
| Nonmetropolitan area | Employment (1) | Employment per thousand jobs | Location quotient (9) | Hourly mean wage | Annual mean wage (2) |
|---|---|---|---|---|---|
| East Tennessee nonmetropolitan area | 210 | 1.59 | 6.95 | $ 14.74 | $ 30,660 |
| Northern Indiana nonmetropolitan area | 300 | 1.47 | 6.40 | $ 16.41 | $ 34,130 |
| Central Missouri nonmetropolitan area | 180 | 1.17 | 5.09 | $ 16.92 | $ 35,190 |
| South Central Wisconsin nonmetropolitan area | 200 | 1.00 | 4.37 | $ 17.69 | $ 36,790 |
| West Northwestern Ohio nonmetropolitan area | 220 | 0.92 | 4.02 | $ 17.34 | $ 36,060 |
Top paying nonmetropolitan areas for Plating Machine Setters, Operators, and Tenders, Metal and Plastic:
| Nonmetropolitan area | Employment (1) | Employment per thousand jobs | Location quotient (9) | Hourly mean wage | Annual mean wage (2) |
|---|---|---|---|---|---|
| Southeast Iowa nonmetropolitan area | 170 | 0.79 | 3.43 | $ 21.59 | $ 44,910 |
| Eastern Ohio nonmetropolitan area | 70 | 0.54 | 2.34 | $ 21.51 | $ 44,750 |
| Hill Country Region of Texas nonmetropolitan area | 50 | 0.27 | 1.17 | $ 20.30 | $ 42,220 |
| West Central-Southwest New Hampshire nonmetropolitan area | 50 | 0.52 | 2.26 | $ 20.10 | $ 41,810 |
| Western Pennsylvania nonmetropolitan area | 50 | 0.34 | 1.50 | $ 19.25 | $ 40,040 |
These estimates are calculated with data collected from employers in all industry sectors, all metropolitan and nonmetropolitan areas, and all states and the District of Columbia. The top employment and wage figures are provided above. The complete list is available in the downloadable XLS files.
The percentile wage estimate is the value of a wage below which a certain percent of workers fall. The median wage is the 50th percentile wage estimate—50 percent of workers earn less than the median and 50 percent of workers earn more than the median. More about percentile wages.
(1) Estimates for detailed occupations do not sum to the totals because the totals include occupations not shown separately. Estimates do not include self-employed workers.
(2) Annual wages have been calculated by multiplying the hourly mean wage by a "year-round, full-time" hours figure of 2,080 hours; for those occupations where there is not an hourly wage published, the annual wage has been directly calculated from the reported survey data.
(3) The relative standard error (RSE) is a measure of the reliability of a survey statistic. The smaller the relative standard error, the more precise the estimate.
(8) Estimate not released.
(9) The location quotient is the ratio of the area concentration of occupational employment to the national average concentration. A location quotient greater than one indicates the occupation has a higher share of employment than average, and a location quotient less than one indicates the occupation is less prevalent in the area than average.
Other OEWS estimates and related information:
May 2021 National Occupational Employment and Wage Estimates
May 2021 State Occupational Employment and Wage Estimates
May 2021 Metropolitan and Nonmetropolitan Area Occupational Employment and Wage Estimates
May 2021 National Industry-Specific Occupational Employment and Wage Estimates
Last Modified Date: March 31, 2022