
An official website of the United States government
An official website of the United States government
The .gov means it's official.
Federal government websites often end in .gov or .mil. Before sharing sensitive information,
make sure you're on a federal government site.
The site is secure.
The
https:// ensures that you are connecting to the official website and that any
information you provide is encrypted and transmitted securely.
Operate or tend sewing machines to join, reinforce, decorate, or perform related sewing operations in the manufacture of garment or nongarment products.
Employment estimate and mean wage estimates for Sewing Machine Operators:
| Employment (1) | Employment RSE (3) |
Mean hourly wage |
Mean annual wage (2) |
Wage RSE (3) |
|---|---|---|---|---|
| 116,220 | 1.6 % | $ 14.85 | $ 30,880 | 0.4 % |
Percentile wage estimates for Sewing Machine Operators:
| Percentile | 10% | 25% | 50% (Median) |
75% | 90% |
|---|---|---|---|---|---|
| Hourly Wage | $ 10.72 | $ 12.56 | $ 14.27 | $ 17.35 | $ 18.47 |
| Annual Wage (2) | $ 22,290 | $ 26,120 | $ 29,690 | $ 36,100 | $ 38,420 |
Industries with the highest published employment and wages for Sewing Machine Operators are provided. For a list of all industries with employment in Sewing Machine Operators, see the Create Customized Tables function.
Industries with the highest levels of employment in Sewing Machine Operators:
| Industry | Employment (1) | Percent of industry employment | Hourly mean wage | Annual mean wage (2) |
|---|---|---|---|---|
| Cut and Sew Apparel Manufacturing | 27,250 | 38.52 | $ 14.08 | $ 29,280 |
| Other Textile Product Mills | 18,500 | 31.58 | $ 14.90 | $ 30,980 |
| Textile Furnishings Mills | 8,110 | 18.91 | $ 14.88 | $ 30,960 |
| Furniture and Related Product Manufacturing (3371 and 3372 only) | 7,500 | 2.26 | $ 16.70 | $ 34,740 |
| Printing and Related Support Activities | 4,520 | 1.23 | $ 15.26 | $ 31,740 |
Industries with the highest concentration of employment in Sewing Machine Operators:
| Industry | Employment (1) | Percent of industry employment | Hourly mean wage | Annual mean wage (2) |
|---|---|---|---|---|
| Cut and Sew Apparel Manufacturing | 27,250 | 38.52 | $ 14.08 | $ 29,280 |
| Apparel Accessories and Other Apparel Manufacturing | 3,400 | 33.21 | $ 14.30 | $ 29,740 |
| Other Textile Product Mills | 18,500 | 31.58 | $ 14.90 | $ 30,980 |
| Other Leather and Allied Product Manufacturing | 2,370 | 21.76 | $ 14.85 | $ 30,900 |
| Textile Furnishings Mills | 8,110 | 18.91 | $ 14.88 | $ 30,960 |
Top paying industries for Sewing Machine Operators:
| Industry | Employment (1) | Percent of industry employment | Hourly mean wage | Annual mean wage (2) |
|---|---|---|---|---|
| Support Activities for Air Transportation | (8) | (8) | $ 24.37 | $ 50,680 |
| Federal Executive Branch (OEWS Designation) | 100 | (7) | $ 21.21 | $ 44,110 |
| State Government, excluding schools and hospitals (OEWS Designation) | 40 | (7) | $ 21.12 | $ 43,920 |
| Management of Companies and Enterprises | 260 | 0.01 | $ 18.99 | $ 39,490 |
| Aerospace Product and Parts Manufacturing | 40 | 0.01 | $ 18.77 | $ 39,040 |
States and areas with the highest published employment, location quotients, and wages for Sewing Machine Operators are provided. For a list of all areas with employment in Sewing Machine Operators, see the Create Customized Tables function.
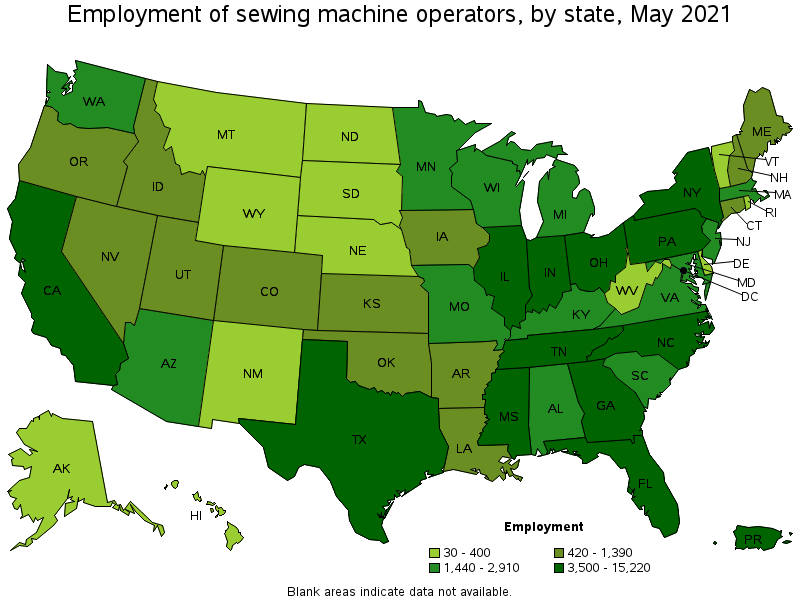
States with the highest employment level in Sewing Machine Operators:
| State | Employment (1) | Employment per thousand jobs | Location quotient (9) | Hourly mean wage | Annual mean wage (2) |
|---|---|---|---|---|---|
| California | 15,220 | 0.92 | 1.12 | $ 15.99 | $ 33,270 |
| North Carolina | 8,320 | 1.88 | 2.28 | $ 14.95 | $ 31,100 |
| Texas | 7,790 | 0.64 | 0.77 | $ 13.00 | $ 27,050 |
| Florida | 7,060 | 0.82 | 0.99 | $ 13.46 | $ 28,000 |
| New York | 5,140 | 0.59 | 0.72 | $ 16.89 | $ 35,120 |
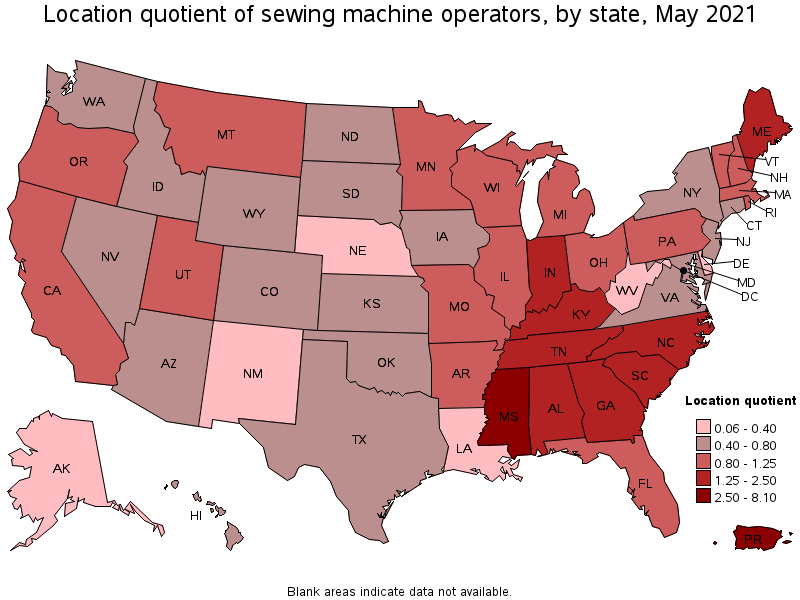
States with the highest concentration of jobs and location quotients in Sewing Machine Operators:
| State | Employment (1) | Employment per thousand jobs | Location quotient (9) | Hourly mean wage | Annual mean wage (2) |
|---|---|---|---|---|---|
| Mississippi | 3,500 | 3.18 | 3.85 | $ 14.43 | $ 30,020 |
| North Carolina | 8,320 | 1.88 | 2.28 | $ 14.95 | $ 31,100 |
| Kentucky | 2,910 | 1.58 | 1.92 | $ 12.73 | $ 26,470 |
| Tennessee | 4,690 | 1.57 | 1.90 | $ 12.90 | $ 26,840 |
| Alabama | 2,680 | 1.39 | 1.68 | $ 11.89 | $ 24,720 |
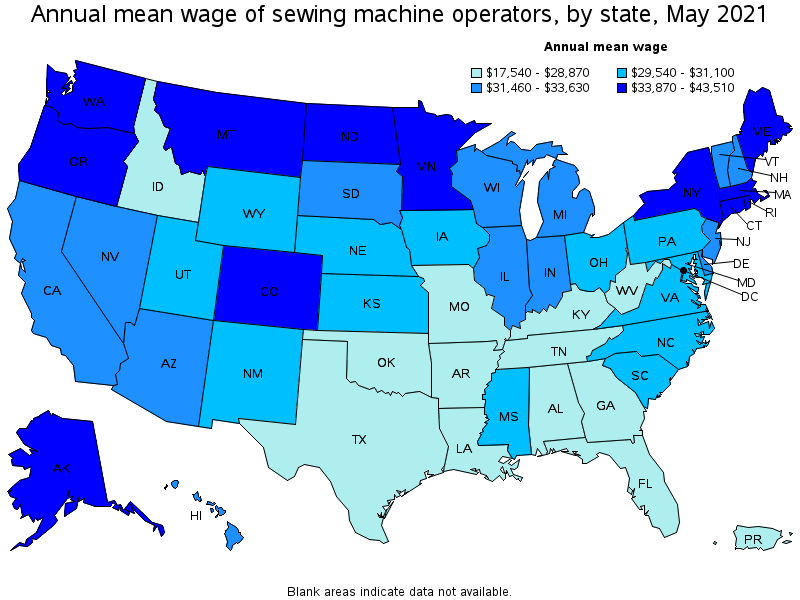
Top paying states for Sewing Machine Operators:
| State | Employment (1) | Employment per thousand jobs | Location quotient (9) | Hourly mean wage | Annual mean wage (2) |
|---|---|---|---|---|---|
| Alaska | 40 | 0.12 | 0.15 | $ 20.92 | $ 43,510 |
| District of Columbia | 30 | 0.05 | 0.06 | $ 19.33 | $ 40,210 |
| Connecticut | 750 | 0.48 | 0.58 | $ 18.03 | $ 37,510 |
| Colorado | 1,340 | 0.51 | 0.62 | $ 17.97 | $ 37,370 |
| Washington | 1,980 | 0.62 | 0.75 | $ 17.61 | $ 36,620 |
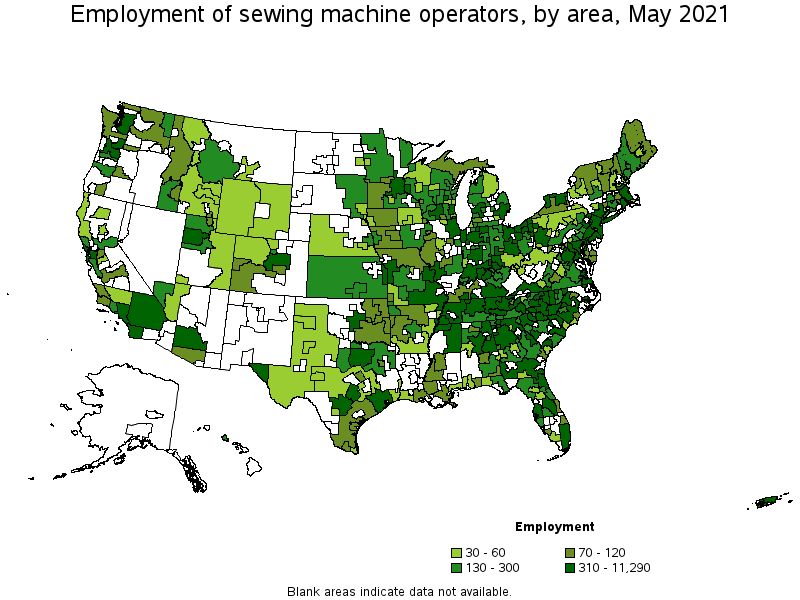
Metropolitan areas with the highest employment level in Sewing Machine Operators:
| Metropolitan area | Employment (1) | Employment per thousand jobs | Location quotient (9) | Hourly mean wage | Annual mean wage (2) |
|---|---|---|---|---|---|
| Los Angeles-Long Beach-Anaheim, CA | 11,290 | 1.97 | 2.39 | $ 15.75 | $ 32,760 |
| New York-Newark-Jersey City, NY-NJ-PA | 5,620 | 0.65 | 0.78 | $ 16.73 | $ 34,800 |
| Miami-Fort Lauderdale-West Palm Beach, FL | 3,330 | 1.36 | 1.65 | $ 12.75 | $ 26,510 |
| Chicago-Naperville-Elgin, IL-IN-WI | 3,190 | 0.75 | 0.91 | $ 15.64 | $ 32,530 |
| Dallas-Fort Worth-Arlington, TX | 2,650 | 0.74 | 0.90 | $ 13.84 | $ 28,790 |
| Hickory-Lenoir-Morganton, NC | 2,050 | 13.96 | 16.92 | $ 17.69 | $ 36,800 |
| Atlanta-Sandy Springs-Roswell, GA | 1,990 | 0.77 | 0.93 | $ 13.94 | $ 28,990 |
| Philadelphia-Camden-Wilmington, PA-NJ-DE-MD | 1,690 | 0.64 | 0.77 | $ 15.19 | $ 31,600 |
| Houston-The Woodlands-Sugar Land, TX | 1,610 | 0.56 | 0.68 | $ 12.70 | $ 26,410 |
| Phoenix-Mesa-Scottsdale, AZ | 1,530 | 0.72 | 0.88 | $ 15.75 | $ 32,750 |
Metropolitan areas with the highest concentration of jobs and location quotients in Sewing Machine Operators:
| Metropolitan area | Employment (1) | Employment per thousand jobs | Location quotient (9) | Hourly mean wage | Annual mean wage (2) |
|---|---|---|---|---|---|
| Hickory-Lenoir-Morganton, NC | 2,050 | 13.96 | 16.92 | $ 17.69 | $ 36,800 |
| Dalton, GA | 720 | 11.53 | 13.97 | $ 13.70 | $ 28,490 |
| New Bedford, MA | 330 | 5.28 | 6.40 | $ 15.86 | $ 32,980 |
| Elkhart-Goshen, IN | 680 | 5.12 | 6.20 | $ 16.02 | $ 33,310 |
| Cleveland, TN | 220 | 4.91 | 5.96 | $ 11.21 | $ 23,320 |
| Greensboro-High Point, NC | 1,510 | 4.42 | 5.36 | $ 14.80 | $ 30,790 |
| Spartanburg, SC | 670 | 4.31 | 5.22 | $ 16.64 | $ 34,620 |
| Oshkosh-Neenah, WI | 340 | 3.76 | 4.56 | $ 16.01 | $ 33,310 |
| Clarksville, TN-KY | 320 | 3.62 | 4.39 | $ 14.22 | $ 29,580 |
| Anniston-Oxford-Jacksonville, AL | 130 | 3.02 | 3.67 | $ 12.03 | $ 25,030 |
Top paying metropolitan areas for Sewing Machine Operators:
| Metropolitan area | Employment (1) | Employment per thousand jobs | Location quotient (9) | Hourly mean wage | Annual mean wage (2) |
|---|---|---|---|---|---|
| Appleton, WI | 130 | 1.08 | 1.31 | $ 20.70 | $ 43,060 |
| Glens Falls, NY | 40 | 0.86 | 1.04 | $ 20.32 | $ 42,270 |
| Bridgeport-Stamford-Norwalk, CT | 180 | 0.48 | 0.58 | $ 19.55 | $ 40,660 |
| Boulder, CO | 150 | 0.83 | 1.01 | $ 19.20 | $ 39,930 |
| San Jose-Sunnyvale-Santa Clara, CA | 200 | 0.19 | 0.23 | $ 19.12 | $ 39,770 |
| San Francisco-Oakland-Hayward, CA | 910 | 0.41 | 0.49 | $ 18.52 | $ 38,510 |
| Denver-Aurora-Lakewood, CO | 740 | 0.50 | 0.61 | $ 18.21 | $ 37,870 |
| Seattle-Tacoma-Bellevue, WA | 1,300 | 0.68 | 0.82 | $ 18.19 | $ 37,830 |
| Portsmouth, NH-ME | 50 | 0.61 | 0.74 | $ 17.88 | $ 37,190 |
| Boston-Cambridge-Nashua, MA-NH | 1,320 | 0.51 | 0.62 | $ 17.81 | $ 37,040 |
Nonmetropolitan areas with the highest employment in Sewing Machine Operators:
| Nonmetropolitan area | Employment (1) | Employment per thousand jobs | Location quotient (9) | Hourly mean wage | Annual mean wage (2) |
|---|---|---|---|---|---|
| Northeast Mississippi nonmetropolitan area | 2,810 | 12.67 | 15.36 | $ 14.88 | $ 30,950 |
| Piedmont North Carolina nonmetropolitan area | 870 | 3.55 | 4.30 | $ 13.06 | $ 27,170 |
| South Central Kentucky nonmetropolitan area | 740 | 4.54 | 5.50 | $ 11.03 | $ 22,940 |
| North Central Tennessee nonmetropolitan area | 620 | 5.69 | 6.89 | $ 12.44 | $ 25,870 |
| North Georgia nonmetropolitan area | 550 | 3.25 | 3.94 | $ 13.37 | $ 27,800 |
Nonmetropolitan areas with the highest concentration of jobs and location quotients in Sewing Machine Operators:
| Nonmetropolitan area | Employment (1) | Employment per thousand jobs | Location quotient (9) | Hourly mean wage | Annual mean wage (2) |
|---|---|---|---|---|---|
| Northeast Mississippi nonmetropolitan area | 2,810 | 12.67 | 15.36 | $ 14.88 | $ 30,950 |
| North Central Tennessee nonmetropolitan area | 620 | 5.69 | 6.89 | $ 12.44 | $ 25,870 |
| Northwest Alabama nonmetropolitan area | 300 | 4.59 | 5.57 | $ 10.87 | $ 22,610 |
| South Central Kentucky nonmetropolitan area | 740 | 4.54 | 5.50 | $ 11.03 | $ 22,940 |
| Southwest Virginia nonmetropolitan area | 480 | 4.25 | 5.15 | $ 12.81 | $ 26,640 |
Top paying nonmetropolitan areas for Sewing Machine Operators:
| Nonmetropolitan area | Employment (1) | Employment per thousand jobs | Location quotient (9) | Hourly mean wage | Annual mean wage (2) |
|---|---|---|---|---|---|
| Northwest Colorado nonmetropolitan area | 60 | 0.50 | 0.61 | $ 20.82 | $ 43,300 |
| Eastern Washington nonmetropolitan area | 70 | 0.70 | 0.85 | $ 17.34 | $ 36,080 |
| Connecticut nonmetropolitan area | 90 | 2.98 | 3.61 | $ 17.28 | $ 35,930 |
| Southwest Colorado nonmetropolitan area | 80 | 0.77 | 0.93 | $ 17.18 | $ 35,730 |
| Southwest Maine nonmetropolitan area | 160 | 0.90 | 1.09 | $ 16.93 | $ 35,210 |
These estimates are calculated with data collected from employers in all industry sectors, all metropolitan and nonmetropolitan areas, and all states and the District of Columbia. The top employment and wage figures are provided above. The complete list is available in the downloadable XLS files.
The percentile wage estimate is the value of a wage below which a certain percent of workers fall. The median wage is the 50th percentile wage estimate—50 percent of workers earn less than the median and 50 percent of workers earn more than the median. More about percentile wages.
(1) Estimates for detailed occupations do not sum to the totals because the totals include occupations not shown separately. Estimates do not include self-employed workers.
(2) Annual wages have been calculated by multiplying the hourly mean wage by a "year-round, full-time" hours figure of 2,080 hours; for those occupations where there is not an hourly wage published, the annual wage has been directly calculated from the reported survey data.
(3) The relative standard error (RSE) is a measure of the reliability of a survey statistic. The smaller the relative standard error, the more precise the estimate.
(7) The value is less than .005 percent of industry employment.
(8) Estimate not released.
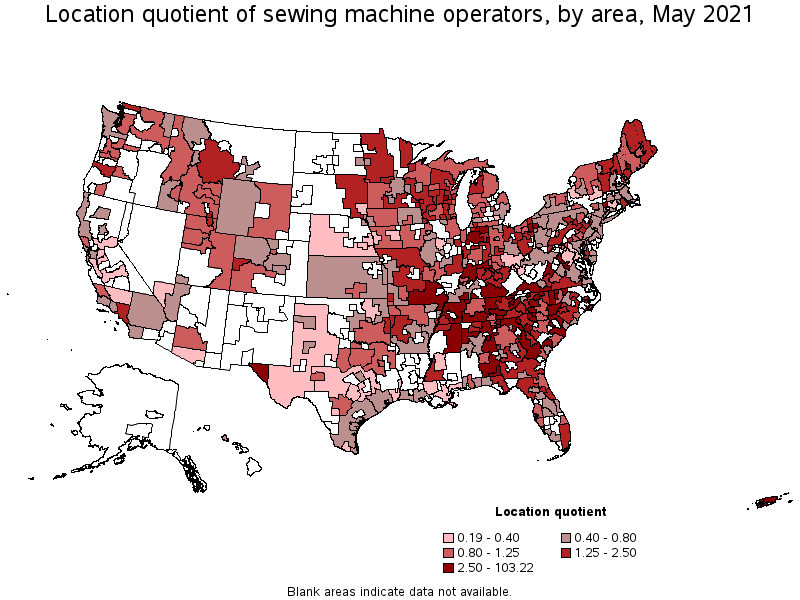
(9) The location quotient is the ratio of the area concentration of occupational employment to the national average concentration. A location quotient greater than one indicates the occupation has a higher share of employment than average, and a location quotient less than one indicates the occupation is less prevalent in the area than average.
Other OEWS estimates and related information:
May 2021 National Occupational Employment and Wage Estimates
May 2021 State Occupational Employment and Wage Estimates
May 2021 Metropolitan and Nonmetropolitan Area Occupational Employment and Wage Estimates
May 2021 National Industry-Specific Occupational Employment and Wage Estimates
Last Modified Date: March 31, 2022