
An official website of the United States government
An official website of the United States government
The .gov means it's official.
Federal government websites often end in .gov or .mil. Before sharing sensitive information,
make sure you're on a federal government site.
The site is secure.
The
https:// ensures that you are connecting to the official website and that any
information you provide is encrypted and transmitted securely.
Cut, shape, and assemble wooden articles or set up and operate a variety of woodworking machines, such as power saws, jointers, and mortisers to surface, cut, or shape lumber or to fabricate parts for wood products. Excludes �Woodworking Machine Setters, Operators, and Tenders� (51-7040).
Employment estimate and mean wage estimates for Cabinetmakers and Bench Carpenters:
| Employment (1) | Employment RSE (3) |
Mean hourly wage |
Mean annual wage (2) |
Wage RSE (3) |
|---|---|---|---|---|
| 93,070 | 1.8 % | $ 19.27 | $ 40,070 | 0.5 % |
Percentile wage estimates for Cabinetmakers and Bench Carpenters:
| Percentile | 10% | 25% | 50% (Median) |
75% | 90% |
|---|---|---|---|---|---|
| Hourly Wage | $ 13.56 | $ 14.46 | $ 18.05 | $ 22.67 | $ 28.00 |
| Annual Wage (2) | $ 28,200 | $ 30,070 | $ 37,540 | $ 47,160 | $ 58,250 |
Industries with the highest published employment and wages for Cabinetmakers and Bench Carpenters are provided. For a list of all industries with employment in Cabinetmakers and Bench Carpenters, see the Create Customized Tables function.
Industries with the highest levels of employment in Cabinetmakers and Bench Carpenters:
| Industry | Employment (1) | Percent of industry employment | Hourly mean wage | Annual mean wage (2) |
|---|---|---|---|---|
| Furniture and Related Product Manufacturing (3371 and 3372 only) | 64,870 | 19.59 | $ 19.09 | $ 39,710 |
| Other Wood Product Manufacturing | 8,070 | 3.45 | $ 18.44 | $ 38,350 |
| Building Finishing Contractors | 7,250 | 0.90 | $ 20.32 | $ 42,260 |
| Motor Vehicle Body and Trailer Manufacturing | 3,110 | 1.99 | $ 22.72 | $ 47,250 |
| Building Material and Supplies Dealers | 1,490 | 0.12 | $ 16.86 | $ 35,060 |
Industries with the highest concentration of employment in Cabinetmakers and Bench Carpenters:
| Industry | Employment (1) | Percent of industry employment | Hourly mean wage | Annual mean wage (2) |
|---|---|---|---|---|
| Furniture and Related Product Manufacturing (3371 and 3372 only) | 64,870 | 19.59 | $ 19.09 | $ 39,710 |
| Other Wood Product Manufacturing | 8,070 | 3.45 | $ 18.44 | $ 38,350 |
| Motor Vehicle Body and Trailer Manufacturing | 3,110 | 1.99 | $ 22.72 | $ 47,250 |
| Other Support Activities for Transportation | 340 | 1.01 | $ 17.71 | $ 36,830 |
| Building Finishing Contractors | 7,250 | 0.90 | $ 20.32 | $ 42,260 |
Top paying industries for Cabinetmakers and Bench Carpenters:
| Industry | Employment (1) | Percent of industry employment | Hourly mean wage | Annual mean wage (2) |
|---|---|---|---|---|
| Professional and Commercial Equipment and Supplies Merchant Wholesalers | (8) | (8) | $ 28.51 | $ 59,300 |
| Federal Executive Branch (OEWS Designation) | 200 | 0.01 | $ 27.99 | $ 58,210 |
| Aerospace Product and Parts Manufacturing | 240 | 0.05 | $ 26.12 | $ 54,330 |
| Warehousing and Storage | 110 | 0.01 | $ 24.80 | $ 51,580 |
| Elementary and Secondary Schools | 30 | (7) | $ 24.46 | $ 50,870 |
States and areas with the highest published employment, location quotients, and wages for Cabinetmakers and Bench Carpenters are provided. For a list of all areas with employment in Cabinetmakers and Bench Carpenters, see the Create Customized Tables function.
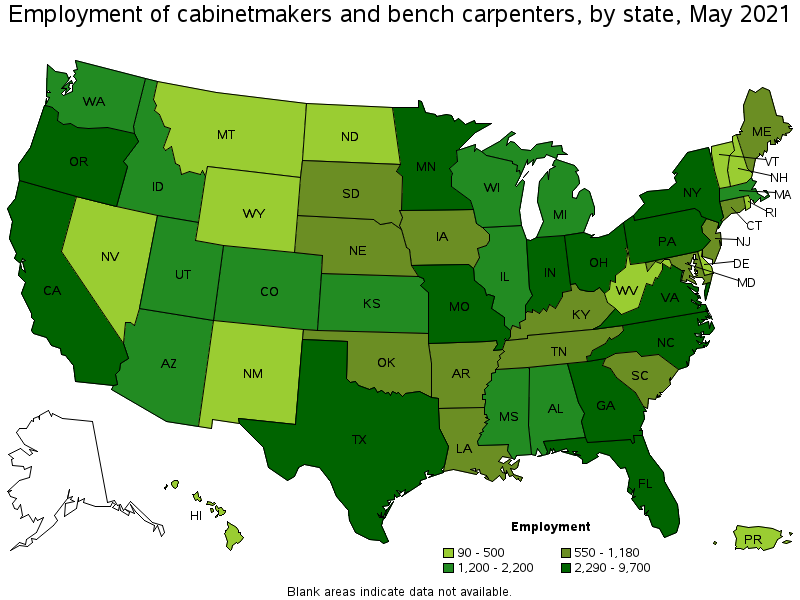
States with the highest employment level in Cabinetmakers and Bench Carpenters:
| State | Employment (1) | Employment per thousand jobs | Location quotient (9) | Hourly mean wage | Annual mean wage (2) |
|---|---|---|---|---|---|
| California | 9,700 | 0.59 | 0.89 | $ 21.67 | $ 45,070 |
| Texas | 8,780 | 0.72 | 1.09 | $ 16.22 | $ 33,740 |
| Indiana | 6,730 | 2.26 | 3.42 | $ 20.86 | $ 43,390 |
| Pennsylvania | 4,990 | 0.89 | 1.35 | $ 20.74 | $ 43,130 |
| Florida | 4,120 | 0.48 | 0.73 | $ 18.71 | $ 38,920 |
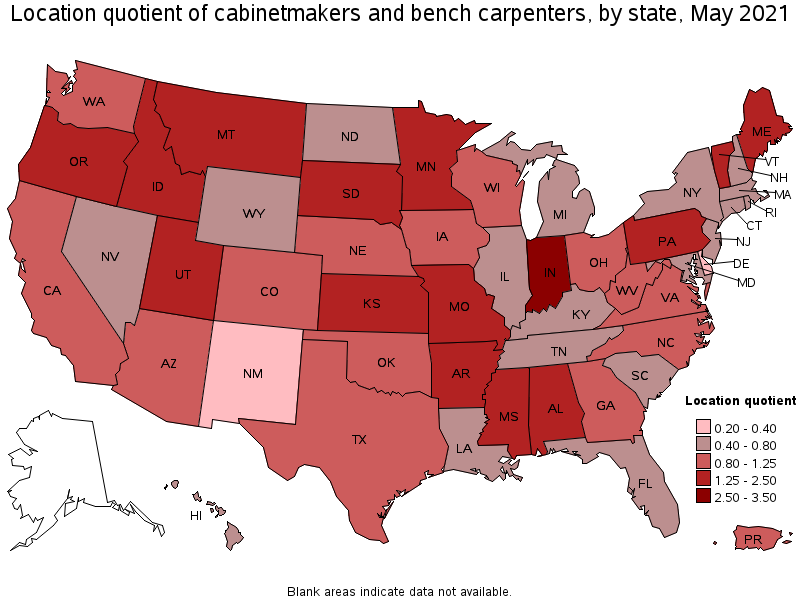
States with the highest concentration of jobs and location quotients in Cabinetmakers and Bench Carpenters:
| State | Employment (1) | Employment per thousand jobs | Location quotient (9) | Hourly mean wage | Annual mean wage (2) |
|---|---|---|---|---|---|
| Indiana | 6,730 | 2.26 | 3.42 | $ 20.86 | $ 43,390 |
| Idaho | 1,210 | 1.60 | 2.42 | $ 18.86 | $ 39,240 |
| South Dakota | 650 | 1.55 | 2.35 | $ 16.50 | $ 34,310 |
| Oregon | 2,790 | 1.53 | 2.32 | $ 18.63 | $ 38,750 |
| Maine | 800 | 1.36 | 2.05 | $ 19.68 | $ 40,940 |
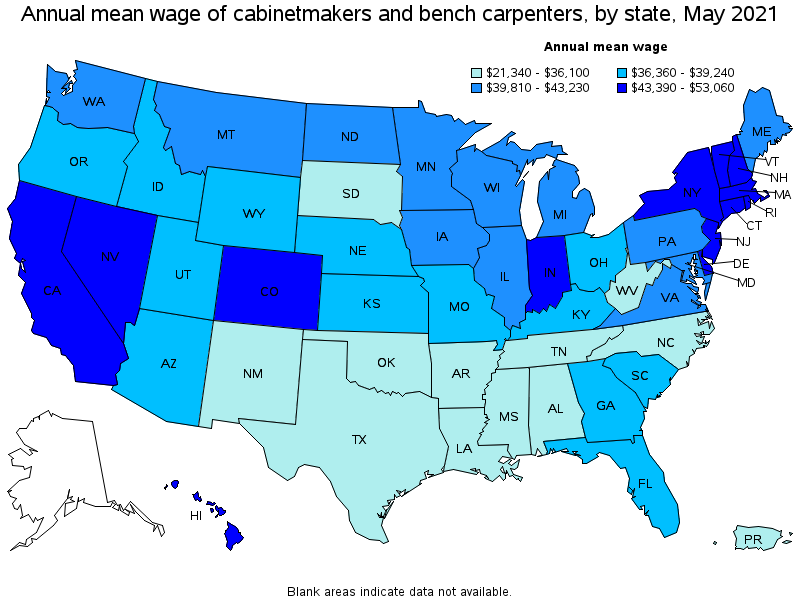
Top paying states for Cabinetmakers and Bench Carpenters:
| State | Employment (1) | Employment per thousand jobs | Location quotient (9) | Hourly mean wage | Annual mean wage (2) |
|---|---|---|---|---|---|
| Massachusetts | 1,480 | 0.44 | 0.66 | $ 25.51 | $ 53,060 |
| Hawaii | 140 | 0.26 | 0.40 | $ 25.32 | $ 52,660 |
| Connecticut | 630 | 0.40 | 0.61 | $ 23.60 | $ 49,080 |
| New Jersey | 1,030 | 0.27 | 0.40 | $ 23.26 | $ 48,380 |
| Rhode Island | 230 | 0.50 | 0.76 | $ 21.72 | $ 45,180 |
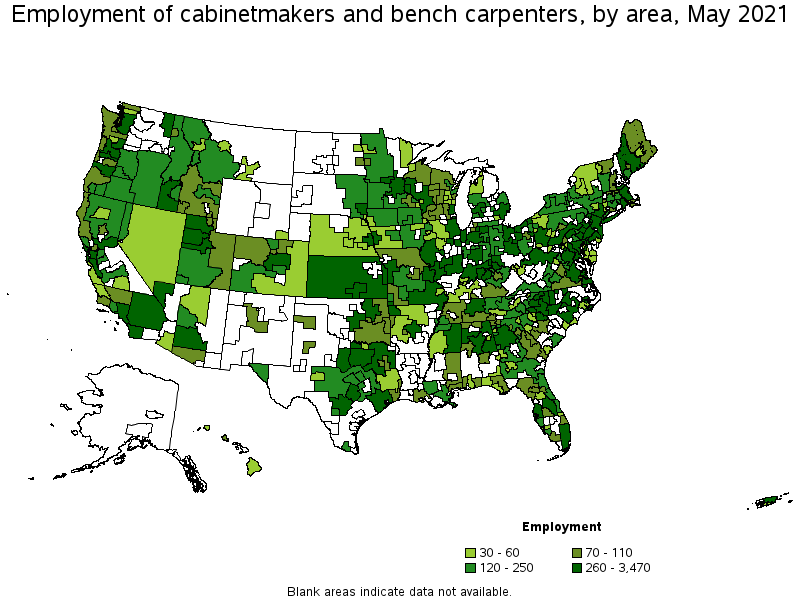
Metropolitan areas with the highest employment level in Cabinetmakers and Bench Carpenters:
| Metropolitan area | Employment (1) | Employment per thousand jobs | Location quotient (9) | Hourly mean wage | Annual mean wage (2) |
|---|---|---|---|---|---|
| Los Angeles-Long Beach-Anaheim, CA | 3,470 | 0.61 | 0.92 | $ 21.39 | $ 44,480 |
| Elkhart-Goshen, IN | 3,460 | 25.85 | 39.14 | $ 22.26 | $ 46,300 |
| New York-Newark-Jersey City, NY-NJ-PA | 3,240 | 0.37 | 0.57 | $ 22.92 | $ 47,680 |
| Dallas-Fort Worth-Arlington, TX | 3,200 | 0.89 | 1.35 | $ 17.16 | $ 35,690 |
| Atlanta-Sandy Springs-Roswell, GA | 1,690 | 0.65 | 0.99 | $ 18.97 | $ 39,450 |
| Phoenix-Mesa-Scottsdale, AZ | 1,520 | 0.72 | 1.08 | $ 18.85 | $ 39,220 |
| Minneapolis-St. Paul-Bloomington, MN-WI | 1,500 | 0.82 | 1.25 | $ 20.60 | $ 42,850 |
| Portland-Vancouver-Hillsboro, OR-WA | 1,410 | 1.25 | 1.90 | $ 19.96 | $ 41,510 |
| Houston-The Woodlands-Sugar Land, TX | 1,350 | 0.47 | 0.71 | $ 17.21 | $ 35,790 |
| Riverside-San Bernardino-Ontario, CA | 1,290 | 0.84 | 1.28 | $ 19.96 | $ 41,510 |
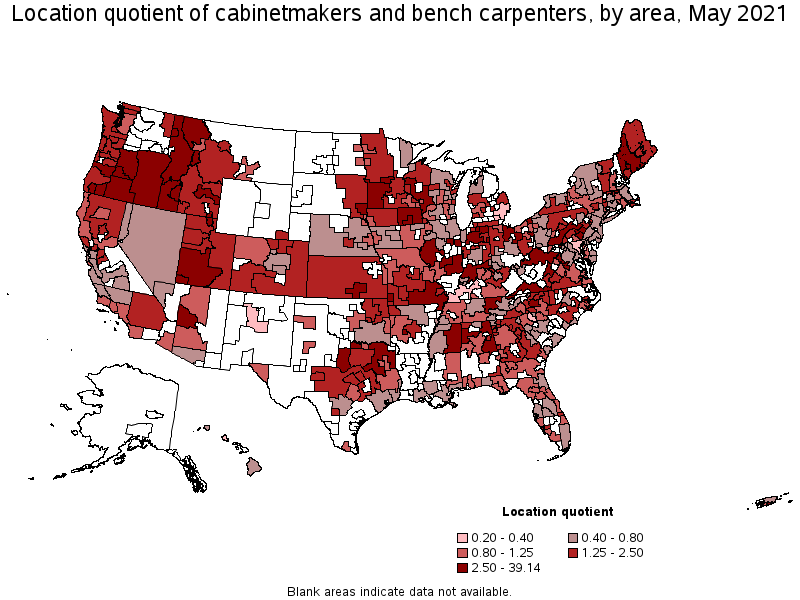
Metropolitan areas with the highest concentration of jobs and location quotients in Cabinetmakers and Bench Carpenters:
| Metropolitan area | Employment (1) | Employment per thousand jobs | Location quotient (9) | Hourly mean wage | Annual mean wage (2) |
|---|---|---|---|---|---|
| Elkhart-Goshen, IN | 3,460 | 25.85 | 39.14 | $ 22.26 | $ 46,300 |
| Grants Pass, OR | 220 | 7.65 | 11.58 | $ 17.70 | $ 36,810 |
| Lancaster, PA | 770 | 3.27 | 4.95 | $ 20.73 | $ 43,130 |
| Lebanon, PA | 150 | 3.10 | 4.69 | $ 19.20 | $ 39,940 |
| St. Cloud, MN | 300 | 3.07 | 4.64 | $ 19.05 | $ 39,620 |
| St. George, UT | 210 | 2.73 | 4.13 | $ 18.26 | $ 37,980 |
| Joplin, MO | 200 | 2.66 | 4.03 | $ 16.46 | $ 34,230 |
| Reading, PA | 420 | 2.58 | 3.90 | $ 20.28 | $ 42,180 |
| Waterloo-Cedar Falls, IA | 200 | 2.41 | 3.65 | $ 19.52 | $ 40,610 |
| Sioux Falls, SD | 370 | 2.40 | 3.64 | $ 17.05 | $ 35,470 |
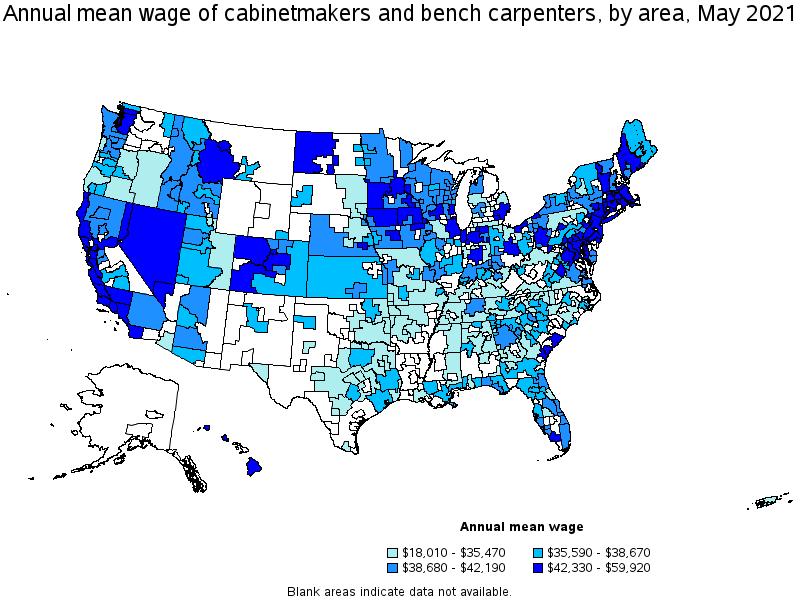
Top paying metropolitan areas for Cabinetmakers and Bench Carpenters:
| Metropolitan area | Employment (1) | Employment per thousand jobs | Location quotient (9) | Hourly mean wage | Annual mean wage (2) |
|---|---|---|---|---|---|
| Barnstable Town, MA | 100 | 1.03 | 1.55 | $ 27.03 | $ 56,220 |
| San Jose-Sunnyvale-Santa Clara, CA | 420 | 0.39 | 0.59 | $ 26.01 | $ 54,100 |
| Burlington-South Burlington, VT | 50 | 0.40 | 0.61 | $ 25.99 | $ 54,070 |
| Boston-Cambridge-Nashua, MA-NH | 840 | 0.33 | 0.49 | $ 25.61 | $ 53,260 |
| San Francisco-Oakland-Hayward, CA | 1,050 | 0.47 | 0.71 | $ 25.28 | $ 52,570 |
| New Bedford, MA | 40 | 0.62 | 0.95 | $ 24.89 | $ 51,760 |
| Leominster-Gardner, MA | 110 | 2.33 | 3.53 | $ 24.79 | $ 51,550 |
| Philadelphia-Camden-Wilmington, PA-NJ-DE-MD | 1,150 | 0.43 | 0.66 | $ 24.75 | $ 51,490 |
| Urban Honolulu, HI | 80 | 0.20 | 0.31 | $ 24.59 | $ 51,140 |
| Worcester, MA-CT | 150 | 0.57 | 0.86 | $ 24.48 | $ 50,910 |
Nonmetropolitan areas with the highest employment in Cabinetmakers and Bench Carpenters:
| Nonmetropolitan area | Employment (1) | Employment per thousand jobs | Location quotient (9) | Hourly mean wage | Annual mean wage (2) |
|---|---|---|---|---|---|
| North Texas Region of Texas nonmetropolitan area | 1,230 | 4.63 | 7.01 | $ 13.85 | $ 28,810 |
| North Northeastern Ohio nonmetropolitan area (noncontiguous) | 1,190 | 3.80 | 5.75 | $ 16.88 | $ 35,100 |
| Southern Indiana nonmetropolitan area | 990 | 5.38 | 8.14 | $ 18.67 | $ 38,830 |
| Southeast Missouri nonmetropolitan area | 950 | 6.00 | 9.09 | $ 16.00 | $ 33,270 |
| Northeast Mississippi nonmetropolitan area | 870 | 3.91 | 5.91 | $ 15.15 | $ 31,520 |
Nonmetropolitan areas with the highest concentration of jobs and location quotients in Cabinetmakers and Bench Carpenters:
| Nonmetropolitan area | Employment (1) | Employment per thousand jobs | Location quotient (9) | Hourly mean wage | Annual mean wage (2) |
|---|---|---|---|---|---|
| Northwest Alabama nonmetropolitan area | 490 | 7.48 | 11.32 | $ 14.81 | $ 30,790 |
| Southeast Missouri nonmetropolitan area | 950 | 6.00 | 9.09 | $ 16.00 | $ 33,270 |
| Southern Indiana nonmetropolitan area | 990 | 5.38 | 8.14 | $ 18.67 | $ 38,830 |
| Northeast Alabama nonmetropolitan area | 670 | 4.73 | 7.16 | $ 14.38 | $ 29,910 |
| North Texas Region of Texas nonmetropolitan area | 1,230 | 4.63 | 7.01 | $ 13.85 | $ 28,810 |
Top paying nonmetropolitan areas for Cabinetmakers and Bench Carpenters:
| Nonmetropolitan area | Employment (1) | Employment per thousand jobs | Location quotient (9) | Hourly mean wage | Annual mean wage (2) |
|---|---|---|---|---|---|
| Massachusetts nonmetropolitan area | 80 | 1.41 | 2.13 | $ 28.81 | $ 59,920 |
| Hawaii / Kauai nonmetropolitan area | 40 | 0.47 | 0.72 | $ 28.30 | $ 58,870 |
| Northwest Colorado nonmetropolitan area | 80 | 0.69 | 1.05 | $ 23.24 | $ 48,340 |
| Connecticut nonmetropolitan area | 30 | 1.11 | 1.68 | $ 23.20 | $ 48,250 |
| West North Dakota nonmetropolitan area | (8) | (8) | (8) | $ 22.66 | $ 47,130 |
These estimates are calculated with data collected from employers in all industry sectors, all metropolitan and nonmetropolitan areas, and all states and the District of Columbia. The top employment and wage figures are provided above. The complete list is available in the downloadable XLS files.
The percentile wage estimate is the value of a wage below which a certain percent of workers fall. The median wage is the 50th percentile wage estimate—50 percent of workers earn less than the median and 50 percent of workers earn more than the median. More about percentile wages.
(1) Estimates for detailed occupations do not sum to the totals because the totals include occupations not shown separately. Estimates do not include self-employed workers.
(2) Annual wages have been calculated by multiplying the hourly mean wage by a "year-round, full-time" hours figure of 2,080 hours; for those occupations where there is not an hourly wage published, the annual wage has been directly calculated from the reported survey data.
(3) The relative standard error (RSE) is a measure of the reliability of a survey statistic. The smaller the relative standard error, the more precise the estimate.
(7) The value is less than .005 percent of industry employment.
(8) Estimate not released.
(9) The location quotient is the ratio of the area concentration of occupational employment to the national average concentration. A location quotient greater than one indicates the occupation has a higher share of employment than average, and a location quotient less than one indicates the occupation is less prevalent in the area than average.
Other OEWS estimates and related information:
May 2021 National Occupational Employment and Wage Estimates
May 2021 State Occupational Employment and Wage Estimates
May 2021 Metropolitan and Nonmetropolitan Area Occupational Employment and Wage Estimates
May 2021 National Industry-Specific Occupational Employment and Wage Estimates
Last Modified Date: March 31, 2022