
An official website of the United States government
An official website of the United States government
The .gov means it's official.
Federal government websites often end in .gov or .mil. Before sharing sensitive information,
make sure you're on a federal government site.
The site is secure.
The
https:// ensures that you are connecting to the official website and that any
information you provide is encrypted and transmitted securely.
Shape, finish, and refinish damaged, worn, or used furniture or new high-grade furniture to specified color or finish.
Employment estimate and mean wage estimates for Furniture Finishers:
| Employment (1) | Employment RSE (3) |
Mean hourly wage |
Mean annual wage (2) |
Wage RSE (3) |
|---|---|---|---|---|
| 16,300 | 2.8 % | $ 17.94 | $ 37,310 | 0.8 % |
Percentile wage estimates for Furniture Finishers:
| Percentile | 10% | 25% | 50% (Median) |
75% | 90% |
|---|---|---|---|---|---|
| Hourly Wage | $ 12.59 | $ 14.23 | $ 17.59 | $ 21.41 | $ 23.43 |
| Annual Wage (2) | $ 26,200 | $ 29,610 | $ 36,580 | $ 44,520 | $ 48,730 |
Industries with the highest published employment and wages for Furniture Finishers are provided. For a list of all industries with employment in Furniture Finishers, see the Create Customized Tables function.
Industries with the highest levels of employment in Furniture Finishers:
| Industry | Employment (1) | Percent of industry employment | Hourly mean wage | Annual mean wage (2) |
|---|---|---|---|---|
| Furniture and Related Product Manufacturing (3371 and 3372 only) | 10,320 | 3.12 | $ 17.61 | $ 36,630 |
| Personal and Household Goods Repair and Maintenance | 1,880 | 2.45 | $ 19.41 | $ 40,370 |
| Furniture Stores | 1,060 | 0.50 | $ 19.67 | $ 40,910 |
| Employment Services | 690 | 0.02 | $ 15.23 | $ 31,690 |
| Other Wood Product Manufacturing | 670 | 0.28 | $ 17.29 | $ 35,960 |
Industries with the highest concentration of employment in Furniture Finishers:
| Industry | Employment (1) | Percent of industry employment | Hourly mean wage | Annual mean wage (2) |
|---|---|---|---|---|
| Furniture and Related Product Manufacturing (3371 and 3372 only) | 10,320 | 3.12 | $ 17.61 | $ 36,630 |
| Personal and Household Goods Repair and Maintenance | 1,880 | 2.45 | $ 19.41 | $ 40,370 |
| Furniture Stores | 1,060 | 0.50 | $ 19.67 | $ 40,910 |
| Other Wood Product Manufacturing | 670 | 0.28 | $ 17.29 | $ 35,960 |
| Miscellaneous Store Retailers (4532 and 4533 only) | 160 | 0.04 | $ 17.98 | $ 37,390 |
Top paying industries for Furniture Finishers:
| Industry | Employment (1) | Percent of industry employment | Hourly mean wage | Annual mean wage (2) |
|---|---|---|---|---|
| Rental and leasing services (5322, 5323, and 5324 only) | (8) | (8) | $ 23.78 | $ 49,460 |
| Warehousing and Storage | 340 | 0.02 | $ 20.36 | $ 42,360 |
| Specialized Design Services | 50 | 0.04 | $ 19.81 | $ 41,200 |
| Furniture Stores | 1,060 | 0.50 | $ 19.67 | $ 40,910 |
| Personal and Household Goods Repair and Maintenance | 1,880 | 2.45 | $ 19.41 | $ 40,370 |
States and areas with the highest published employment, location quotients, and wages for Furniture Finishers are provided. For a list of all areas with employment in Furniture Finishers, see the Create Customized Tables function.
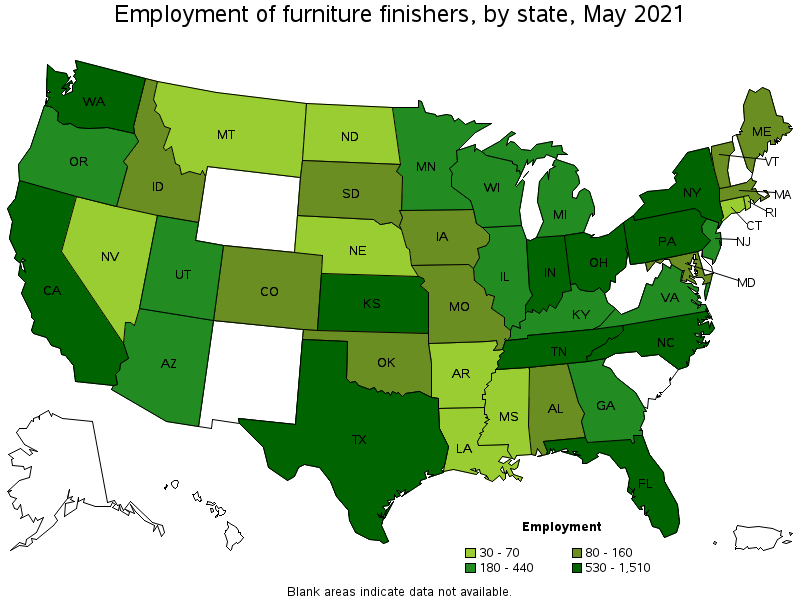
States with the highest employment level in Furniture Finishers:
| State | Employment (1) | Employment per thousand jobs | Location quotient (9) | Hourly mean wage | Annual mean wage (2) |
|---|---|---|---|---|---|
| Texas | 1,510 | 0.12 | 1.07 | $ 16.38 | $ 34,080 |
| Indiana | 1,450 | 0.49 | 4.21 | $ 17.52 | $ 36,440 |
| California | 1,430 | 0.09 | 0.75 | $ 20.12 | $ 41,840 |
| Pennsylvania | 1,210 | 0.22 | 1.87 | $ 18.19 | $ 37,830 |
| Florida | 1,060 | 0.12 | 1.06 | $ 19.78 | $ 41,140 |
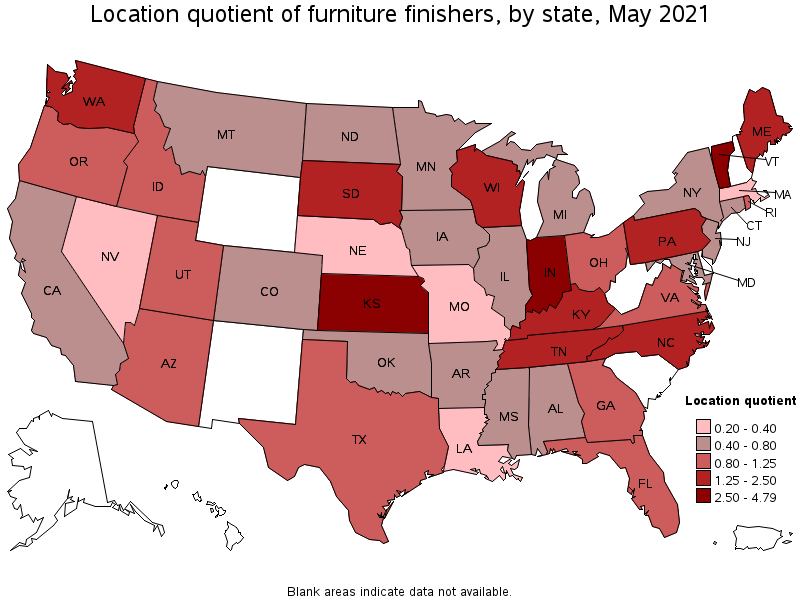
States with the highest concentration of jobs and location quotients in Furniture Finishers:
| State | Employment (1) | Employment per thousand jobs | Location quotient (9) | Hourly mean wage | Annual mean wage (2) |
|---|---|---|---|---|---|
| Kansas | 740 | 0.55 | 4.79 | $ 15.67 | $ 32,600 |
| Indiana | 1,450 | 0.49 | 4.21 | $ 17.52 | $ 36,440 |
| Vermont | 110 | 0.40 | 3.46 | $ 18.25 | $ 37,950 |
| South Dakota | 120 | 0.28 | 2.40 | $ 14.12 | $ 29,380 |
| Tennessee | 670 | 0.23 | 1.95 | $ 14.50 | $ 30,150 |
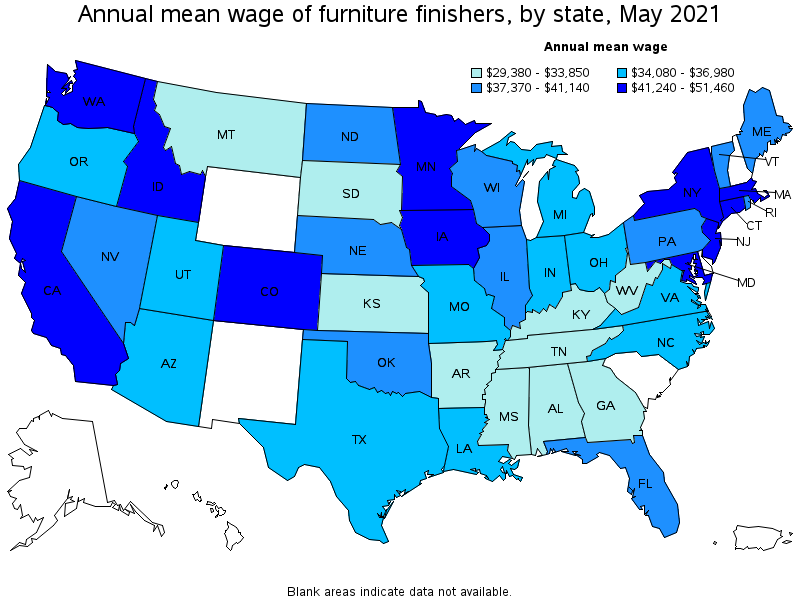
Top paying states for Furniture Finishers:
| State | Employment (1) | Employment per thousand jobs | Location quotient (9) | Hourly mean wage | Annual mean wage (2) |
|---|---|---|---|---|---|
| Massachusetts | 150 | 0.04 | 0.37 | $ 24.74 | $ 51,460 |
| New Jersey | 240 | 0.06 | 0.54 | $ 21.10 | $ 43,880 |
| Maryland | 130 | 0.05 | 0.42 | $ 21.01 | $ 43,700 |
| Connecticut | 70 | 0.05 | 0.40 | $ 20.43 | $ 42,500 |
| Colorado | 160 | 0.06 | 0.54 | $ 20.16 | $ 41,940 |
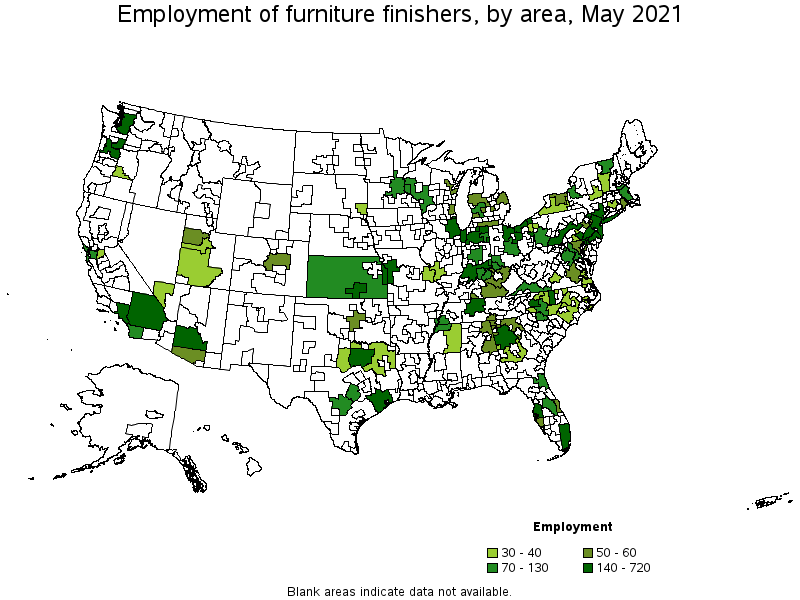
Metropolitan areas with the highest employment level in Furniture Finishers:
| Metropolitan area | Employment (1) | Employment per thousand jobs | Location quotient (9) | Hourly mean wage | Annual mean wage (2) |
|---|---|---|---|---|---|
| Los Angeles-Long Beach-Anaheim, CA | 720 | 0.13 | 1.09 | $ 19.72 | $ 41,010 |
| New York-Newark-Jersey City, NY-NJ-PA | 660 | 0.08 | 0.66 | $ 21.28 | $ 44,260 |
| Dallas-Fort Worth-Arlington, TX | 590 | 0.17 | 1.43 | $ 17.50 | $ 36,410 |
| Miami-Fort Lauderdale-West Palm Beach, FL | 430 | 0.18 | 1.53 | $ 19.93 | $ 41,450 |
| Elkhart-Goshen, IN | 390 | 2.88 | 24.91 | $ 18.29 | $ 38,040 |
| Kansas City, MO-KS | 380 | 0.38 | 3.26 | $ 16.21 | $ 33,720 |
| Hickory-Lenoir-Morganton, NC | 380 | 2.57 | 22.24 | $ 16.38 | $ 34,080 |
| Houston-The Woodlands-Sugar Land, TX | 350 | 0.12 | 1.06 | $ 17.33 | $ 36,040 |
| Phoenix-Mesa-Scottsdale, AZ | 300 | 0.14 | 1.22 | $ 17.61 | $ 36,630 |
| Seattle-Tacoma-Bellevue, WA | 280 | 0.15 | 1.26 | $ 21.75 | $ 45,230 |
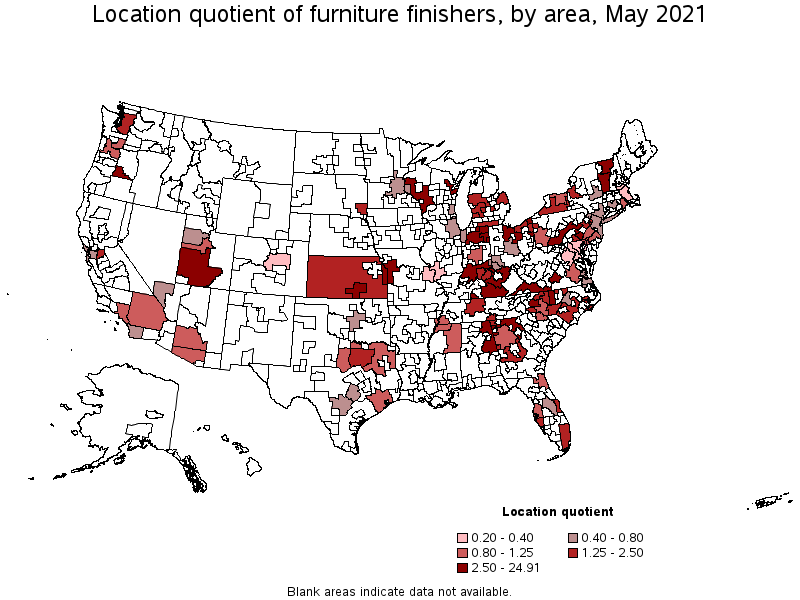
Metropolitan areas with the highest concentration of jobs and location quotients in Furniture Finishers:
| Metropolitan area | Employment (1) | Employment per thousand jobs | Location quotient (9) | Hourly mean wage | Annual mean wage (2) |
|---|---|---|---|---|---|
| Elkhart-Goshen, IN | 390 | 2.88 | 24.91 | $ 18.29 | $ 38,040 |
| Hickory-Lenoir-Morganton, NC | 380 | 2.57 | 22.24 | $ 16.38 | $ 34,080 |
| Lancaster, PA | 210 | 0.91 | 7.87 | $ 18.62 | $ 38,720 |
| Lebanon, PA | 40 | 0.83 | 7.18 | $ 16.75 | $ 34,840 |
| Greensboro-High Point, NC | 190 | 0.56 | 4.87 | $ 16.72 | $ 34,770 |
| Wichita, KS | 140 | 0.48 | 4.18 | $ 15.61 | $ 32,460 |
| Bend-Redmond, OR | 30 | 0.39 | 3.38 | $ 18.00 | $ 37,450 |
| Green Bay, WI | 60 | 0.38 | 3.29 | $ 18.60 | $ 38,690 |
| Kansas City, MO-KS | 380 | 0.38 | 3.26 | $ 16.21 | $ 33,720 |
| Fort Wayne, IN | 80 | 0.37 | 3.21 | $ 16.77 | $ 34,890 |
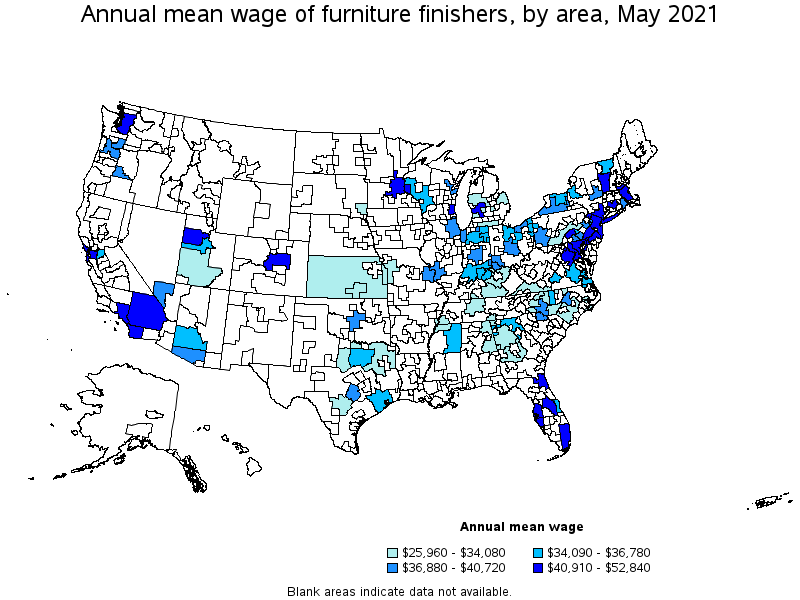
Top paying metropolitan areas for Furniture Finishers:
| Metropolitan area | Employment (1) | Employment per thousand jobs | Location quotient (9) | Hourly mean wage | Annual mean wage (2) |
|---|---|---|---|---|---|
| Boston-Cambridge-Nashua, MA-NH | 110 | 0.04 | 0.38 | $ 25.40 | $ 52,840 |
| San Francisco-Oakland-Hayward, CA | 120 | 0.05 | 0.46 | $ 23.78 | $ 49,460 |
| Seattle-Tacoma-Bellevue, WA | 280 | 0.15 | 1.26 | $ 21.75 | $ 45,230 |
| Harrisburg-Carlisle, PA | (8) | (8) | (8) | $ 21.73 | $ 45,190 |
| Washington-Arlington-Alexandria, DC-VA-MD-WV | 120 | 0.04 | 0.34 | $ 21.66 | $ 45,050 |
| Salt Lake City, UT | 50 | 0.07 | 0.58 | $ 21.55 | $ 44,830 |
| Tampa-St. Petersburg-Clearwater, FL | 140 | 0.11 | 0.95 | $ 21.42 | $ 44,550 |
| New York-Newark-Jersey City, NY-NJ-PA | 660 | 0.08 | 0.66 | $ 21.28 | $ 44,260 |
| Milwaukee-Waukesha-West Allis, WI | 60 | 0.07 | 0.61 | $ 21.05 | $ 43,780 |
| Hartford-West Hartford-East Hartford, CT | 30 | 0.06 | 0.48 | $ 20.77 | $ 43,190 |
Nonmetropolitan areas with the highest employment in Furniture Finishers:
| Nonmetropolitan area | Employment (1) | Employment per thousand jobs | Location quotient (9) | Hourly mean wage | Annual mean wage (2) |
|---|---|---|---|---|---|
| Southern Indiana nonmetropolitan area | 450 | 2.47 | 21.31 | $ 17.11 | $ 35,580 |
| Southern Pennsylvania nonmetropolitan area | 270 | 1.48 | 12.81 | $ 16.00 | $ 33,290 |
| Northern Indiana nonmetropolitan area | 160 | 0.78 | 6.70 | $ 17.26 | $ 35,900 |
| North Northeastern Ohio nonmetropolitan area (noncontiguous) | 140 | 0.46 | 3.97 | $ 16.74 | $ 34,820 |
| Western Wisconsin nonmetropolitan area | 120 | 0.93 | 8.05 | $ 16.56 | $ 34,450 |
Nonmetropolitan areas with the highest concentration of jobs and location quotients in Furniture Finishers:
| Nonmetropolitan area | Employment (1) | Employment per thousand jobs | Location quotient (9) | Hourly mean wage | Annual mean wage (2) |
|---|---|---|---|---|---|
| Southern Indiana nonmetropolitan area | 450 | 2.47 | 21.31 | $ 17.11 | $ 35,580 |
| Southern Pennsylvania nonmetropolitan area | 270 | 1.48 | 12.81 | $ 16.00 | $ 33,290 |
| Northern Vermont nonmetropolitan area | 70 | 1.02 | 8.82 | $ 16.66 | $ 34,660 |
| Western Wisconsin nonmetropolitan area | 120 | 0.93 | 8.05 | $ 16.56 | $ 34,450 |
| Southwest Virginia nonmetropolitan area | 90 | 0.80 | 6.91 | $ 13.93 | $ 28,970 |
Top paying nonmetropolitan areas for Furniture Finishers:
| Nonmetropolitan area | Employment (1) | Employment per thousand jobs | Location quotient (9) | Hourly mean wage | Annual mean wage (2) |
|---|---|---|---|---|---|
| Southern Vermont nonmetropolitan area | 40 | 0.45 | 3.88 | $ 20.78 | $ 43,230 |
| Southwest New York nonmetropolitan area | 40 | 0.27 | 2.31 | $ 18.20 | $ 37,860 |
| Northeast Mississippi nonmetropolitan area | 30 | 0.14 | 1.20 | $ 17.47 | $ 36,340 |
| Northern Indiana nonmetropolitan area | 160 | 0.78 | 6.70 | $ 17.26 | $ 35,900 |
| Southern Indiana nonmetropolitan area | 450 | 2.47 | 21.31 | $ 17.11 | $ 35,580 |
These estimates are calculated with data collected from employers in all industry sectors, all metropolitan and nonmetropolitan areas, and all states and the District of Columbia. The top employment and wage figures are provided above. The complete list is available in the downloadable XLS files.
The percentile wage estimate is the value of a wage below which a certain percent of workers fall. The median wage is the 50th percentile wage estimate—50 percent of workers earn less than the median and 50 percent of workers earn more than the median. More about percentile wages.
(1) Estimates for detailed occupations do not sum to the totals because the totals include occupations not shown separately. Estimates do not include self-employed workers.
(2) Annual wages have been calculated by multiplying the hourly mean wage by a "year-round, full-time" hours figure of 2,080 hours; for those occupations where there is not an hourly wage published, the annual wage has been directly calculated from the reported survey data.
(3) The relative standard error (RSE) is a measure of the reliability of a survey statistic. The smaller the relative standard error, the more precise the estimate.
(8) Estimate not released.
(9) The location quotient is the ratio of the area concentration of occupational employment to the national average concentration. A location quotient greater than one indicates the occupation has a higher share of employment than average, and a location quotient less than one indicates the occupation is less prevalent in the area than average.
Other OEWS estimates and related information:
May 2021 National Occupational Employment and Wage Estimates
May 2021 State Occupational Employment and Wage Estimates
May 2021 Metropolitan and Nonmetropolitan Area Occupational Employment and Wage Estimates
May 2021 National Industry-Specific Occupational Employment and Wage Estimates
Last Modified Date: March 31, 2022