
An official website of the United States government
An official website of the United States government
The .gov means it's official.
Federal government websites often end in .gov or .mil. Before sharing sensitive information,
make sure you're on a federal government site.
The site is secure.
The
https:// ensures that you are connecting to the official website and that any
information you provide is encrypted and transmitted securely.
Control, operate, or maintain machinery to generate electric power. Includes auxiliary equipment operators. Excludes �Nuclear Power Reactor Operators� (51-8011).
Employment estimate and mean wage estimates for Power Plant Operators:
| Employment (1) | Employment RSE (3) |
Mean hourly wage |
Mean annual wage (2) |
Wage RSE (3) |
|---|---|---|---|---|
| 28,960 | 1.8 % | $ 40.26 | $ 83,740 | 0.6 % |
Percentile wage estimates for Power Plant Operators:
| Percentile | 10% | 25% | 50% (Median) |
75% | 90% |
|---|---|---|---|---|---|
| Hourly Wage | $ 23.37 | $ 30.23 | $ 38.87 | $ 48.24 | $ 53.17 |
| Annual Wage (2) | $ 48,610 | $ 62,890 | $ 80,850 | $ 100,340 | $ 110,590 |
Industries with the highest published employment and wages for Power Plant Operators are provided. For a list of all industries with employment in Power Plant Operators, see the Create Customized Tables function.
Industries with the highest levels of employment in Power Plant Operators:
| Industry | Employment (1) | Percent of industry employment | Hourly mean wage | Annual mean wage (2) |
|---|---|---|---|---|
| Electric Power Generation, Transmission and Distribution | 20,010 | 5.32 | $ 41.31 | $ 85,920 |
| Local Government, excluding schools and hospitals (OEWS Designation) | 3,590 | 0.07 | $ 37.12 | $ 77,200 |
| Colleges, Universities, and Professional Schools | 780 | 0.03 | $ 27.30 | $ 56,780 |
| Natural Gas Distribution | 750 | 0.69 | $ 56.80 | $ 118,140 |
| State Government, excluding schools and hospitals (OEWS Designation) | 670 | 0.03 | $ 36.48 | $ 75,870 |
Industries with the highest concentration of employment in Power Plant Operators:
| Industry | Employment (1) | Percent of industry employment | Hourly mean wage | Annual mean wage (2) |
|---|---|---|---|---|
| Electric Power Generation, Transmission and Distribution | 20,010 | 5.32 | $ 41.31 | $ 85,920 |
| Natural Gas Distribution | 750 | 0.69 | $ 56.80 | $ 118,140 |
| Pulp, Paper, and Paperboard Mills | 200 | 0.23 | $ 35.75 | $ 74,370 |
| Water, Sewage and Other Systems | 70 | 0.13 | $ 32.90 | $ 68,440 |
| Metal Ore Mining | 40 | 0.09 | $ 43.74 | $ 90,970 |
Top paying industries for Power Plant Operators:
| Industry | Employment (1) | Percent of industry employment | Hourly mean wage | Annual mean wage (2) |
|---|---|---|---|---|
| Natural Gas Distribution | 750 | 0.69 | $ 56.80 | $ 118,140 |
| Federal Executive Branch (OEWS Designation) | 630 | 0.03 | $ 47.15 | $ 98,070 |
| Metal Ore Mining | 40 | 0.09 | $ 43.74 | $ 90,970 |
| Electric Power Generation, Transmission and Distribution | 20,010 | 5.32 | $ 41.31 | $ 85,920 |
| Architectural, Engineering, and Related Services | 300 | 0.02 | $ 40.21 | $ 83,650 |
States and areas with the highest published employment, location quotients, and wages for Power Plant Operators are provided. For a list of all areas with employment in Power Plant Operators, see the Create Customized Tables function.
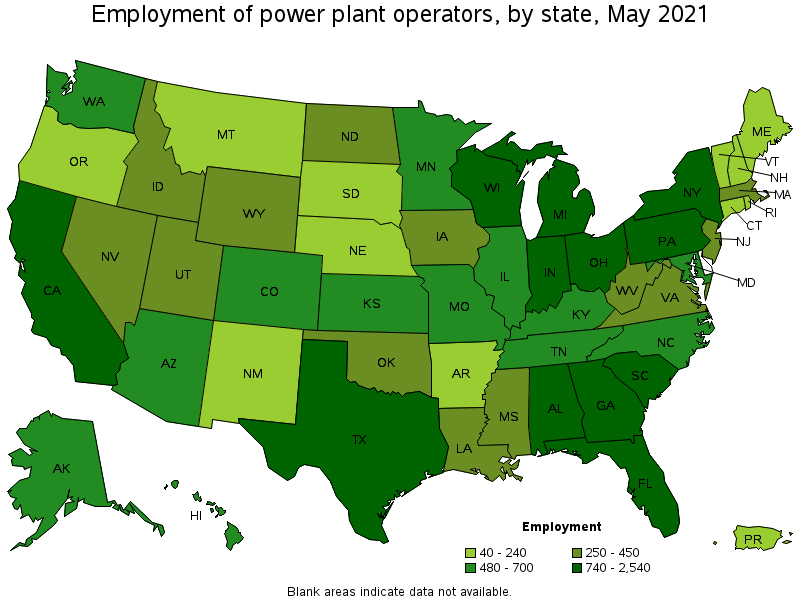
States with the highest employment level in Power Plant Operators:
| State | Employment (1) | Employment per thousand jobs | Location quotient (9) | Hourly mean wage | Annual mean wage (2) |
|---|---|---|---|---|---|
| California | 2,540 | 0.15 | 0.75 | $ 47.53 | $ 98,860 |
| New York | 1,870 | 0.22 | 1.05 | $ 44.92 | $ 93,430 |
| Michigan | 1,410 | 0.35 | 1.69 | $ 42.13 | $ 87,630 |
| Indiana | 1,320 | 0.44 | 2.15 | $ 40.39 | $ 84,010 |
| Pennsylvania | 1,320 | 0.24 | 1.15 | $ 38.37 | $ 79,820 |
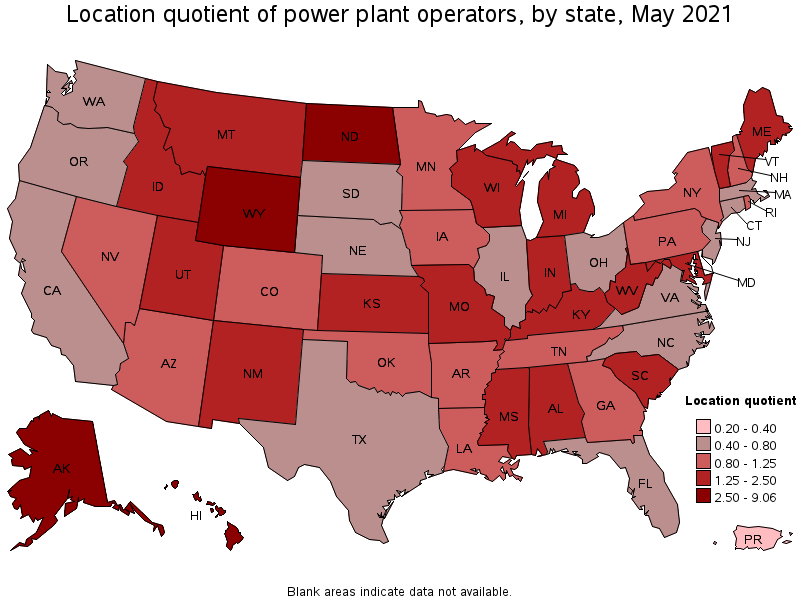
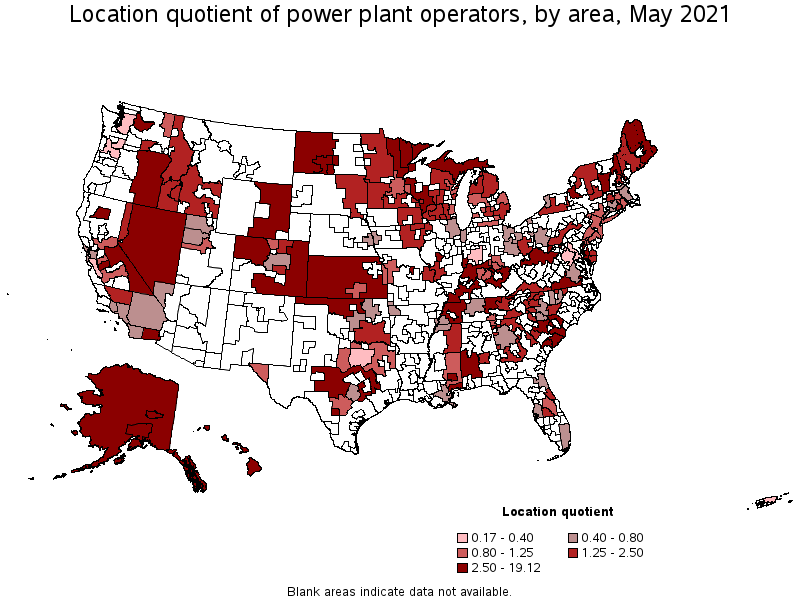
States with the highest concentration of jobs and location quotients in Power Plant Operators:
| State | Employment (1) | Employment per thousand jobs | Location quotient (9) | Hourly mean wage | Annual mean wage (2) |
|---|---|---|---|---|---|
| Alaska | 550 | 1.86 | 9.06 | $ 36.72 | $ 76,390 |
| North Dakota | 440 | 1.12 | 5.45 | $ 43.87 | $ 91,240 |
| Hawaii | 550 | 1.00 | 4.87 | $ 44.08 | $ 91,680 |
| Wyoming | 250 | 0.97 | 4.74 | $ 40.77 | $ 84,800 |
| West Virginia | 310 | 0.47 | 2.29 | $ 36.55 | $ 76,020 |
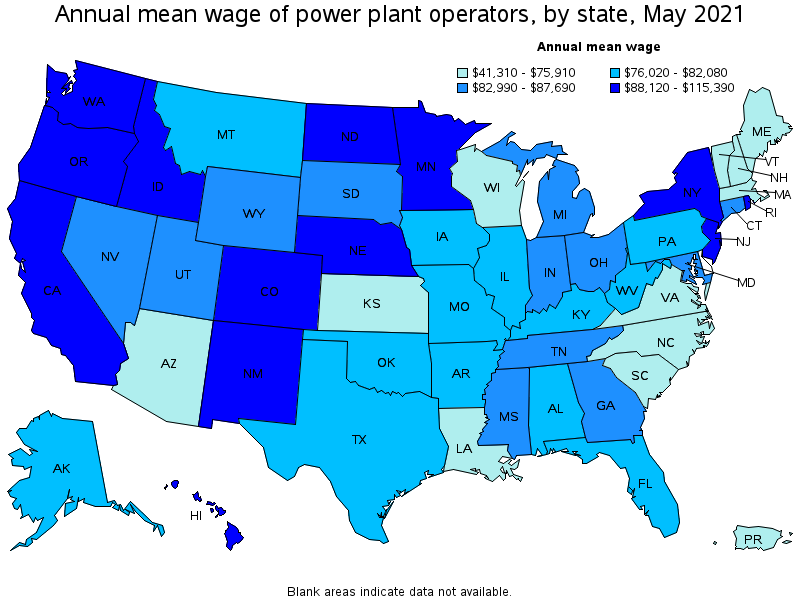
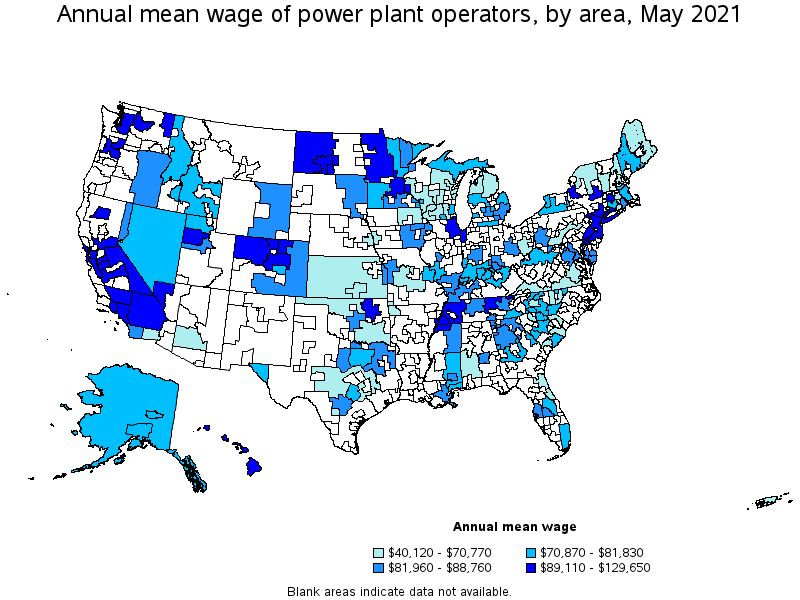
Top paying states for Power Plant Operators:
| State | Employment (1) | Employment per thousand jobs | Location quotient (9) | Hourly mean wage | Annual mean wage (2) |
|---|---|---|---|---|---|
| Washington | 480 | 0.15 | 0.73 | $ 55.48 | $ 115,390 |
| California | 2,540 | 0.15 | 0.75 | $ 47.53 | $ 98,860 |
| New Jersey | 450 | 0.12 | 0.57 | $ 45.29 | $ 94,190 |
| New York | 1,870 | 0.22 | 1.05 | $ 44.92 | $ 93,430 |
| New Mexico | 200 | 0.26 | 1.26 | $ 44.56 | $ 92,680 |
Metropolitan areas with the highest employment level in Power Plant Operators:
| Metropolitan area | Employment (1) | Employment per thousand jobs | Location quotient (9) | Hourly mean wage | Annual mean wage (2) |
|---|---|---|---|---|---|
| New York-Newark-Jersey City, NY-NJ-PA | 1,420 | 0.16 | 0.80 | $ 47.47 | $ 98,730 |
| Los Angeles-Long Beach-Anaheim, CA | 640 | 0.11 | 0.55 | $ 45.13 | $ 93,870 |
| Chicago-Naperville-Elgin, IL-IN-WI | 620 | 0.15 | 0.71 | $ 45.08 | $ 93,770 |
| Detroit-Warren-Dearborn, MI | 490 | 0.27 | 1.31 | $ 42.25 | $ 87,870 |
| Philadelphia-Camden-Wilmington, PA-NJ-DE-MD | 470 | 0.18 | 0.87 | $ 43.06 | $ 89,560 |
| Atlanta-Sandy Springs-Roswell, GA | 420 | 0.16 | 0.79 | $ 42.56 | $ 88,530 |
| Urban Honolulu, HI | 380 | 0.96 | 4.68 | $ 43.32 | $ 90,100 |
| Minneapolis-St. Paul-Bloomington, MN-WI | 340 | 0.19 | 0.92 | $ 43.35 | $ 90,170 |
| St. Louis, MO-IL | 330 | 0.26 | 1.25 | $ 37.62 | $ 78,250 |
| Miami-Fort Lauderdale-West Palm Beach, FL | 300 | 0.12 | 0.59 | $ 36.49 | $ 75,910 |
Metropolitan areas with the highest concentration of jobs and location quotients in Power Plant Operators:
| Metropolitan area | Employment (1) | Employment per thousand jobs | Location quotient (9) | Hourly mean wage | Annual mean wage (2) |
|---|---|---|---|---|---|
| El Centro, CA | 130 | 2.23 | 10.86 | $ 32.82 | $ 68,270 |
| Fairbanks, AK | 70 | 1.99 | 9.70 | $ 38.50 | $ 80,080 |
| Bismarck, ND | 130 | 1.88 | 9.13 | $ 43.96 | $ 91,440 |
| Wenatchee, WA | 70 | 1.41 | 6.86 | $ 59.22 | $ 123,180 |
| Terre Haute, IN | 80 | 1.30 | 6.31 | $ 38.37 | $ 79,810 |
| Urban Honolulu, HI | 380 | 0.96 | 4.68 | $ 43.32 | $ 90,100 |
| Redding, CA | 60 | 0.92 | 4.48 | $ 51.77 | $ 107,680 |
| Springfield, IL | 80 | 0.84 | 4.07 | $ 41.90 | $ 87,160 |
| Kahului-Wailuku-Lahaina, HI | 50 | 0.81 | 3.94 | $ 48.56 | $ 101,000 |
| Hattiesburg, MS | 50 | 0.79 | 3.86 | $ 41.71 | $ 86,750 |
Top paying metropolitan areas for Power Plant Operators:
| Metropolitan area | Employment (1) | Employment per thousand jobs | Location quotient (9) | Hourly mean wage | Annual mean wage (2) |
|---|---|---|---|---|---|
| Fresno, CA | 90 | 0.25 | 1.22 | $ 62.33 | $ 129,650 |
| Wenatchee, WA | 70 | 1.41 | 6.86 | $ 59.22 | $ 123,180 |
| Sacramento--Roseville--Arden-Arcade, CA | 220 | 0.22 | 1.07 | $ 55.13 | $ 114,660 |
| Seattle-Tacoma-Bellevue, WA | 110 | 0.06 | 0.29 | $ 53.17 | $ 110,600 |
| Redding, CA | 60 | 0.92 | 4.48 | $ 51.77 | $ 107,680 |
| San Francisco-Oakland-Hayward, CA | 280 | 0.13 | 0.62 | $ 50.68 | $ 105,420 |
| Modesto, CA | 30 | 0.17 | 0.83 | $ 50.68 | $ 105,410 |
| Memphis, TN-MS-AR | 70 | 0.12 | 0.56 | $ 49.80 | $ 103,580 |
| Merced, CA | 40 | 0.60 | 2.91 | $ 49.12 | $ 102,170 |
| Oxnard-Thousand Oaks-Ventura, CA | 30 | 0.11 | 0.51 | $ 48.62 | $ 101,120 |
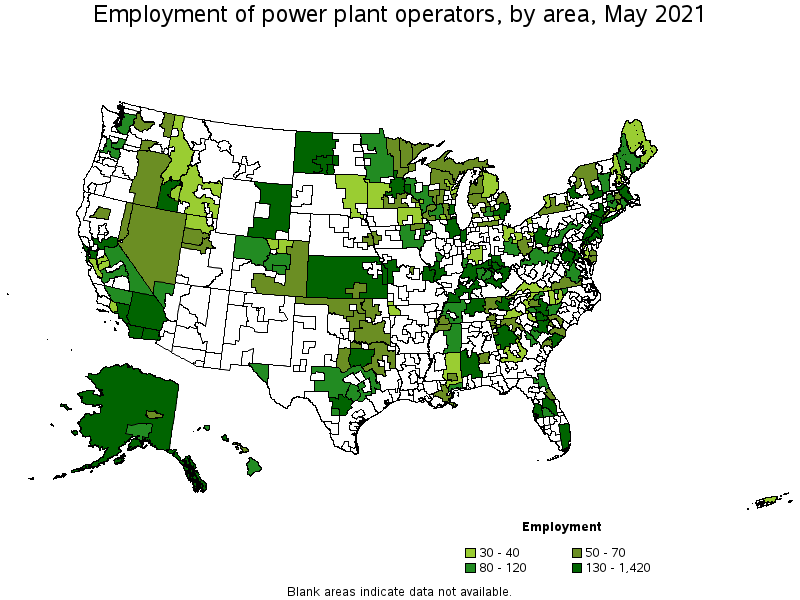
Nonmetropolitan areas with the highest employment in Power Plant Operators:
| Nonmetropolitan area | Employment (1) | Employment per thousand jobs | Location quotient (9) | Hourly mean wage | Annual mean wage (2) |
|---|---|---|---|---|---|
| Southern Indiana nonmetropolitan area | 440 | 2.38 | 11.58 | $ 38.60 | $ 80,290 |
| Alaska nonmetropolitan area | 380 | 3.93 | 19.12 | $ 35.97 | $ 74,810 |
| West North Dakota nonmetropolitan area | 260 | 2.48 | 12.05 | $ 45.97 | $ 95,610 |
| Kansas nonmetropolitan area | 220 | 0.59 | 2.86 | $ 28.64 | $ 59,560 |
| Central Kentucky nonmetropolitan area | 220 | 1.27 | 6.19 | $ 37.52 | $ 78,040 |
Nonmetropolitan areas with the highest concentration of jobs and location quotients in Power Plant Operators:
| Nonmetropolitan area | Employment (1) | Employment per thousand jobs | Location quotient (9) | Hourly mean wage | Annual mean wage (2) |
|---|---|---|---|---|---|
| Alaska nonmetropolitan area | 380 | 3.93 | 19.12 | $ 35.97 | $ 74,810 |
| Southwest Alabama nonmetropolitan area | 190 | 3.07 | 14.93 | $ 33.16 | $ 68,970 |
| West North Dakota nonmetropolitan area | 260 | 2.48 | 12.05 | $ 45.97 | $ 95,610 |
| Southern Indiana nonmetropolitan area | 440 | 2.38 | 11.58 | $ 38.60 | $ 80,290 |
| Eastern Wyoming nonmetropolitan area | 160 | 2.06 | 10.04 | $ 41.16 | $ 85,620 |
Top paying nonmetropolitan areas for Power Plant Operators:
| Nonmetropolitan area | Employment (1) | Employment per thousand jobs | Location quotient (9) | Hourly mean wage | Annual mean wage (2) |
|---|---|---|---|---|---|
| Eastern Sierra-Mother Lode Region of California nonmetropolitan area | 90 | 1.49 | 7.26 | $ 49.13 | $ 102,190 |
| West North Dakota nonmetropolitan area | 260 | 2.48 | 12.05 | $ 45.97 | $ 95,610 |
| West Tennessee nonmetropolitan area | 80 | 0.64 | 3.10 | $ 45.40 | $ 94,440 |
| Northwest Colorado nonmetropolitan area | 120 | 1.01 | 4.92 | $ 45.05 | $ 93,710 |
| Hawaii / Kauai nonmetropolitan area | 120 | 1.32 | 6.42 | $ 44.56 | $ 92,690 |
These estimates are calculated with data collected from employers in all industry sectors, all metropolitan and nonmetropolitan areas, and all states and the District of Columbia. The top employment and wage figures are provided above. The complete list is available in the downloadable XLS files.
The percentile wage estimate is the value of a wage below which a certain percent of workers fall. The median wage is the 50th percentile wage estimate—50 percent of workers earn less than the median and 50 percent of workers earn more than the median. More about percentile wages.
(1) Estimates for detailed occupations do not sum to the totals because the totals include occupations not shown separately. Estimates do not include self-employed workers.
(2) Annual wages have been calculated by multiplying the hourly mean wage by a "year-round, full-time" hours figure of 2,080 hours; for those occupations where there is not an hourly wage published, the annual wage has been directly calculated from the reported survey data.
(3) The relative standard error (RSE) is a measure of the reliability of a survey statistic. The smaller the relative standard error, the more precise the estimate.
(9) The location quotient is the ratio of the area concentration of occupational employment to the national average concentration. A location quotient greater than one indicates the occupation has a higher share of employment than average, and a location quotient less than one indicates the occupation is less prevalent in the area than average.
Other OEWS estimates and related information:
May 2021 National Occupational Employment and Wage Estimates
May 2021 State Occupational Employment and Wage Estimates
May 2021 Metropolitan and Nonmetropolitan Area Occupational Employment and Wage Estimates
May 2021 National Industry-Specific Occupational Employment and Wage Estimates
Last Modified Date: March 31, 2022