
An official website of the United States government
An official website of the United States government
The .gov means it's official.
Federal government websites often end in .gov or .mil. Before sharing sensitive information,
make sure you're on a federal government site.
The site is secure.
The
https:// ensures that you are connecting to the official website and that any
information you provide is encrypted and transmitted securely.
Inspect, test, sort, sample, or weigh nonagricultural raw materials or processed, machined, fabricated, or assembled parts or products for defects, wear, and deviations from specifications. May use precision measuring instruments and complex test equipment.
Employment estimate and mean wage estimates for Inspectors, Testers, Sorters, Samplers, and Weighers:
| Employment (1) | Employment RSE (3) |
Mean hourly wage |
Mean annual wage (2) |
Wage RSE (3) |
|---|---|---|---|---|
| 551,380 | 0.8 % | $ 21.54 | $ 44,810 | 0.3 % |
Percentile wage estimates for Inspectors, Testers, Sorters, Samplers, and Weighers:
| Percentile | 10% | 25% | 50% (Median) |
75% | 90% |
|---|---|---|---|---|---|
| Hourly Wage | $ 13.86 | $ 15.16 | $ 18.55 | $ 23.78 | $ 30.27 |
| Annual Wage (2) | $ 28,820 | $ 31,540 | $ 38,580 | $ 49,450 | $ 62,970 |
Industries with the highest published employment and wages for Inspectors, Testers, Sorters, Samplers, and Weighers are provided. For a list of all industries with employment in Inspectors, Testers, Sorters, Samplers, and Weighers, see the Create Customized Tables function.
Industries with the highest levels of employment in Inspectors, Testers, Sorters, Samplers, and Weighers:
| Industry | Employment (1) | Percent of industry employment | Hourly mean wage | Annual mean wage (2) |
|---|---|---|---|---|
| Employment Services | 39,830 | 1.14 | $ 16.27 | $ 33,830 |
| Plastics Product Manufacturing | 31,990 | 5.48 | $ 18.18 | $ 37,810 |
| Architectural, Engineering, and Related Services | 26,570 | 1.76 | $ 23.91 | $ 49,720 |
| Aerospace Product and Parts Manufacturing | 22,030 | 4.69 | $ 30.03 | $ 62,450 |
| Motor Vehicle Parts Manufacturing | 21,770 | 4.05 | $ 19.99 | $ 41,580 |
Industries with the highest concentration of employment in Inspectors, Testers, Sorters, Samplers, and Weighers:
| Industry | Employment (1) | Percent of industry employment | Hourly mean wage | Annual mean wage (2) |
|---|---|---|---|---|
| Apparel Knitting Mills | 610 | 7.74 | $ 13.03 | $ 27,100 |
| Foundries | 5,990 | 5.94 | $ 20.83 | $ 43,330 |
| Fabric Mills | 2,570 | 5.64 | $ 16.57 | $ 34,460 |
| Plastics Product Manufacturing | 31,990 | 5.48 | $ 18.18 | $ 37,810 |
| Pharmaceutical and Medicine Manufacturing | 16,460 | 5.24 | $ 24.89 | $ 51,760 |
Top paying industries for Inspectors, Testers, Sorters, Samplers, and Weighers:
| Industry | Employment (1) | Percent of industry employment | Hourly mean wage | Annual mean wage (2) |
|---|---|---|---|---|
| Scheduled Air Transportation | 230 | 0.06 | $ 44.63 | $ 92,840 |
| Electric Power Generation, Transmission and Distribution | 950 | 0.25 | $ 41.22 | $ 85,730 |
| Other Pipeline Transportation | 90 | 1.11 | $ 40.94 | $ 85,150 |
| Business, Professional, Labor, Political, and Similar Organizations | 170 | 0.04 | $ 39.09 | $ 81,310 |
| Pipeline Transportation of Crude Oil | 110 | 0.92 | $ 38.62 | $ 80,340 |
States and areas with the highest published employment, location quotients, and wages for Inspectors, Testers, Sorters, Samplers, and Weighers are provided. For a list of all areas with employment in Inspectors, Testers, Sorters, Samplers, and Weighers, see the Create Customized Tables function.
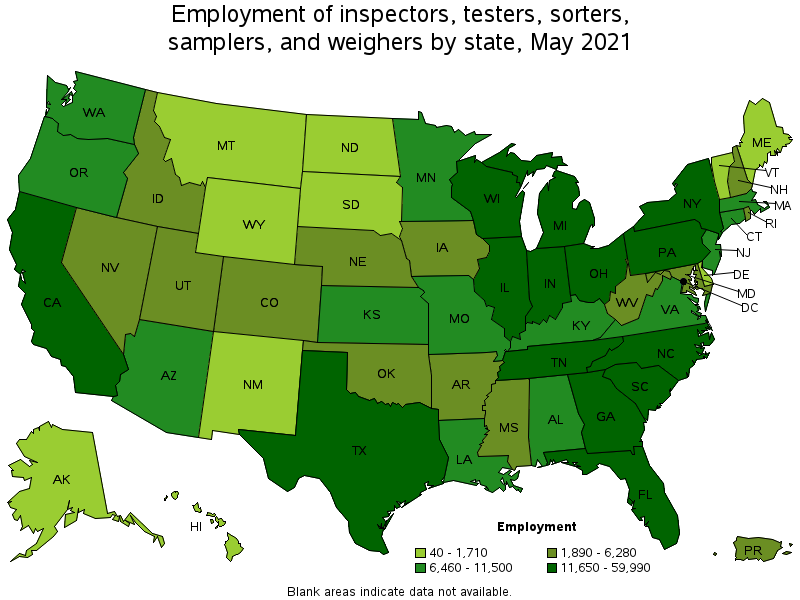
States with the highest employment level in Inspectors, Testers, Sorters, Samplers, and Weighers:
| State | Employment (1) | Employment per thousand jobs | Location quotient (9) | Hourly mean wage | Annual mean wage (2) |
|---|---|---|---|---|---|
| California | 59,990 | 3.63 | 0.93 | $ 22.73 | $ 47,280 |
| Texas | 47,720 | 3.90 | 1.00 | $ 20.77 | $ 43,200 |
| Ohio | 29,930 | 5.75 | 1.47 | $ 20.82 | $ 43,300 |
| Illinois | 29,390 | 5.23 | 1.34 | $ 21.08 | $ 43,850 |
| Michigan | 29,270 | 7.21 | 1.84 | $ 19.29 | $ 40,130 |
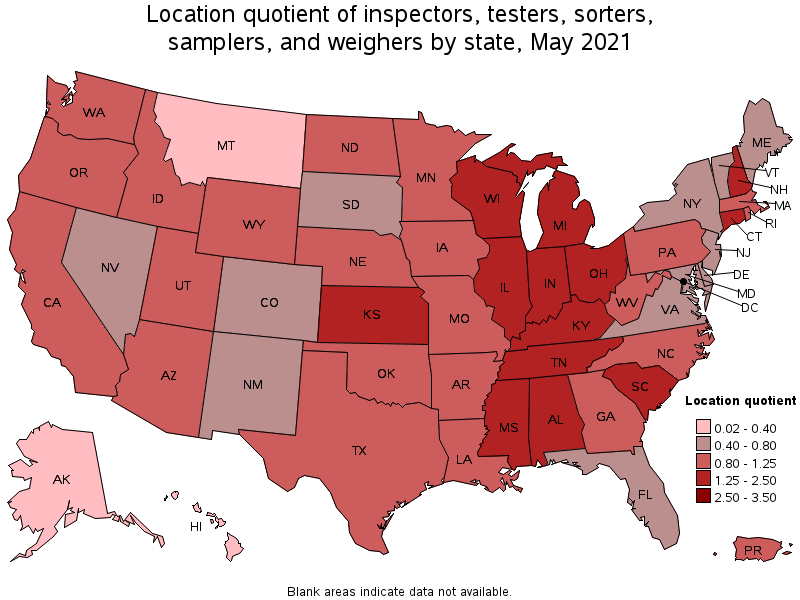
States with the highest concentration of jobs and location quotients in Inspectors, Testers, Sorters, Samplers, and Weighers:
| State | Employment (1) | Employment per thousand jobs | Location quotient (9) | Hourly mean wage | Annual mean wage (2) |
|---|---|---|---|---|---|
| Michigan | 29,270 | 7.21 | 1.84 | $ 19.29 | $ 40,130 |
| Indiana | 19,800 | 6.64 | 1.70 | $ 21.39 | $ 44,490 |
| Wisconsin | 18,270 | 6.63 | 1.69 | $ 20.42 | $ 42,470 |
| Alabama | 11,410 | 5.92 | 1.51 | $ 17.72 | $ 36,850 |
| Ohio | 29,930 | 5.75 | 1.47 | $ 20.82 | $ 43,300 |
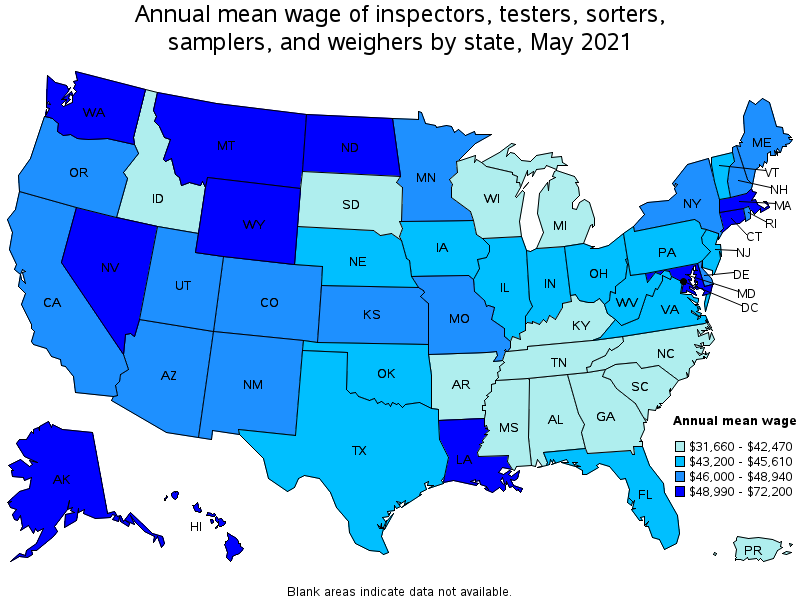
Top paying states for Inspectors, Testers, Sorters, Samplers, and Weighers:
| State | Employment (1) | Employment per thousand jobs | Location quotient (9) | Hourly mean wage | Annual mean wage (2) |
|---|---|---|---|---|---|
| Alaska | 200 | 0.66 | 0.17 | $ 34.71 | $ 72,200 |
| North Dakota | 1,710 | 4.33 | 1.11 | $ 33.18 | $ 69,010 |
| Washington | 11,500 | 3.59 | 0.92 | $ 28.91 | $ 60,130 |
| Hawaii | 320 | 0.59 | 0.15 | $ 27.58 | $ 57,370 |
| Wyoming | 870 | 3.34 | 0.85 | $ 26.22 | $ 54,530 |
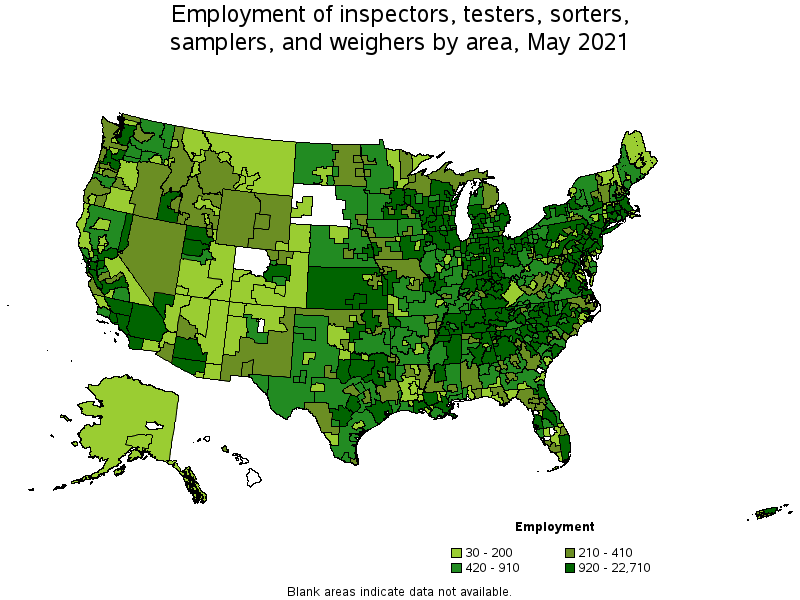
Metropolitan areas with the highest employment level in Inspectors, Testers, Sorters, Samplers, and Weighers:
| Metropolitan area | Employment (1) | Employment per thousand jobs | Location quotient (9) | Hourly mean wage | Annual mean wage (2) |
|---|---|---|---|---|---|
| Los Angeles-Long Beach-Anaheim, CA | 22,710 | 3.97 | 1.01 | $ 22.33 | $ 46,440 |
| Chicago-Naperville-Elgin, IL-IN-WI | 21,120 | 4.99 | 1.28 | $ 21.52 | $ 44,760 |
| New York-Newark-Jersey City, NY-NJ-PA | 15,770 | 1.82 | 0.46 | $ 22.83 | $ 47,490 |
| Dallas-Fort Worth-Arlington, TX | 14,870 | 4.14 | 1.06 | $ 19.86 | $ 41,300 |
| Houston-The Woodlands-Sugar Land, TX | 13,940 | 4.81 | 1.23 | $ 21.86 | $ 45,480 |
| Detroit-Warren-Dearborn, MI | 12,690 | 7.04 | 1.80 | $ 19.81 | $ 41,200 |
| Atlanta-Sandy Springs-Roswell, GA | 9,350 | 3.61 | 0.92 | $ 19.77 | $ 41,120 |
| Boston-Cambridge-Nashua, MA-NH | 8,040 | 3.11 | 0.79 | $ 25.96 | $ 53,990 |
| Seattle-Tacoma-Bellevue, WA | 7,620 | 3.97 | 1.02 | $ 31.86 | $ 66,260 |
| Phoenix-Mesa-Scottsdale, AZ | 7,360 | 3.48 | 0.89 | $ 22.89 | $ 47,600 |
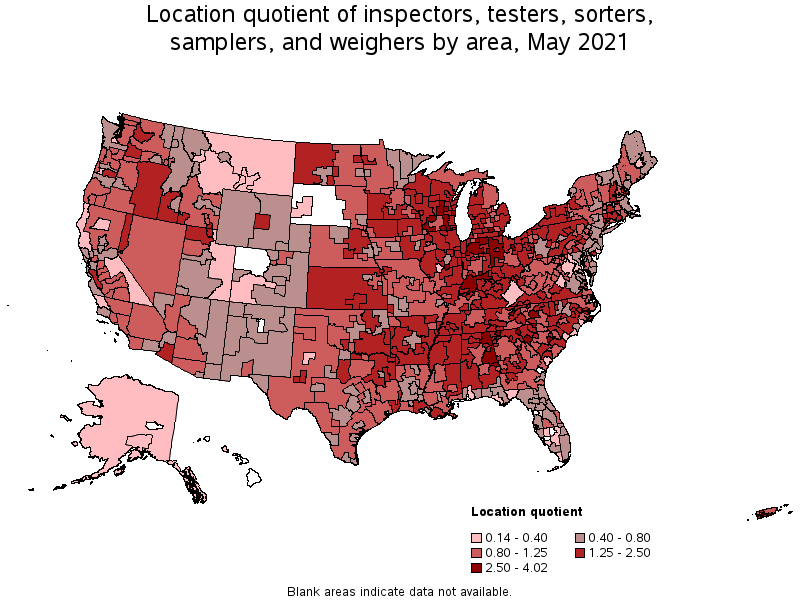
Metropolitan areas with the highest concentration of jobs and location quotients in Inspectors, Testers, Sorters, Samplers, and Weighers:
| Metropolitan area | Employment (1) | Employment per thousand jobs | Location quotient (9) | Hourly mean wage | Annual mean wage (2) |
|---|---|---|---|---|---|
| Dalton, GA | 980 | 15.73 | 4.02 | $ 17.41 | $ 36,210 |
| Morristown, TN | 670 | 14.86 | 3.80 | $ 16.36 | $ 34,020 |
| Elkhart-Goshen, IN | 1,980 | 14.84 | 3.79 | $ 20.94 | $ 43,550 |
| Sheboygan, WI | 830 | 14.33 | 3.66 | $ 20.10 | $ 41,800 |
| Janesville-Beloit, WI | 820 | 12.72 | 3.25 | $ 19.64 | $ 40,860 |
| Jackson, MI | 650 | 11.98 | 3.06 | $ 17.71 | $ 36,840 |
| Auburn-Opelika, AL | 700 | 11.88 | 3.03 | $ 14.73 | $ 30,640 |
| Columbus, IN | 560 | 11.54 | 2.95 | $ 20.25 | $ 42,130 |
| Hickory-Lenoir-Morganton, NC | 1,660 | 11.31 | 2.89 | $ 17.00 | $ 35,360 |
| Sumter, SC | 390 | 11.01 | 2.81 | $ 18.85 | $ 39,210 |
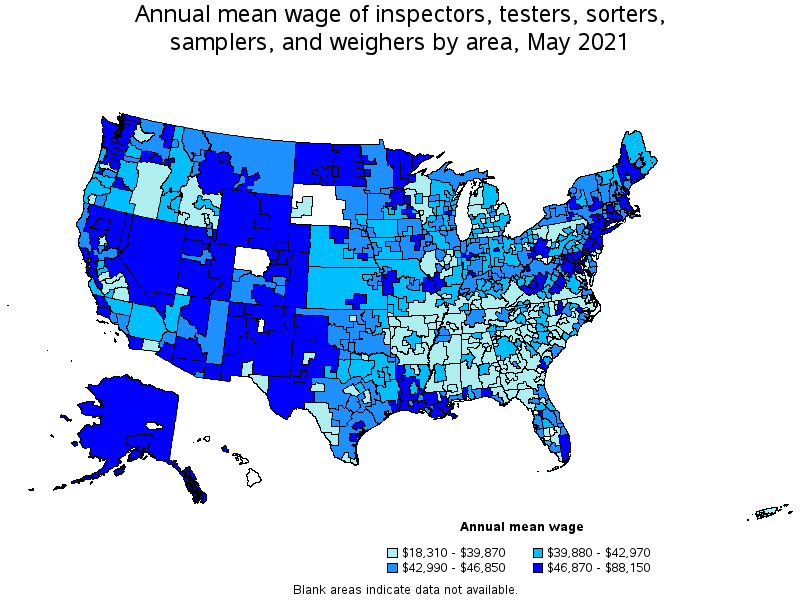
Top paying metropolitan areas for Inspectors, Testers, Sorters, Samplers, and Weighers:
| Metropolitan area | Employment (1) | Employment per thousand jobs | Location quotient (9) | Hourly mean wage | Annual mean wage (2) |
|---|---|---|---|---|---|
| Odessa, TX | 520 | 7.71 | 1.97 | $ 34.11 | $ 70,950 |
| Seattle-Tacoma-Bellevue, WA | 7,620 | 3.97 | 1.02 | $ 31.86 | $ 66,260 |
| Bismarck, ND | 140 | 1.96 | 0.50 | $ 31.22 | $ 64,940 |
| Anchorage, AK | 90 | 0.56 | 0.14 | $ 31.00 | $ 64,480 |
| Bridgeport-Stamford-Norwalk, CT | 1,440 | 3.84 | 0.98 | $ 30.94 | $ 64,360 |
| Bremerton-Silverdale, WA | 190 | 2.19 | 0.56 | $ 29.72 | $ 61,820 |
| California-Lexington Park, MD | 70 | 1.61 | 0.41 | $ 29.51 | $ 61,370 |
| Norwich-New London-Westerly, CT-RI | 690 | 6.01 | 1.53 | $ 28.28 | $ 58,820 |
| The Villages, FL | 30 | 0.95 | 0.24 | $ 28.13 | $ 58,500 |
| Mount Vernon-Anacortes, WA | 160 | 3.48 | 0.89 | $ 27.80 | $ 57,820 |
Nonmetropolitan areas with the highest employment in Inspectors, Testers, Sorters, Samplers, and Weighers:
| Nonmetropolitan area | Employment (1) | Employment per thousand jobs | Location quotient (9) | Hourly mean wage | Annual mean wage (2) |
|---|---|---|---|---|---|
| North Northeastern Ohio nonmetropolitan area (noncontiguous) | 2,840 | 9.04 | 2.31 | $ 20.28 | $ 42,180 |
| West Northwestern Ohio nonmetropolitan area | 2,680 | 11.20 | 2.86 | $ 20.19 | $ 42,000 |
| Northern Indiana nonmetropolitan area | 2,680 | 13.11 | 3.35 | $ 21.20 | $ 44,090 |
| Balance of Lower Peninsula of Michigan nonmetropolitan area | 2,350 | 9.31 | 2.38 | $ 18.88 | $ 39,280 |
| Southern Indiana nonmetropolitan area | 2,310 | 12.59 | 3.22 | $ 22.13 | $ 46,040 |
Nonmetropolitan areas with the highest concentration of jobs and location quotients in Inspectors, Testers, Sorters, Samplers, and Weighers:
| Nonmetropolitan area | Employment (1) | Employment per thousand jobs | Location quotient (9) | Hourly mean wage | Annual mean wage (2) |
|---|---|---|---|---|---|
| Northeast Alabama nonmetropolitan area | 2,170 | 15.30 | 3.91 | $ 15.30 | $ 31,820 |
| Northern Indiana nonmetropolitan area | 2,680 | 13.11 | 3.35 | $ 21.20 | $ 44,090 |
| Southern Indiana nonmetropolitan area | 2,310 | 12.59 | 3.22 | $ 22.13 | $ 46,040 |
| West Northwestern Ohio nonmetropolitan area | 2,680 | 11.20 | 2.86 | $ 20.19 | $ 42,000 |
| South Central Wisconsin nonmetropolitan area | 2,030 | 10.17 | 2.60 | $ 19.20 | $ 39,930 |
Top paying nonmetropolitan areas for Inspectors, Testers, Sorters, Samplers, and Weighers:
| Nonmetropolitan area | Employment (1) | Employment per thousand jobs | Location quotient (9) | Hourly mean wage | Annual mean wage (2) |
|---|---|---|---|---|---|
| West North Dakota nonmetropolitan area | 800 | 7.53 | 1.92 | $ 42.38 | $ 88,150 |
| Alaska nonmetropolitan area | 80 | 0.79 | 0.20 | $ 38.66 | $ 80,420 |
| Northern New Mexico nonmetropolitan area | 120 | 1.59 | 0.41 | $ 29.12 | $ 60,570 |
| Eastern Wyoming nonmetropolitan area | 230 | 2.87 | 0.73 | $ 27.15 | $ 56,470 |
| Western Wyoming nonmetropolitan area | 280 | 2.98 | 0.76 | $ 26.82 | $ 55,780 |
These estimates are calculated with data collected from employers in all industry sectors, all metropolitan and nonmetropolitan areas, and all states and the District of Columbia. The top employment and wage figures are provided above. The complete list is available in the downloadable XLS files.
The percentile wage estimate is the value of a wage below which a certain percent of workers fall. The median wage is the 50th percentile wage estimate—50 percent of workers earn less than the median and 50 percent of workers earn more than the median. More about percentile wages.
(1) Estimates for detailed occupations do not sum to the totals because the totals include occupations not shown separately. Estimates do not include self-employed workers.
(2) Annual wages have been calculated by multiplying the hourly mean wage by a "year-round, full-time" hours figure of 2,080 hours; for those occupations where there is not an hourly wage published, the annual wage has been directly calculated from the reported survey data.
(3) The relative standard error (RSE) is a measure of the reliability of a survey statistic. The smaller the relative standard error, the more precise the estimate.
(9) The location quotient is the ratio of the area concentration of occupational employment to the national average concentration. A location quotient greater than one indicates the occupation has a higher share of employment than average, and a location quotient less than one indicates the occupation is less prevalent in the area than average.
Other OEWS estimates and related information:
May 2021 National Occupational Employment and Wage Estimates
May 2021 State Occupational Employment and Wage Estimates
May 2021 Metropolitan and Nonmetropolitan Area Occupational Employment and Wage Estimates
May 2021 National Industry-Specific Occupational Employment and Wage Estimates
Last Modified Date: March 31, 2022