
An official website of the United States government
An official website of the United States government
The .gov means it's official.
Federal government websites often end in .gov or .mil. Before sharing sensitive information,
make sure you're on a federal government site.
The site is secure.
The
https:// ensures that you are connecting to the official website and that any
information you provide is encrypted and transmitted securely.
Design, fabricate, adjust, repair, or appraise jewelry, gold, silver, other precious metals, or gems. Includes diamond polishers and gem cutters, and persons who perform precision casting and modeling of molds, casting metal in molds, or setting precious and semiprecious stones for jewelry and related products.
Employment estimate and mean wage estimates for Jewelers and Precious Stone and Metal Workers:
| Employment (1) | Employment RSE (3) |
Mean hourly wage |
Mean annual wage (2) |
Wage RSE (3) |
|---|---|---|---|---|
| 24,350 | 3.7 % | $ 22.64 | $ 47,090 | 1.3 % |
Percentile wage estimates for Jewelers and Precious Stone and Metal Workers:
| Percentile | 10% | 25% | 50% (Median) |
75% | 90% |
|---|---|---|---|---|---|
| Hourly Wage | $ 13.00 | $ 17.06 | $ 22.42 | $ 28.01 | $ 33.15 |
| Annual Wage (2) | $ 27,030 | $ 35,490 | $ 46,640 | $ 58,260 | $ 68,960 |
Industries with the highest published employment and wages for Jewelers and Precious Stone and Metal Workers are provided. For a list of all industries with employment in Jewelers and Precious Stone and Metal Workers, see the Create Customized Tables function.
Industries with the highest levels of employment in Jewelers and Precious Stone and Metal Workers:
| Industry | Employment (1) | Percent of industry employment | Hourly mean wage | Annual mean wage (2) |
|---|---|---|---|---|
| Jewelry, Luggage, and Leather Goods Stores | 12,720 | 11.90 | $ 23.14 | $ 48,120 |
| Other Miscellaneous Manufacturing | 5,590 | 2.03 | $ 21.15 | $ 44,000 |
| Merchant Wholesalers, Durable Goods (4232, 4233, 4235, 4236, 4237, and 4239 only) | 2,110 | 0.15 | $ 24.67 | $ 51,310 |
| Electronic Shopping and Mail-Order Houses | 1,760 | 0.38 | $ 23.00 | $ 47,840 |
| Personal and Household Goods Repair and Maintenance | 810 | 1.06 | $ 19.63 | $ 40,840 |
Industries with the highest concentration of employment in Jewelers and Precious Stone and Metal Workers:
| Industry | Employment (1) | Percent of industry employment | Hourly mean wage | Annual mean wage (2) |
|---|---|---|---|---|
| Jewelry, Luggage, and Leather Goods Stores | 12,720 | 11.90 | $ 23.14 | $ 48,120 |
| Other Miscellaneous Manufacturing | 5,590 | 2.03 | $ 21.15 | $ 44,000 |
| Personal and Household Goods Repair and Maintenance | 810 | 1.06 | $ 19.63 | $ 40,840 |
| Electronic Shopping and Mail-Order Houses | 1,760 | 0.38 | $ 23.00 | $ 47,840 |
| Specialized Design Services | 240 | 0.17 | $ 17.39 | $ 36,160 |
Top paying industries for Jewelers and Precious Stone and Metal Workers:
| Industry | Employment (1) | Percent of industry employment | Hourly mean wage | Annual mean wage (2) |
|---|---|---|---|---|
| Nondepository Credit Intermediation | 160 | 0.03 | $ 30.26 | $ 62,950 |
| Management of Companies and Enterprises | (8) | (8) | $ 25.42 | $ 52,870 |
| Merchant Wholesalers, Durable Goods (4232, 4233, 4235, 4236, 4237, and 4239 only) | 2,110 | 0.15 | $ 24.67 | $ 51,310 |
| Jewelry, Luggage, and Leather Goods Stores | 12,720 | 11.90 | $ 23.14 | $ 48,120 |
| Electronic Shopping and Mail-Order Houses | 1,760 | 0.38 | $ 23.00 | $ 47,840 |
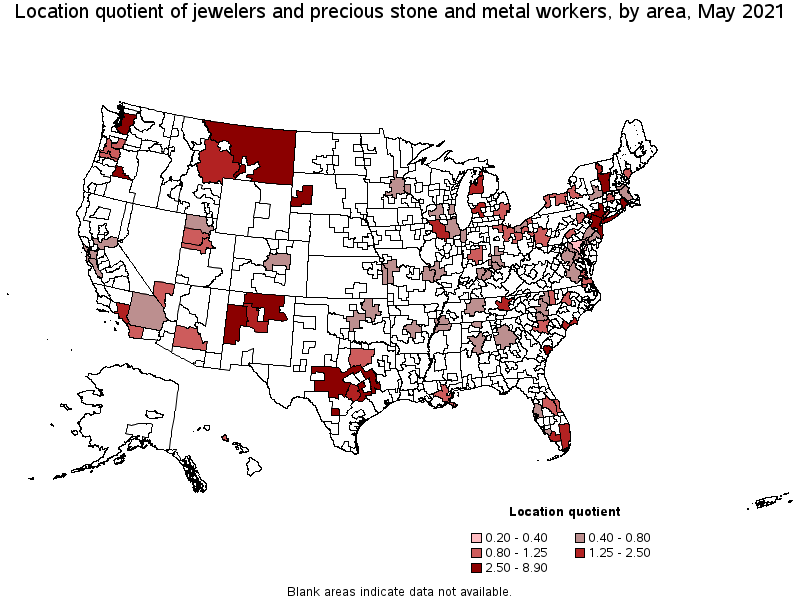
States and areas with the highest published employment, location quotients, and wages for Jewelers and Precious Stone and Metal Workers are provided. For a list of all areas with employment in Jewelers and Precious Stone and Metal Workers, see the Create Customized Tables function.
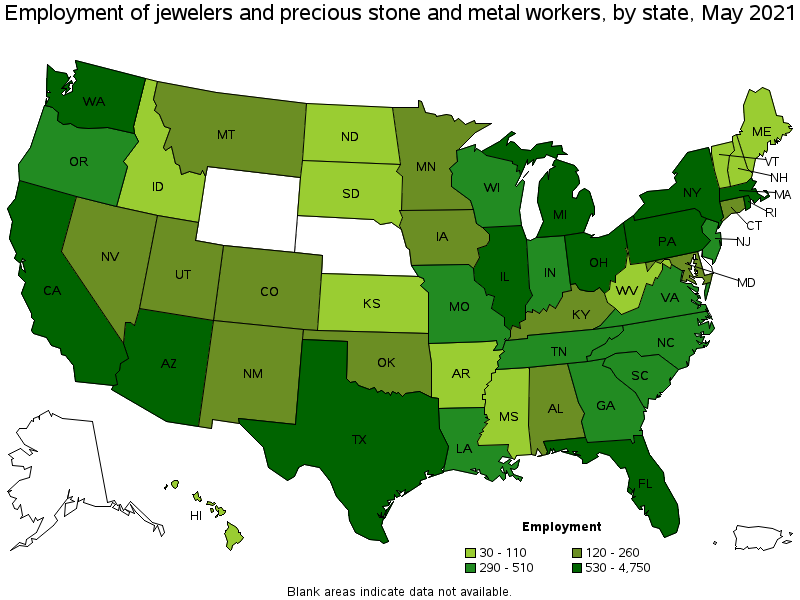
States with the highest employment level in Jewelers and Precious Stone and Metal Workers:
| State | Employment (1) | Employment per thousand jobs | Location quotient (9) | Hourly mean wage | Annual mean wage (2) |
|---|---|---|---|---|---|
| New York | 4,750 | 0.55 | 3.17 | $ 24.57 | $ 51,110 |
| California | 2,390 | 0.14 | 0.84 | $ 24.83 | $ 51,650 |
| Texas | 2,270 | 0.19 | 1.08 | $ 20.76 | $ 43,180 |
| Florida | 1,690 | 0.20 | 1.13 | $ 20.93 | $ 43,520 |
| Washington | 1,540 | 0.48 | 2.79 | $ 24.41 | $ 50,770 |
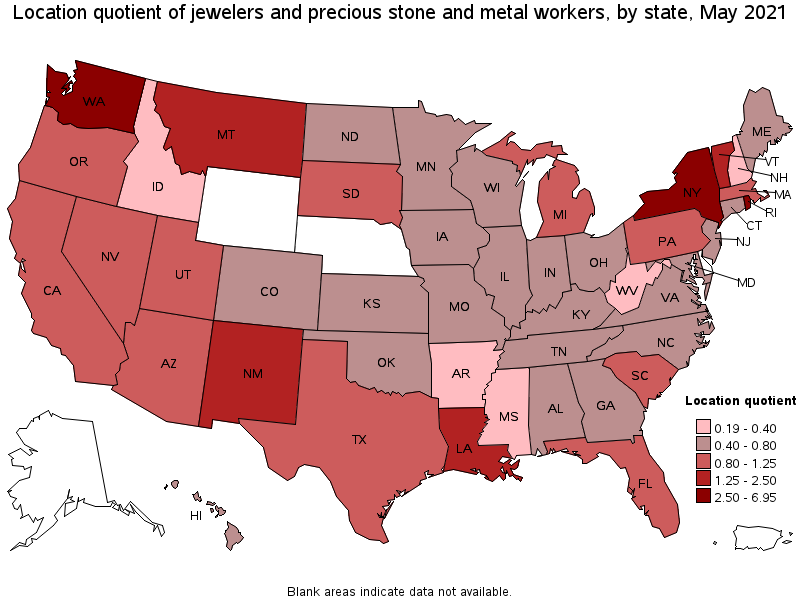
States with the highest concentration of jobs and location quotients in Jewelers and Precious Stone and Metal Workers:
| State | Employment (1) | Employment per thousand jobs | Location quotient (9) | Hourly mean wage | Annual mean wage (2) |
|---|---|---|---|---|---|
| Rhode Island | 550 | 1.20 | 6.95 | $ 21.69 | $ 45,120 |
| New York | 4,750 | 0.55 | 3.17 | $ 24.57 | $ 51,110 |
| Washington | 1,540 | 0.48 | 2.79 | $ 24.41 | $ 50,770 |
| Vermont | 100 | 0.34 | 1.99 | $ 20.43 | $ 42,500 |
| New Mexico | 260 | 0.33 | 1.94 | $ 16.27 | $ 33,850 |
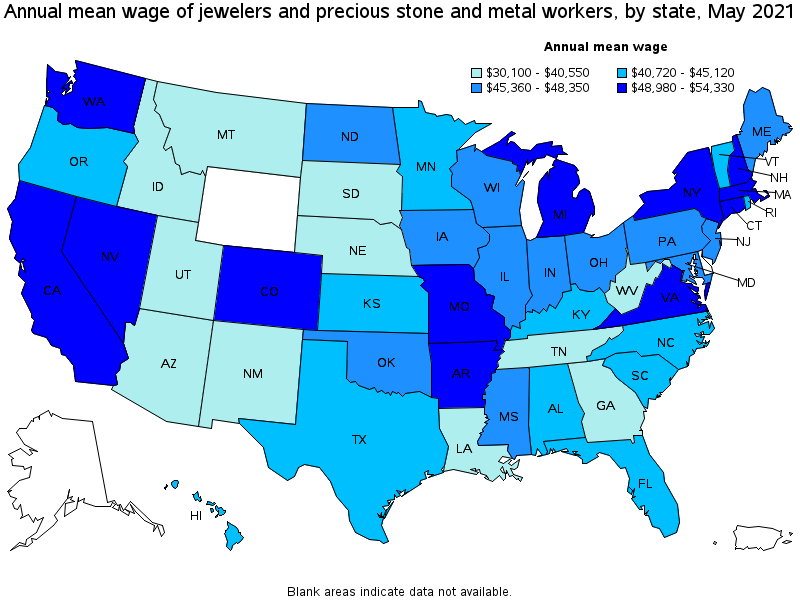
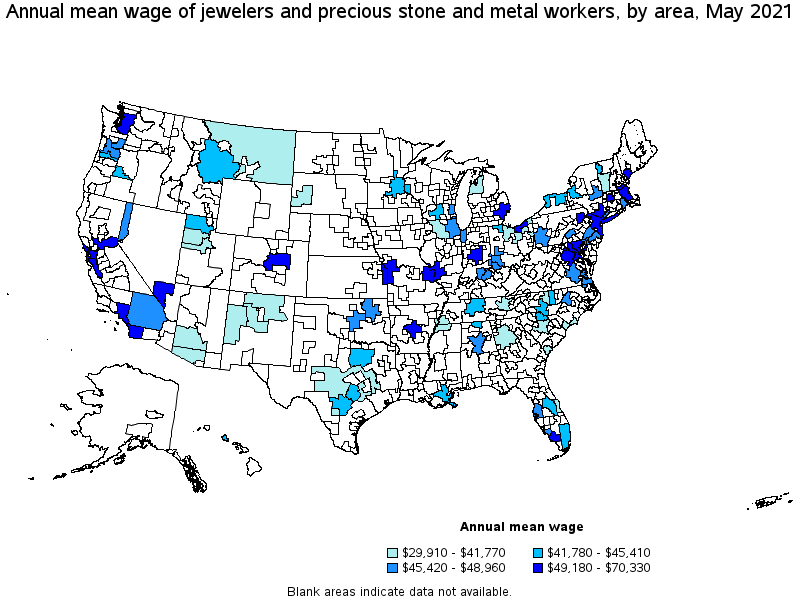
Top paying states for Jewelers and Precious Stone and Metal Workers:
| State | Employment (1) | Employment per thousand jobs | Location quotient (9) | Hourly mean wage | Annual mean wage (2) |
|---|---|---|---|---|---|
| Massachusetts | 660 | 0.19 | 1.12 | $ 26.12 | $ 54,330 |
| Virginia | 480 | 0.13 | 0.74 | $ 25.04 | $ 52,080 |
| Connecticut | 140 | 0.09 | 0.50 | $ 24.99 | $ 51,980 |
| New Hampshire | 40 | 0.06 | 0.36 | $ 24.99 | $ 51,980 |
| Arkansas | 70 | 0.06 | 0.36 | $ 24.90 | $ 51,780 |
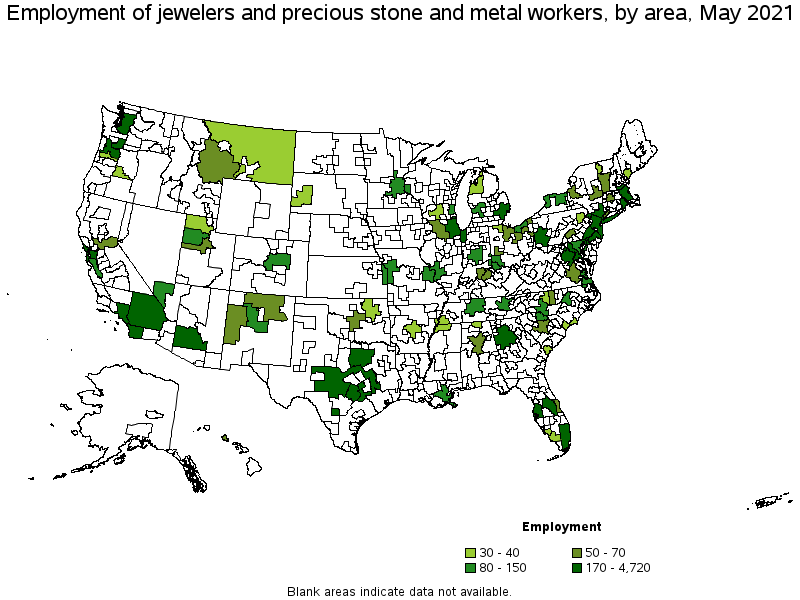
Metropolitan areas with the highest employment level in Jewelers and Precious Stone and Metal Workers:
| Metropolitan area | Employment (1) | Employment per thousand jobs | Location quotient (9) | Hourly mean wage | Annual mean wage (2) |
|---|---|---|---|---|---|
| New York-Newark-Jersey City, NY-NJ-PA | 4,720 | 0.54 | 3.15 | $ 24.66 | $ 51,290 |
| Seattle-Tacoma-Bellevue, WA | 1,450 | 0.76 | 4.38 | $ 24.57 | $ 51,100 |
| Los Angeles-Long Beach-Anaheim, CA | 1,310 | 0.23 | 1.33 | $ 24.71 | $ 51,410 |
| Miami-Fort Lauderdale-West Palm Beach, FL | 820 | 0.33 | 1.92 | $ 20.68 | $ 43,020 |
| Dallas-Fort Worth-Arlington, TX | 760 | 0.21 | 1.22 | $ 21.37 | $ 44,450 |
| Providence-Warwick, RI-MA | 710 | 1.32 | 7.65 | $ 21.84 | $ 45,420 |
| Chicago-Naperville-Elgin, IL-IN-WI | 520 | 0.12 | 0.72 | $ 22.72 | $ 47,250 |
| Phoenix-Mesa-Scottsdale, AZ | 410 | 0.19 | 1.11 | $ 17.93 | $ 37,300 |
| Boston-Cambridge-Nashua, MA-NH | 340 | 0.13 | 0.77 | $ 25.20 | $ 52,410 |
| Philadelphia-Camden-Wilmington, PA-NJ-DE-MD | 320 | 0.12 | 0.70 | $ 23.54 | $ 48,960 |
Metropolitan areas with the highest concentration of jobs and location quotients in Jewelers and Precious Stone and Metal Workers:
| Metropolitan area | Employment (1) | Employment per thousand jobs | Location quotient (9) | Hourly mean wage | Annual mean wage (2) |
|---|---|---|---|---|---|
| Providence-Warwick, RI-MA | 710 | 1.32 | 7.65 | $ 21.84 | $ 45,420 |
| Seattle-Tacoma-Bellevue, WA | 1,450 | 0.76 | 4.38 | $ 24.57 | $ 51,100 |
| New York-Newark-Jersey City, NY-NJ-PA | 4,720 | 0.54 | 3.15 | $ 24.66 | $ 51,290 |
| Rapid City, SD | 30 | 0.52 | 2.99 | $ 17.98 | $ 37,400 |
| Hilton Head Island-Bluffton-Beaufort, SC | 40 | 0.51 | 2.97 | $ 20.08 | $ 41,770 |
| Bend-Redmond, OR | 40 | 0.49 | 2.81 | $ 21.18 | $ 44,040 |
| Albuquerque, NM | 150 | 0.40 | 2.30 | $ 16.95 | $ 35,260 |
| Burlington-South Burlington, VT | 40 | 0.37 | 2.16 | $ 20.91 | $ 43,490 |
| Miami-Fort Lauderdale-West Palm Beach, FL | 820 | 0.33 | 1.92 | $ 20.68 | $ 43,020 |
| Knoxville, TN | 120 | 0.31 | 1.78 | $ 18.19 | $ 37,830 |
Top paying metropolitan areas for Jewelers and Precious Stone and Metal Workers:
| Metropolitan area | Employment (1) | Employment per thousand jobs | Location quotient (9) | Hourly mean wage | Annual mean wage (2) |
|---|---|---|---|---|---|
| Springfield, MA-CT | 60 | 0.18 | 1.03 | $ 33.81 | $ 70,330 |
| San Jose-Sunnyvale-Santa Clara, CA | 80 | 0.07 | 0.41 | $ 29.87 | $ 62,120 |
| Little Rock-North Little Rock-Conway, AR | 30 | 0.09 | 0.54 | $ 27.63 | $ 57,460 |
| Washington-Arlington-Alexandria, DC-VA-MD-WV | 280 | 0.10 | 0.56 | $ 27.45 | $ 57,100 |
| San Francisco-Oakland-Hayward, CA | 220 | 0.10 | 0.56 | $ 26.58 | $ 55,290 |
| Detroit-Warren-Dearborn, MI | 310 | 0.17 | 0.98 | $ 25.88 | $ 53,830 |
| Denver-Aurora-Lakewood, CO | 120 | 0.08 | 0.45 | $ 25.59 | $ 53,220 |
| Sacramento--Roseville--Arden-Arcade, CA | 70 | 0.08 | 0.44 | $ 25.48 | $ 52,990 |
| Boston-Cambridge-Nashua, MA-NH | 340 | 0.13 | 0.77 | $ 25.20 | $ 52,410 |
| Cleveland-Elyria, OH | 100 | 0.10 | 0.57 | $ 25.18 | $ 52,380 |
Nonmetropolitan areas with the highest employment in Jewelers and Precious Stone and Metal Workers:
| Nonmetropolitan area | Employment (1) | Employment per thousand jobs | Location quotient (9) | Hourly mean wage | Annual mean wage (2) |
|---|---|---|---|---|---|
| Hill Country Region of Texas nonmetropolitan area | 290 | 1.54 | 8.90 | $ 17.12 | $ 35,610 |
| Northern New Mexico nonmetropolitan area | 70 | 0.88 | 5.09 | $ 14.38 | $ 29,910 |
| North Northeastern Ohio nonmetropolitan area (noncontiguous) | 50 | 0.17 | 0.97 | $ 19.48 | $ 40,520 |
| Northwest Illinois nonmetropolitan area | 50 | 0.41 | 2.37 | $ 19.75 | $ 41,080 |
| Southwest Montana nonmetropolitan area | 50 | 0.33 | 1.89 | $ 20.81 | $ 43,290 |
Nonmetropolitan areas with the highest concentration of jobs and location quotients in Jewelers and Precious Stone and Metal Workers:
| Nonmetropolitan area | Employment (1) | Employment per thousand jobs | Location quotient (9) | Hourly mean wage | Annual mean wage (2) |
|---|---|---|---|---|---|
| Hill Country Region of Texas nonmetropolitan area | 290 | 1.54 | 8.90 | $ 17.12 | $ 35,610 |
| Northern New Mexico nonmetropolitan area | 70 | 0.88 | 5.09 | $ 14.38 | $ 29,910 |
| East-Central Montana nonmetropolitan area | 40 | 0.68 | 3.96 | $ 17.14 | $ 35,640 |
| Southern Vermont nonmetropolitan area | 50 | 0.47 | 2.72 | $ 19.51 | $ 40,590 |
| Northwest Illinois nonmetropolitan area | 50 | 0.41 | 2.37 | $ 19.75 | $ 41,080 |
Top paying nonmetropolitan areas for Jewelers and Precious Stone and Metal Workers:
| Nonmetropolitan area | Employment (1) | Employment per thousand jobs | Location quotient (9) | Hourly mean wage | Annual mean wage (2) |
|---|---|---|---|---|---|
| Southwest Montana nonmetropolitan area | 50 | 0.33 | 1.89 | $ 20.81 | $ 43,290 |
| Northwest Illinois nonmetropolitan area | 50 | 0.41 | 2.37 | $ 19.75 | $ 41,080 |
| Southern Vermont nonmetropolitan area | 50 | 0.47 | 2.72 | $ 19.51 | $ 40,590 |
| North Northeastern Ohio nonmetropolitan area (noncontiguous) | 50 | 0.17 | 0.97 | $ 19.48 | $ 40,520 |
| Northwest Lower Peninsula of Michigan nonmetropolitan area | 30 | 0.28 | 1.63 | $ 18.64 | $ 38,780 |
These estimates are calculated with data collected from employers in all industry sectors, all metropolitan and nonmetropolitan areas, and all states and the District of Columbia. The top employment and wage figures are provided above. The complete list is available in the downloadable XLS files.
The percentile wage estimate is the value of a wage below which a certain percent of workers fall. The median wage is the 50th percentile wage estimate—50 percent of workers earn less than the median and 50 percent of workers earn more than the median. More about percentile wages.
(1) Estimates for detailed occupations do not sum to the totals because the totals include occupations not shown separately. Estimates do not include self-employed workers.
(2) Annual wages have been calculated by multiplying the hourly mean wage by a "year-round, full-time" hours figure of 2,080 hours; for those occupations where there is not an hourly wage published, the annual wage has been directly calculated from the reported survey data.
(3) The relative standard error (RSE) is a measure of the reliability of a survey statistic. The smaller the relative standard error, the more precise the estimate.
(8) Estimate not released.
(9) The location quotient is the ratio of the area concentration of occupational employment to the national average concentration. A location quotient greater than one indicates the occupation has a higher share of employment than average, and a location quotient less than one indicates the occupation is less prevalent in the area than average.
Other OEWS estimates and related information:
May 2021 National Occupational Employment and Wage Estimates
May 2021 State Occupational Employment and Wage Estimates
May 2021 Metropolitan and Nonmetropolitan Area Occupational Employment and Wage Estimates
May 2021 National Industry-Specific Occupational Employment and Wage Estimates
Last Modified Date: March 31, 2022