
An official website of the United States government
An official website of the United States government
The .gov means it's official.
Federal government websites often end in .gov or .mil. Before sharing sensitive information,
make sure you're on a federal government site.
The site is secure.
The
https:// ensures that you are connecting to the official website and that any
information you provide is encrypted and transmitted securely.
Perform any or all of the following functions in the manufacture of electronic semiconductors: load semiconductor material into furnace; saw formed ingots into segments; load individual segment into crystal growing chamber and monitor controls; locate crystal axis in ingot using x-ray equipment and saw ingots into wafers; and clean, polish, and load wafers into series of special purpose furnaces, chemical baths, and equipment used to form circuitry and change conductive properties.
Employment estimate and mean wage estimates for Semiconductor Processing Technicians:
| Employment (1) | Employment RSE (3) |
Mean hourly wage |
Mean annual wage (2) |
Wage RSE (3) |
|---|---|---|---|---|
| 24,020 | 2.2 % | $ 22.07 | $ 45,910 | 0.6 % |
Percentile wage estimates for Semiconductor Processing Technicians:
| Percentile | 10% | 25% | 50% (Median) |
75% | 90% |
|---|---|---|---|---|---|
| Hourly Wage | $ 14.34 | $ 17.35 | $ 19.17 | $ 26.88 | $ 34.74 |
| Annual Wage (2) | $ 29,830 | $ 36,100 | $ 39,870 | $ 55,910 | $ 72,260 |
Industries with the highest published employment and wages for Semiconductor Processing Technicians are provided. For a list of all industries with employment in Semiconductor Processing Technicians, see the Create Customized Tables function.
Industries with the highest levels of employment in Semiconductor Processing Technicians:
| Industry | Employment (1) | Percent of industry employment | Hourly mean wage | Annual mean wage (2) |
|---|---|---|---|---|
| Semiconductor and Other Electronic Component Manufacturing | 22,180 | 6.20 | $ 21.95 | $ 45,660 |
| Employment Services | 300 | 0.01 | $ 15.56 | $ 32,370 |
| Machinery Manufacturing (3331, 3332, 3334, and 3339 only) | 230 | 0.03 | $ 29.88 | $ 62,160 |
| Electronic and Precision Equipment Repair and Maintenance | 70 | 0.07 | $ 40.91 | $ 85,080 |
Industries with the highest concentration of employment in Semiconductor Processing Technicians:
| Industry | Employment (1) | Percent of industry employment | Hourly mean wage | Annual mean wage (2) |
|---|---|---|---|---|
| Semiconductor and Other Electronic Component Manufacturing | 22,180 | 6.20 | $ 21.95 | $ 45,660 |
| Electronic and Precision Equipment Repair and Maintenance | 70 | 0.07 | $ 40.91 | $ 85,080 |
| Machinery Manufacturing (3331, 3332, 3334, and 3339 only) | 230 | 0.03 | $ 29.88 | $ 62,160 |
| Employment Services | 300 | 0.01 | $ 15.56 | $ 32,370 |
Top paying industries for Semiconductor Processing Technicians:
| Industry | Employment (1) | Percent of industry employment | Hourly mean wage | Annual mean wage (2) |
|---|---|---|---|---|
| Electronic and Precision Equipment Repair and Maintenance | 70 | 0.07 | $ 40.91 | $ 85,080 |
| Machinery Manufacturing (3331, 3332, 3334, and 3339 only) | 230 | 0.03 | $ 29.88 | $ 62,160 |
| Merchant Wholesalers, Durable Goods (4232, 4233, 4235, 4236, 4237, and 4239 only) | (8) | (8) | $ 23.14 | $ 48,130 |
| Architectural, Engineering, and Related Services | (8) | (8) | $ 22.91 | $ 47,640 |
| Semiconductor and Other Electronic Component Manufacturing | 22,180 | 6.20 | $ 21.95 | $ 45,660 |
States and areas with the highest published employment, location quotients, and wages for Semiconductor Processing Technicians are provided. For a list of all areas with employment in Semiconductor Processing Technicians, see the Create Customized Tables function.
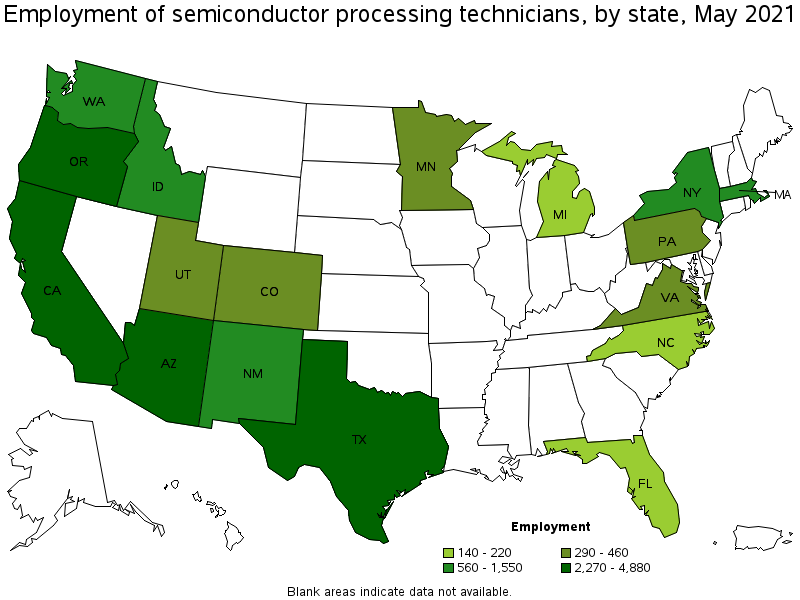
States with the highest employment level in Semiconductor Processing Technicians:
| State | Employment (1) | Employment per thousand jobs | Location quotient (9) | Hourly mean wage | Annual mean wage (2) |
|---|---|---|---|---|---|
| California | 4,880 | 0.30 | 1.73 | $ 23.44 | $ 48,750 |
| Texas | 4,560 | 0.37 | 2.19 | $ 16.34 | $ 33,990 |
| Oregon | 4,510 | 2.47 | 14.49 | $ 24.64 | $ 51,250 |
| Arizona | 2,270 | 0.79 | 4.63 | $ 27.82 | $ 57,870 |
| New York | 1,550 | 0.18 | 1.05 | $ 20.46 | $ 42,570 |
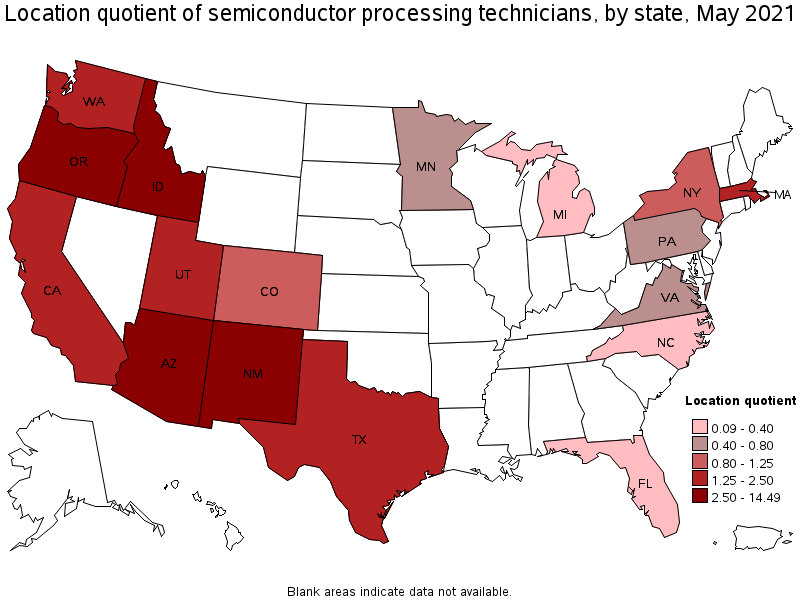
States with the highest concentration of jobs and location quotients in Semiconductor Processing Technicians:
| State | Employment (1) | Employment per thousand jobs | Location quotient (9) | Hourly mean wage | Annual mean wage (2) |
|---|---|---|---|---|---|
| Oregon | 4,510 | 2.47 | 14.49 | $ 24.64 | $ 51,250 |
| Arizona | 2,270 | 0.79 | 4.63 | $ 27.82 | $ 57,870 |
| New Mexico | 610 | 0.79 | 4.61 | $ 23.32 | $ 48,500 |
| Idaho | 560 | 0.74 | 4.36 | $ 17.61 | $ 36,630 |
| Texas | 4,560 | 0.37 | 2.19 | $ 16.34 | $ 33,990 |
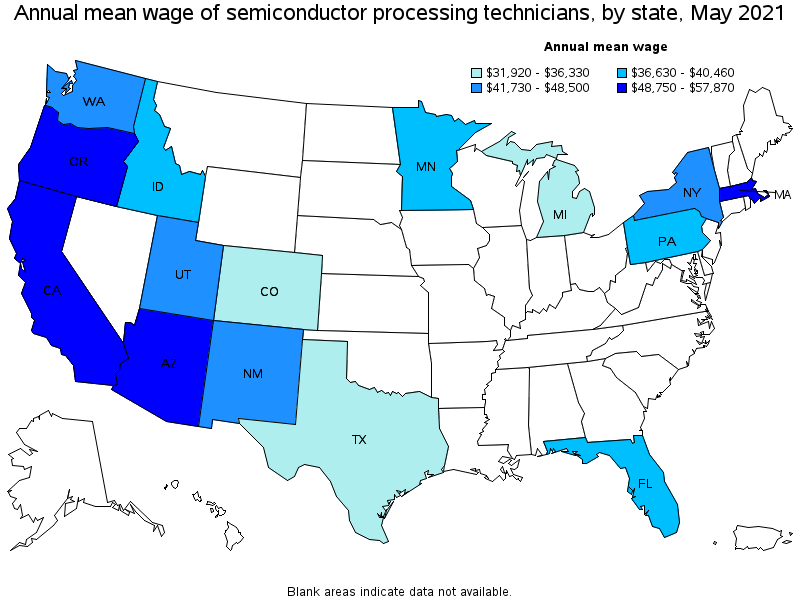
Top paying states for Semiconductor Processing Technicians:
| State | Employment (1) | Employment per thousand jobs | Location quotient (9) | Hourly mean wage | Annual mean wage (2) |
|---|---|---|---|---|---|
| Arizona | 2,270 | 0.79 | 4.63 | $ 27.82 | $ 57,870 |
| Massachusetts | 730 | 0.22 | 1.27 | $ 27.29 | $ 56,750 |
| Oregon | 4,510 | 2.47 | 14.49 | $ 24.64 | $ 51,250 |
| California | 4,880 | 0.30 | 1.73 | $ 23.44 | $ 48,750 |
| New Mexico | 610 | 0.79 | 4.61 | $ 23.32 | $ 48,500 |
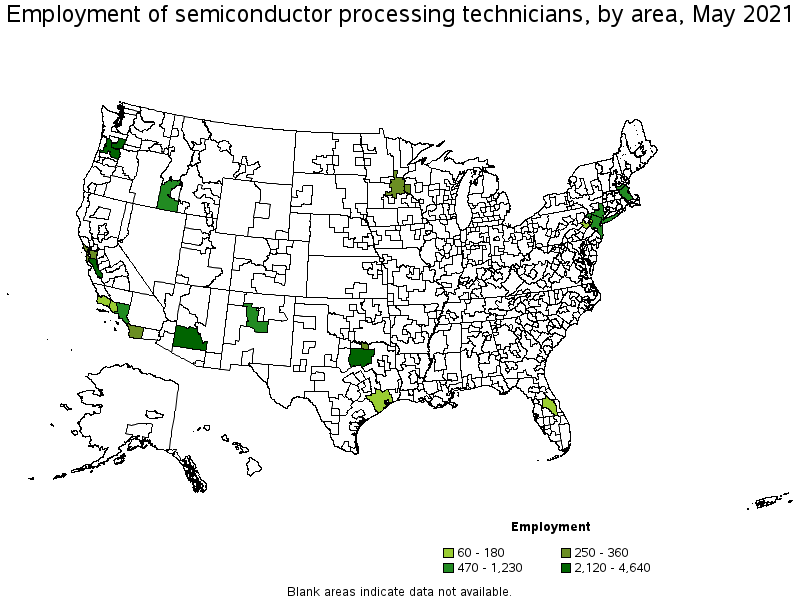
Metropolitan areas with the highest employment level in Semiconductor Processing Technicians:
| Metropolitan area | Employment (1) | Employment per thousand jobs | Location quotient (9) | Hourly mean wage | Annual mean wage (2) |
|---|---|---|---|---|---|
| Portland-Vancouver-Hillsboro, OR-WA | 4,640 | 4.14 | 24.26 | $ 24.63 | $ 51,230 |
| San Jose-Sunnyvale-Santa Clara, CA | 2,450 | 2.30 | 13.47 | $ 25.07 | $ 52,140 |
| Phoenix-Mesa-Scottsdale, AZ | 2,200 | 1.04 | 6.10 | $ 27.96 | $ 58,150 |
| Dallas-Fort Worth-Arlington, TX | 2,120 | 0.59 | 3.46 | $ 16.88 | $ 35,100 |
| Los Angeles-Long Beach-Anaheim, CA | 1,230 | 0.22 | 1.26 | $ 20.23 | $ 42,070 |
| Albuquerque, NM | 610 | 1.67 | 9.79 | $ 23.33 | $ 48,520 |
| Boston-Cambridge-Nashua, MA-NH | 580 | 0.22 | 1.31 | $ 28.10 | $ 58,450 |
| Boise City, ID | 500 | 1.48 | 8.67 | $ 17.92 | $ 37,280 |
| New York-Newark-Jersey City, NY-NJ-PA | 470 | 0.05 | 0.32 | $ 24.28 | $ 50,510 |
| Sherman-Denison, TX | 360 | 7.54 | 44.25 | $ 15.91 | $ 33,100 |
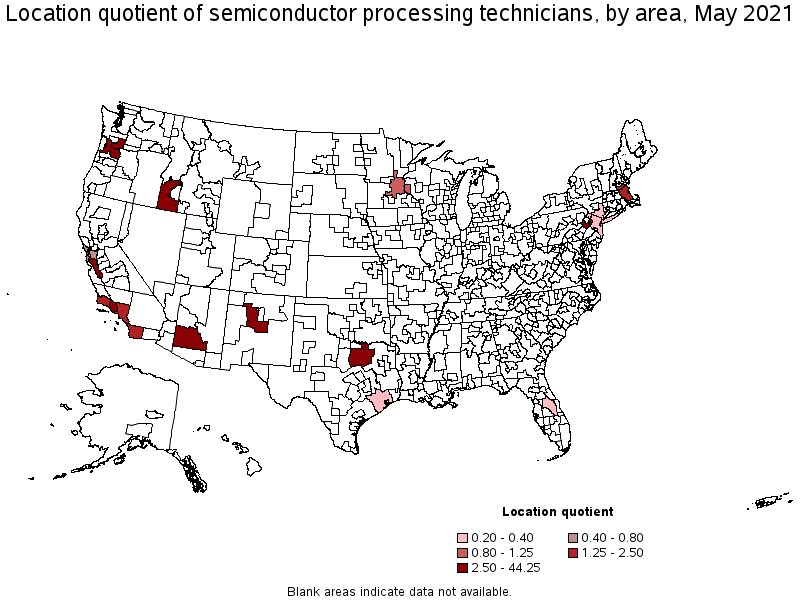
Metropolitan areas with the highest concentration of jobs and location quotients in Semiconductor Processing Technicians:
| Metropolitan area | Employment (1) | Employment per thousand jobs | Location quotient (9) | Hourly mean wage | Annual mean wage (2) |
|---|---|---|---|---|---|
| Sherman-Denison, TX | 360 | 7.54 | 44.25 | $ 15.91 | $ 33,100 |
| Portland-Vancouver-Hillsboro, OR-WA | 4,640 | 4.14 | 24.26 | $ 24.63 | $ 51,230 |
| San Jose-Sunnyvale-Santa Clara, CA | 2,450 | 2.30 | 13.47 | $ 25.07 | $ 52,140 |
| Albuquerque, NM | 610 | 1.67 | 9.79 | $ 23.33 | $ 48,520 |
| Boise City, ID | 500 | 1.48 | 8.67 | $ 17.92 | $ 37,280 |
| Phoenix-Mesa-Scottsdale, AZ | 2,200 | 1.04 | 6.10 | $ 27.96 | $ 58,150 |
| Oxnard-Thousand Oaks-Ventura, CA | 180 | 0.60 | 3.49 | $ 23.50 | $ 48,890 |
| Dallas-Fort Worth-Arlington, TX | 2,120 | 0.59 | 3.46 | $ 16.88 | $ 35,100 |
| Allentown-Bethlehem-Easton, PA-NJ | 170 | 0.49 | 2.87 | $ 19.34 | $ 40,220 |
| Santa Maria-Santa Barbara, CA | 60 | 0.30 | 1.78 | $ 27.20 | $ 56,580 |
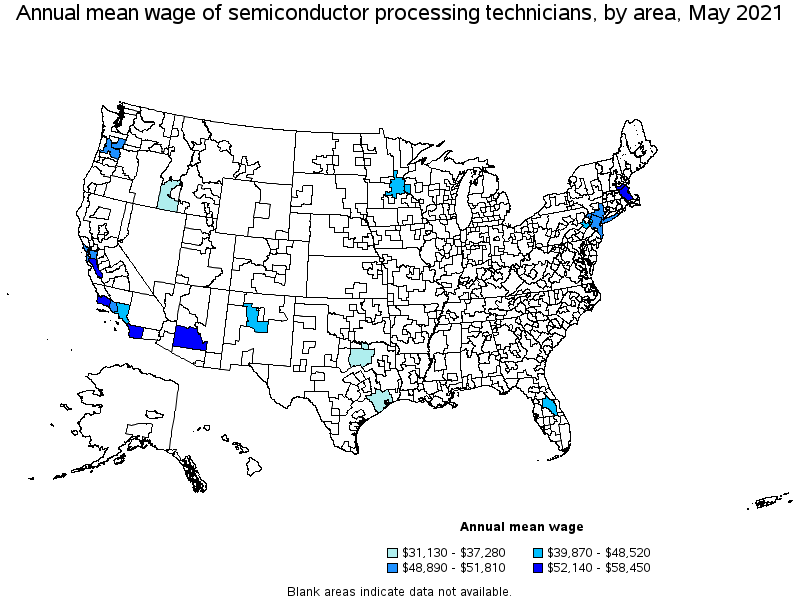
Top paying metropolitan areas for Semiconductor Processing Technicians:
| Metropolitan area | Employment (1) | Employment per thousand jobs | Location quotient (9) | Hourly mean wage | Annual mean wage (2) |
|---|---|---|---|---|---|
| Boston-Cambridge-Nashua, MA-NH | 580 | 0.22 | 1.31 | $ 28.10 | $ 58,450 |
| Phoenix-Mesa-Scottsdale, AZ | 2,200 | 1.04 | 6.10 | $ 27.96 | $ 58,150 |
| Santa Maria-Santa Barbara, CA | 60 | 0.30 | 1.78 | $ 27.20 | $ 56,580 |
| San Diego-Carlsbad, CA | 340 | 0.25 | 1.44 | $ 25.62 | $ 53,290 |
| San Jose-Sunnyvale-Santa Clara, CA | 2,450 | 2.30 | 13.47 | $ 25.07 | $ 52,140 |
| San Francisco-Oakland-Hayward, CA | 290 | 0.13 | 0.75 | $ 24.91 | $ 51,810 |
| Portland-Vancouver-Hillsboro, OR-WA | 4,640 | 4.14 | 24.26 | $ 24.63 | $ 51,230 |
| New York-Newark-Jersey City, NY-NJ-PA | 470 | 0.05 | 0.32 | $ 24.28 | $ 50,510 |
| Oxnard-Thousand Oaks-Ventura, CA | 180 | 0.60 | 3.49 | $ 23.50 | $ 48,890 |
| Albuquerque, NM | 610 | 1.67 | 9.79 | $ 23.33 | $ 48,520 |
These estimates are calculated with data collected from employers in all industry sectors, all metropolitan and nonmetropolitan areas, and all states and the District of Columbia. The top employment and wage figures are provided above. The complete list is available in the downloadable XLS files.
The percentile wage estimate is the value of a wage below which a certain percent of workers fall. The median wage is the 50th percentile wage estimate—50 percent of workers earn less than the median and 50 percent of workers earn more than the median. More about percentile wages.
(1) Estimates for detailed occupations do not sum to the totals because the totals include occupations not shown separately. Estimates do not include self-employed workers.
(2) Annual wages have been calculated by multiplying the hourly mean wage by a "year-round, full-time" hours figure of 2,080 hours; for those occupations where there is not an hourly wage published, the annual wage has been directly calculated from the reported survey data.
(3) The relative standard error (RSE) is a measure of the reliability of a survey statistic. The smaller the relative standard error, the more precise the estimate.
(8) Estimate not released.
(9) The location quotient is the ratio of the area concentration of occupational employment to the national average concentration. A location quotient greater than one indicates the occupation has a higher share of employment than average, and a location quotient less than one indicates the occupation is less prevalent in the area than average.
Other OEWS estimates and related information:
May 2021 National Occupational Employment and Wage Estimates
May 2021 State Occupational Employment and Wage Estimates
May 2021 Metropolitan and Nonmetropolitan Area Occupational Employment and Wage Estimates
May 2021 National Industry-Specific Occupational Employment and Wage Estimates
Last Modified Date: March 31, 2022