
An official website of the United States government
An official website of the United States government
The .gov means it's official.
Federal government websites often end in .gov or .mil. Before sharing sensitive information,
make sure you're on a federal government site.
The site is secure.
The
https:// ensures that you are connecting to the official website and that any
information you provide is encrypted and transmitted securely.
Develop programs to control machining or processing of materials by automatic machine tools, equipment, or systems. May also set up, operate, or maintain equipment.
Employment estimate and mean wage estimates for Computer Numerically Controlled Tool Programmers:
| Employment (1) | Employment RSE (3) |
Mean hourly wage |
Mean annual wage (2) |
Wage RSE (3) |
|---|---|---|---|---|
| 25,800 | 1.9 % | $ 29.98 | $ 62,360 | 0.6 % |
Percentile wage estimates for Computer Numerically Controlled Tool Programmers:
| Percentile | 10% | 25% | 50% (Median) |
75% | 90% |
|---|---|---|---|---|---|
| Hourly Wage | $ 18.41 | $ 23.16 | $ 29.22 | $ 36.80 | $ 41.80 |
| Annual Wage (2) | $ 38,290 | $ 48,160 | $ 60,780 | $ 76,540 | $ 86,940 |
Industries with the highest published employment and wages for Computer Numerically Controlled Tool Programmers are provided. For a list of all industries with employment in Computer Numerically Controlled Tool Programmers, see the Create Customized Tables function.
Industries with the highest levels of employment in Computer Numerically Controlled Tool Programmers:
| Industry | Employment (1) | Percent of industry employment | Hourly mean wage | Annual mean wage (2) |
|---|---|---|---|---|
| Machine Shops; Turned Product; and Screw, Nut, and Bolt Manufacturing | 5,750 | 1.77 | $ 29.86 | $ 62,120 |
| Machinery Manufacturing (3331, 3332, 3334, and 3339 only) | 2,250 | 0.32 | $ 28.67 | $ 59,630 |
| Metalworking Machinery Manufacturing | 2,230 | 1.39 | $ 29.63 | $ 61,620 |
| Fabricated Metal Product Manufacturing (3321, 3322, 3325, 3326, and 3329 only) | 2,050 | 0.46 | $ 29.79 | $ 61,960 |
| Aerospace Product and Parts Manufacturing | 1,990 | 0.42 | $ 41.49 | $ 86,310 |
Industries with the highest concentration of employment in Computer Numerically Controlled Tool Programmers:
| Industry | Employment (1) | Percent of industry employment | Hourly mean wage | Annual mean wage (2) |
|---|---|---|---|---|
| Machine Shops; Turned Product; and Screw, Nut, and Bolt Manufacturing | 5,750 | 1.77 | $ 29.86 | $ 62,120 |
| Metalworking Machinery Manufacturing | 2,230 | 1.39 | $ 29.63 | $ 61,620 |
| Fabricated Metal Product Manufacturing (3321, 3322, 3325, 3326, and 3329 only) | 2,050 | 0.46 | $ 29.79 | $ 61,960 |
| Aerospace Product and Parts Manufacturing | 1,990 | 0.42 | $ 41.49 | $ 86,310 |
| Foundries | 360 | 0.35 | $ 27.15 | $ 56,470 |
Top paying industries for Computer Numerically Controlled Tool Programmers:
| Industry | Employment (1) | Percent of industry employment | Hourly mean wage | Annual mean wage (2) |
|---|---|---|---|---|
| Management of Companies and Enterprises | 50 | (7) | $ 46.11 | $ 95,920 |
| Aerospace Product and Parts Manufacturing | 1,990 | 0.42 | $ 41.49 | $ 86,310 |
| Building Equipment Contractors | 150 | 0.01 | $ 36.85 | $ 76,640 |
| Professional and Commercial Equipment and Supplies Merchant Wholesalers | 110 | 0.02 | $ 34.21 | $ 71,160 |
| Scientific Research and Development Services | 30 | (7) | $ 32.68 | $ 67,970 |
States and areas with the highest published employment, location quotients, and wages for Computer Numerically Controlled Tool Programmers are provided. For a list of all areas with employment in Computer Numerically Controlled Tool Programmers, see the Create Customized Tables function.
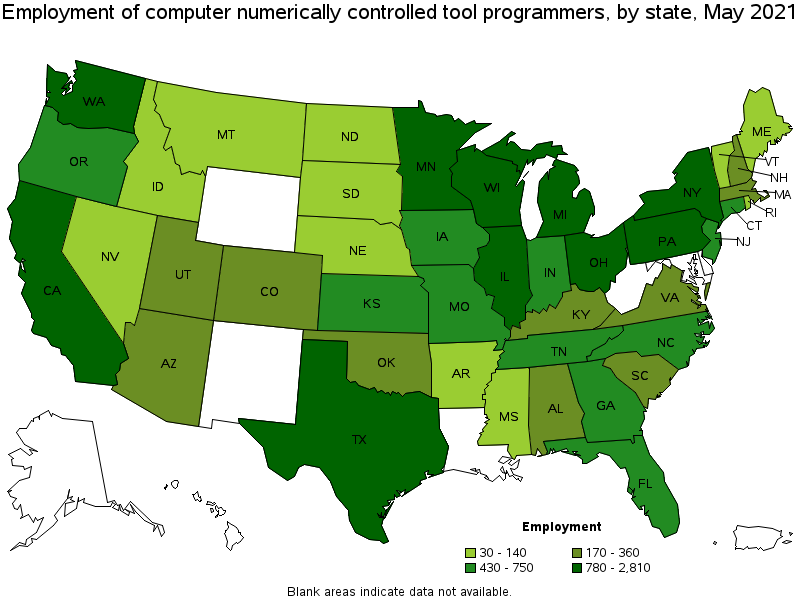
States with the highest employment level in Computer Numerically Controlled Tool Programmers:
| State | Employment (1) | Employment per thousand jobs | Location quotient (9) | Hourly mean wage | Annual mean wage (2) |
|---|---|---|---|---|---|
| California | 2,810 | 0.17 | 0.93 | $ 37.16 | $ 77,290 |
| Michigan | 2,050 | 0.50 | 2.76 | $ 27.90 | $ 58,030 |
| Texas | 2,010 | 0.16 | 0.90 | $ 28.77 | $ 59,830 |
| Ohio | 1,900 | 0.36 | 1.99 | $ 27.32 | $ 56,820 |
| Illinois | 1,240 | 0.22 | 1.21 | $ 27.87 | $ 57,980 |
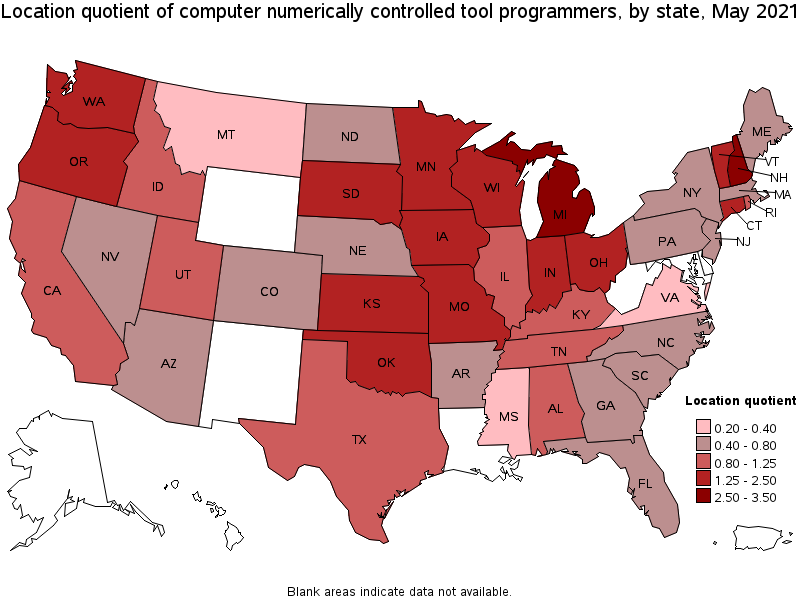
States with the highest concentration of jobs and location quotients in Computer Numerically Controlled Tool Programmers:
| State | Employment (1) | Employment per thousand jobs | Location quotient (9) | Hourly mean wage | Annual mean wage (2) |
|---|---|---|---|---|---|
| Michigan | 2,050 | 0.50 | 2.76 | $ 27.90 | $ 58,030 |
| New Hampshire | 310 | 0.49 | 2.68 | $ 32.60 | $ 67,800 |
| Kansas | 600 | 0.45 | 2.44 | $ 33.77 | $ 70,250 |
| Wisconsin | 1,120 | 0.41 | 2.23 | $ 27.86 | $ 57,950 |
| Oregon | 730 | 0.40 | 2.19 | $ 32.12 | $ 66,820 |
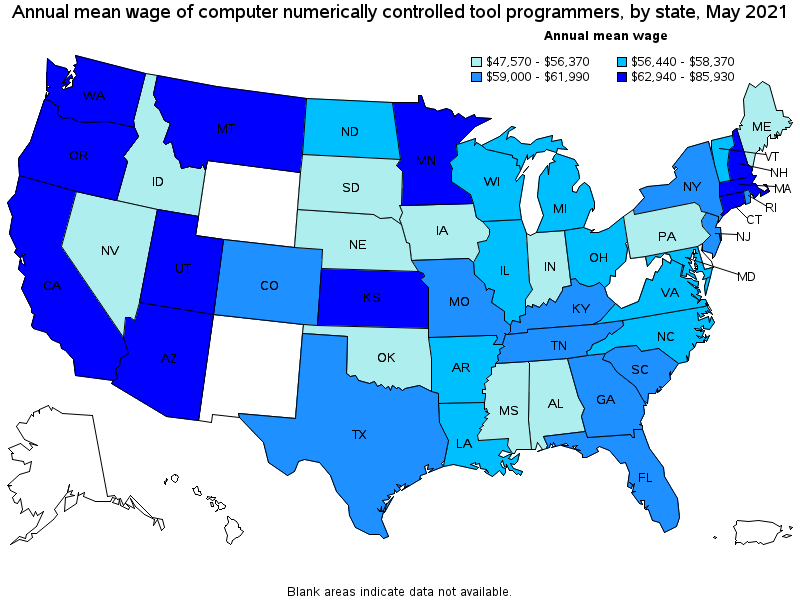
Top paying states for Computer Numerically Controlled Tool Programmers:
| State | Employment (1) | Employment per thousand jobs | Location quotient (9) | Hourly mean wage | Annual mean wage (2) |
|---|---|---|---|---|---|
| Washington | 780 | 0.24 | 1.33 | $ 41.31 | $ 85,930 |
| California | 2,810 | 0.17 | 0.93 | $ 37.16 | $ 77,290 |
| Connecticut | 510 | 0.32 | 1.76 | $ 35.89 | $ 74,650 |
| Kansas | 600 | 0.45 | 2.44 | $ 33.77 | $ 70,250 |
| Massachusetts | 360 | 0.11 | 0.58 | $ 33.64 | $ 69,970 |
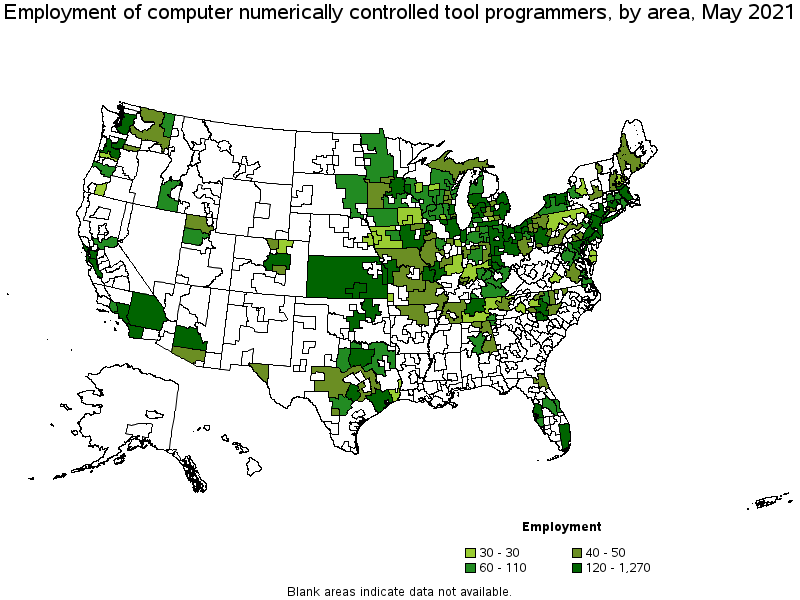
Metropolitan areas with the highest employment level in Computer Numerically Controlled Tool Programmers:
| Metropolitan area | Employment (1) | Employment per thousand jobs | Location quotient (9) | Hourly mean wage | Annual mean wage (2) |
|---|---|---|---|---|---|
| Los Angeles-Long Beach-Anaheim, CA | 1,270 | 0.22 | 1.21 | $ 35.64 | $ 74,130 |
| Chicago-Naperville-Elgin, IL-IN-WI | 930 | 0.22 | 1.20 | $ 28.16 | $ 58,570 |
| Detroit-Warren-Dearborn, MI | 910 | 0.51 | 2.76 | $ 29.30 | $ 60,930 |
| Houston-The Woodlands-Sugar Land, TX | 790 | 0.27 | 1.50 | $ 30.34 | $ 63,100 |
| Minneapolis-St. Paul-Bloomington, MN-WI | 680 | 0.38 | 2.05 | $ 30.66 | $ 63,780 |
| New York-Newark-Jersey City, NY-NJ-PA | 680 | 0.08 | 0.43 | $ 31.69 | $ 65,910 |
| Seattle-Tacoma-Bellevue, WA | 560 | 0.29 | 1.59 | $ 44.67 | $ 92,910 |
| Portland-Vancouver-Hillsboro, OR-WA | 550 | 0.49 | 2.67 | $ 32.83 | $ 68,290 |
| Cleveland-Elyria, OH | 500 | 0.52 | 2.83 | $ 27.62 | $ 57,450 |
| Dallas-Fort Worth-Arlington, TX | 430 | 0.12 | 0.65 | $ 29.12 | $ 60,580 |
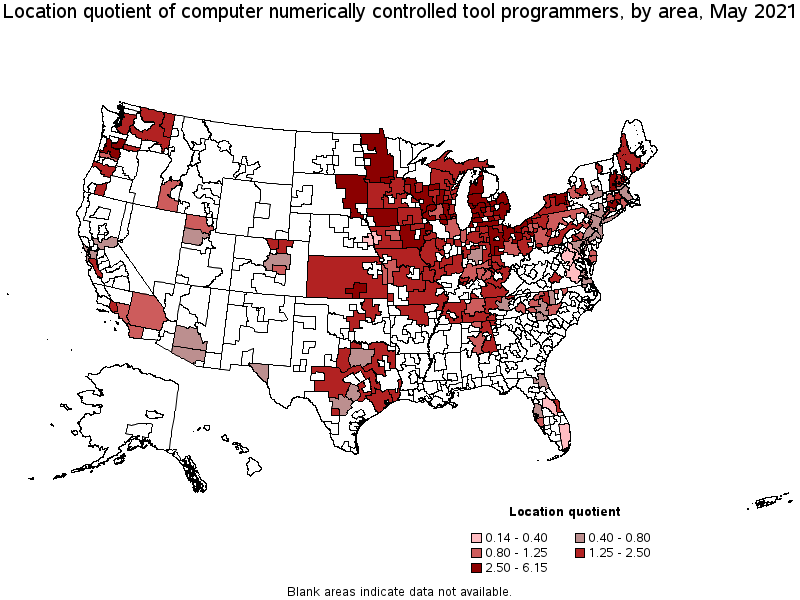
Metropolitan areas with the highest concentration of jobs and location quotients in Computer Numerically Controlled Tool Programmers:
| Metropolitan area | Employment (1) | Employment per thousand jobs | Location quotient (9) | Hourly mean wage | Annual mean wage (2) |
|---|---|---|---|---|---|
| Wichita, KS | 320 | 1.13 | 6.15 | $ 37.65 | $ 78,310 |
| Niles-Benton Harbor, MI | 60 | 1.03 | 5.64 | $ 26.59 | $ 55,320 |
| Fond du Lac, WI | 40 | 0.96 | 5.23 | $ 26.94 | $ 56,040 |
| Rockford, IL | 120 | 0.90 | 4.91 | $ 28.65 | $ 59,600 |
| Dover-Durham, NH-ME | 40 | 0.74 | 4.05 | $ 30.16 | $ 62,730 |
| Grand Rapids-Wyoming, MI | 360 | 0.72 | 3.92 | $ 27.69 | $ 57,600 |
| Racine, WI | 50 | 0.68 | 3.73 | $ 31.86 | $ 66,270 |
| Hartford-West Hartford-East Hartford, CT | 320 | 0.59 | 3.21 | $ 36.37 | $ 75,660 |
| Jackson, MI | 30 | 0.56 | 3.07 | $ 27.92 | $ 58,080 |
| Waterbury, CT | 40 | 0.55 | 3.01 | $ 30.28 | $ 62,980 |
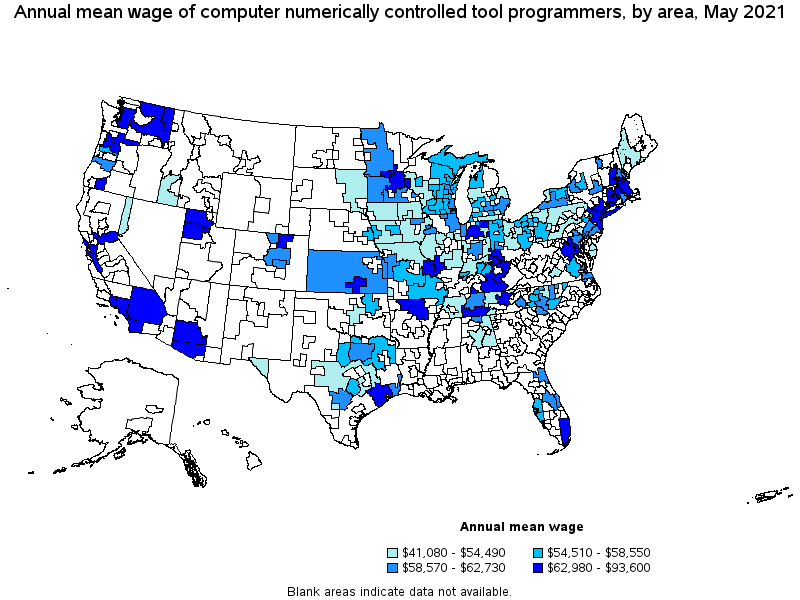
Top paying metropolitan areas for Computer Numerically Controlled Tool Programmers:
| Metropolitan area | Employment (1) | Employment per thousand jobs | Location quotient (9) | Hourly mean wage | Annual mean wage (2) |
|---|---|---|---|---|---|
| San Jose-Sunnyvale-Santa Clara, CA | 350 | 0.33 | 1.81 | $ 45.00 | $ 93,600 |
| Seattle-Tacoma-Bellevue, WA | 560 | 0.29 | 1.59 | $ 44.67 | $ 92,910 |
| San Francisco-Oakland-Hayward, CA | 260 | 0.11 | 0.62 | $ 41.66 | $ 86,660 |
| Bridgeport-Stamford-Norwalk, CT | 60 | 0.15 | 0.84 | $ 38.52 | $ 80,110 |
| Wichita, KS | 320 | 1.13 | 6.15 | $ 37.65 | $ 78,310 |
| Hartford-West Hartford-East Hartford, CT | 320 | 0.59 | 3.21 | $ 36.37 | $ 75,660 |
| Ogden-Clearfield, UT | 40 | 0.15 | 0.82 | $ 36.36 | $ 75,620 |
| San Diego-Carlsbad, CA | 250 | 0.18 | 0.98 | $ 36.22 | $ 75,340 |
| Salt Lake City, UT | 60 | 0.09 | 0.47 | $ 35.85 | $ 74,560 |
| Los Angeles-Long Beach-Anaheim, CA | 1,270 | 0.22 | 1.21 | $ 35.64 | $ 74,130 |
Nonmetropolitan areas with the highest employment in Computer Numerically Controlled Tool Programmers:
| Nonmetropolitan area | Employment (1) | Employment per thousand jobs | Location quotient (9) | Hourly mean wage | Annual mean wage (2) |
|---|---|---|---|---|---|
| North Northeastern Ohio nonmetropolitan area (noncontiguous) | 190 | 0.60 | 3.28 | $ 25.02 | $ 52,050 |
| Balance of Lower Peninsula of Michigan nonmetropolitan area | 180 | 0.71 | 3.87 | $ 25.73 | $ 53,510 |
| Southeast Iowa nonmetropolitan area | 140 | 0.69 | 3.76 | $ 23.84 | $ 49,580 |
| Kansas nonmetropolitan area | 140 | 0.36 | 1.99 | $ 28.52 | $ 59,330 |
| West Northwestern Ohio nonmetropolitan area | 140 | 0.56 | 3.08 | $ 26.62 | $ 55,380 |
Nonmetropolitan areas with the highest concentration of jobs and location quotients in Computer Numerically Controlled Tool Programmers:
| Nonmetropolitan area | Employment (1) | Employment per thousand jobs | Location quotient (9) | Hourly mean wage | Annual mean wage (2) |
|---|---|---|---|---|---|
| East South Dakota nonmetropolitan area | 110 | 0.87 | 4.73 | $ 23.62 | $ 49,120 |
| Northwest Iowa nonmetropolitan area | 110 | 0.81 | 4.40 | $ 23.67 | $ 49,220 |
| Balance of Lower Peninsula of Michigan nonmetropolitan area | 180 | 0.71 | 3.87 | $ 25.73 | $ 53,510 |
| Southeast Iowa nonmetropolitan area | 140 | 0.69 | 3.76 | $ 23.84 | $ 49,580 |
| Northwest Minnesota nonmetropolitan area | 110 | 0.62 | 3.37 | $ 28.30 | $ 58,870 |
Top paying nonmetropolitan areas for Computer Numerically Controlled Tool Programmers:
| Nonmetropolitan area | Employment (1) | Employment per thousand jobs | Location quotient (9) | Hourly mean wage | Annual mean wage (2) |
|---|---|---|---|---|---|
| Eastern Washington nonmetropolitan area | 40 | 0.42 | 2.32 | $ 32.26 | $ 67,100 |
| South Central Kentucky nonmetropolitan area | 70 | 0.44 | 2.39 | $ 31.89 | $ 66,340 |
| West Central-Southwest New Hampshire nonmetropolitan area | 50 | 0.53 | 2.90 | $ 31.85 | $ 66,240 |
| North Arkansas nonmetropolitan area | 40 | 0.33 | 1.78 | $ 31.78 | $ 66,090 |
| Northern Indiana nonmetropolitan area | 70 | 0.36 | 1.99 | $ 31.18 | $ 64,860 |
These estimates are calculated with data collected from employers in all industry sectors, all metropolitan and nonmetropolitan areas, and all states and the District of Columbia. The top employment and wage figures are provided above. The complete list is available in the downloadable XLS files.
The percentile wage estimate is the value of a wage below which a certain percent of workers fall. The median wage is the 50th percentile wage estimate—50 percent of workers earn less than the median and 50 percent of workers earn more than the median. More about percentile wages.
(1) Estimates for detailed occupations do not sum to the totals because the totals include occupations not shown separately. Estimates do not include self-employed workers.
(2) Annual wages have been calculated by multiplying the hourly mean wage by a "year-round, full-time" hours figure of 2,080 hours; for those occupations where there is not an hourly wage published, the annual wage has been directly calculated from the reported survey data.
(3) The relative standard error (RSE) is a measure of the reliability of a survey statistic. The smaller the relative standard error, the more precise the estimate.
(7) The value is less than .005 percent of industry employment.
(9) The location quotient is the ratio of the area concentration of occupational employment to the national average concentration. A location quotient greater than one indicates the occupation has a higher share of employment than average, and a location quotient less than one indicates the occupation is less prevalent in the area than average.
Other OEWS estimates and related information:
May 2021 National Occupational Employment and Wage Estimates
May 2021 State Occupational Employment and Wage Estimates
May 2021 Metropolitan and Nonmetropolitan Area Occupational Employment and Wage Estimates
May 2021 National Industry-Specific Occupational Employment and Wage Estimates
Last Modified Date: March 31, 2022