
An official website of the United States government
An official website of the United States government
The .gov means it's official.
Federal government websites often end in .gov or .mil. Before sharing sensitive information,
make sure you're on a federal government site.
The site is secure.
The
https:// ensures that you are connecting to the official website and that any
information you provide is encrypted and transmitted securely.
Operate or tend bonding machines that use adhesives to join items for further processing or to form a completed product. Processes include joining veneer sheets into plywood; gluing paper; or joining rubber and rubberized fabric parts, plastic, simulated leather, or other materials. Excludes �Shoe Machine Operators and Tenders� (51-6042).
Employment estimate and mean wage estimates for Adhesive Bonding Machine Operators and Tenders:
| Employment (1) | Employment RSE (3) |
Mean hourly wage |
Mean annual wage (2) |
Wage RSE (3) |
|---|---|---|---|---|
| 12,510 | 4.8 % | $ 18.55 | $ 38,580 | 1.2 % |
Percentile wage estimates for Adhesive Bonding Machine Operators and Tenders:
| Percentile | 10% | 25% | 50% (Median) |
75% | 90% |
|---|---|---|---|---|---|
| Hourly Wage | $ 12.94 | $ 14.34 | $ 18.09 | $ 22.35 | $ 23.55 |
| Annual Wage (2) | $ 26,920 | $ 29,820 | $ 37,630 | $ 46,480 | $ 48,980 |
Industries with the highest published employment and wages for Adhesive Bonding Machine Operators and Tenders are provided. For a list of all industries with employment in Adhesive Bonding Machine Operators and Tenders, see the Create Customized Tables function.
Industries with the highest levels of employment in Adhesive Bonding Machine Operators and Tenders:
| Industry | Employment (1) | Percent of industry employment | Hourly mean wage | Annual mean wage (2) |
|---|---|---|---|---|
| Converted Paper Product Manufacturing | 3,910 | 1.50 | $ 21.14 | $ 43,960 |
| Plastics Product Manufacturing | 1,620 | 0.28 | $ 15.76 | $ 32,780 |
| Veneer, Plywood, and Engineered Wood Product Manufacturing | 1,000 | 1.24 | $ 19.65 | $ 40,870 |
| Rubber Product Manufacturing | 720 | 0.56 | $ 19.36 | $ 40,270 |
| Furniture and Related Product Manufacturing (3371 and 3372 only) | 640 | 0.19 | $ 14.71 | $ 30,600 |
Industries with the highest concentration of employment in Adhesive Bonding Machine Operators and Tenders:
| Industry | Employment (1) | Percent of industry employment | Hourly mean wage | Annual mean wage (2) |
|---|---|---|---|---|
| Converted Paper Product Manufacturing | 3,910 | 1.50 | $ 21.14 | $ 43,960 |
| Veneer, Plywood, and Engineered Wood Product Manufacturing | 1,000 | 1.24 | $ 19.65 | $ 40,870 |
| Rubber Product Manufacturing | 720 | 0.56 | $ 19.36 | $ 40,270 |
| Footwear Manufacturing | 50 | 0.47 | $ 11.76 | $ 24,460 |
| Plastics Product Manufacturing | 1,620 | 0.28 | $ 15.76 | $ 32,780 |
Top paying industries for Adhesive Bonding Machine Operators and Tenders:
| Industry | Employment (1) | Percent of industry employment | Hourly mean wage | Annual mean wage (2) |
|---|---|---|---|---|
| Aerospace Product and Parts Manufacturing | 620 | 0.13 | $ 25.64 | $ 53,340 |
| Ship and Boat Building | 30 | 0.02 | $ 21.76 | $ 45,260 |
| Converted Paper Product Manufacturing | 3,910 | 1.50 | $ 21.14 | $ 43,960 |
| Pulp, Paper, and Paperboard Mills | 220 | 0.25 | $ 21.10 | $ 43,890 |
| Nonmetallic Mineral Product Manufacturing | 60 | 0.02 | $ 19.81 | $ 41,200 |
States and areas with the highest published employment, location quotients, and wages for Adhesive Bonding Machine Operators and Tenders are provided. For a list of all areas with employment in Adhesive Bonding Machine Operators and Tenders, see the Create Customized Tables function.
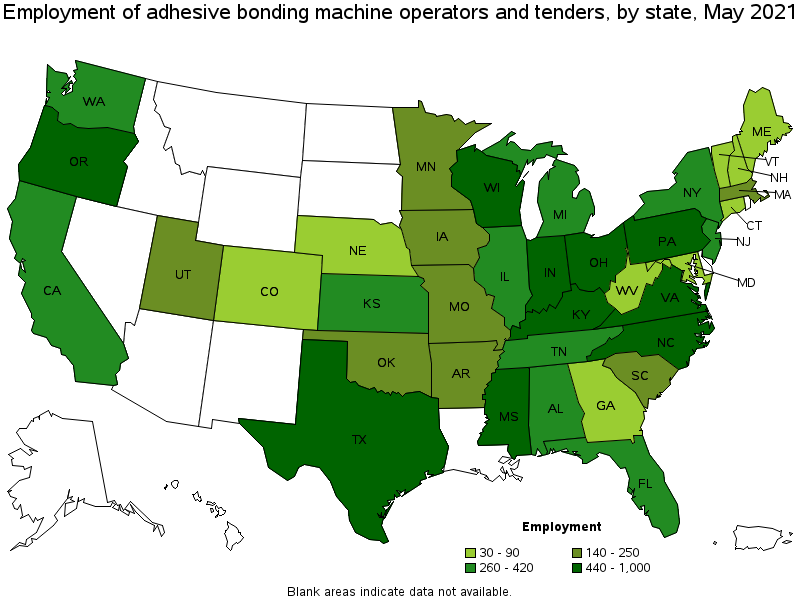
States with the highest employment level in Adhesive Bonding Machine Operators and Tenders:
| State | Employment (1) | Employment per thousand jobs | Location quotient (9) | Hourly mean wage | Annual mean wage (2) |
|---|---|---|---|---|---|
| Ohio | 1,000 | 0.19 | 2.16 | $ 19.20 | $ 39,930 |
| North Carolina | 960 | 0.22 | 2.45 | $ 16.07 | $ 33,420 |
| Indiana | 860 | 0.29 | 3.24 | $ 14.83 | $ 30,850 |
| Mississippi | 770 | 0.70 | 7.87 | $ 12.96 | $ 26,960 |
| Texas | 760 | 0.06 | 0.70 | $ 17.12 | $ 35,610 |
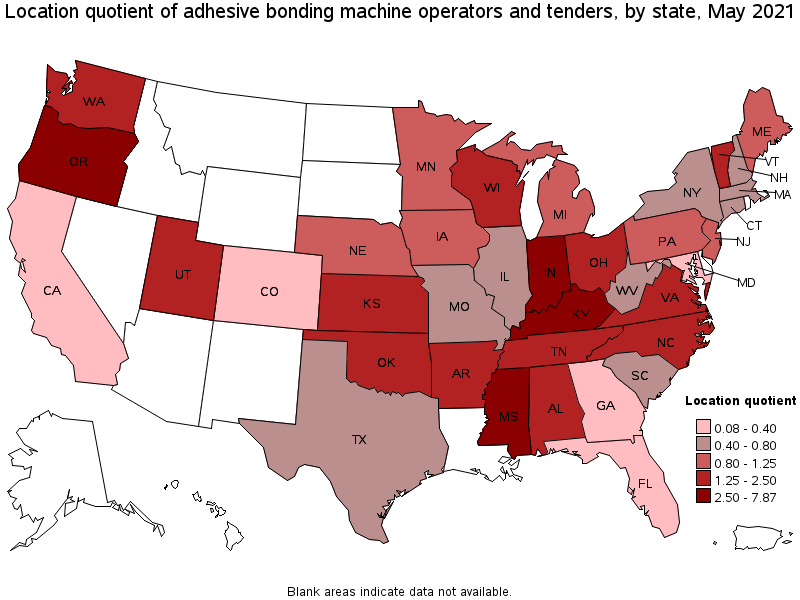
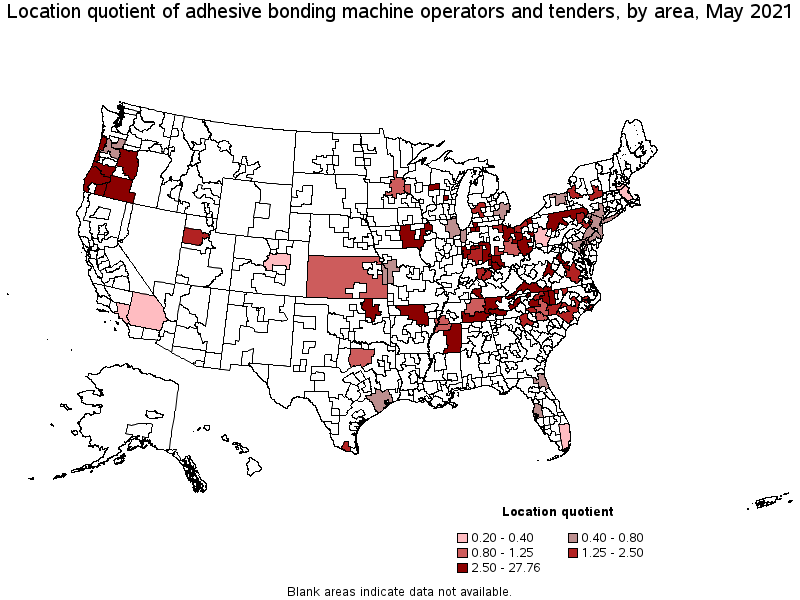
States with the highest concentration of jobs and location quotients in Adhesive Bonding Machine Operators and Tenders:
| State | Employment (1) | Employment per thousand jobs | Location quotient (9) | Hourly mean wage | Annual mean wage (2) |
|---|---|---|---|---|---|
| Mississippi | 770 | 0.70 | 7.87 | $ 12.96 | $ 26,960 |
| Oregon | 740 | 0.41 | 4.57 | $ 19.73 | $ 41,030 |
| Kentucky | 700 | 0.38 | 4.30 | $ 17.76 | $ 36,940 |
| Indiana | 860 | 0.29 | 3.24 | $ 14.83 | $ 30,850 |
| North Carolina | 960 | 0.22 | 2.45 | $ 16.07 | $ 33,420 |
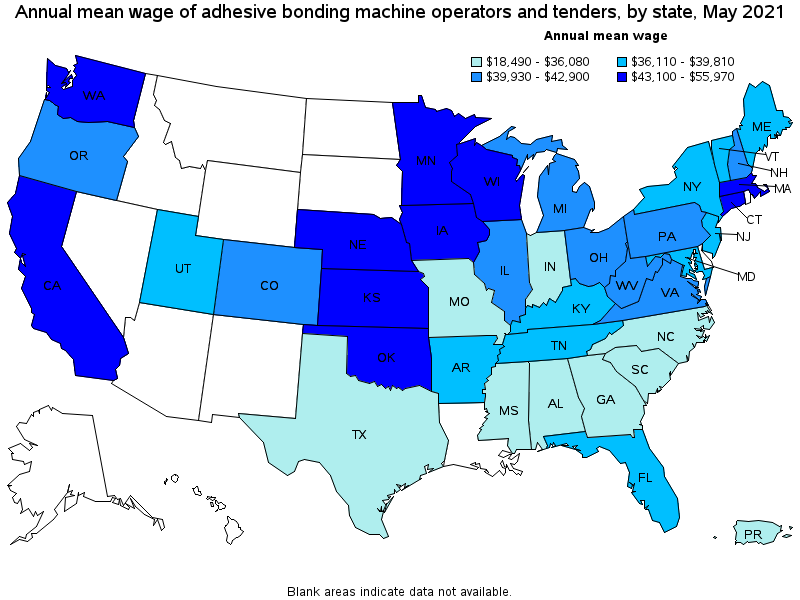
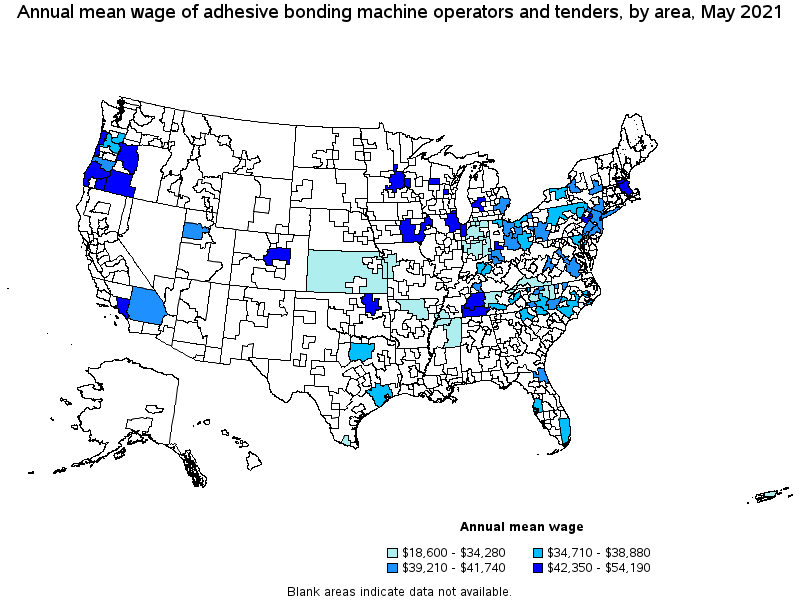
Top paying states for Adhesive Bonding Machine Operators and Tenders:
| State | Employment (1) | Employment per thousand jobs | Location quotient (9) | Hourly mean wage | Annual mean wage (2) |
|---|---|---|---|---|---|
| Washington | 360 | 0.11 | 1.27 | $ 26.91 | $ 55,970 |
| Oklahoma | 190 | 0.12 | 1.35 | $ 25.46 | $ 52,950 |
| Connecticut | 60 | 0.04 | 0.41 | $ 24.40 | $ 50,750 |
| Nebraska | 70 | 0.07 | 0.83 | $ 23.58 | $ 49,040 |
| Massachusetts | 140 | 0.04 | 0.45 | $ 21.64 | $ 45,000 |
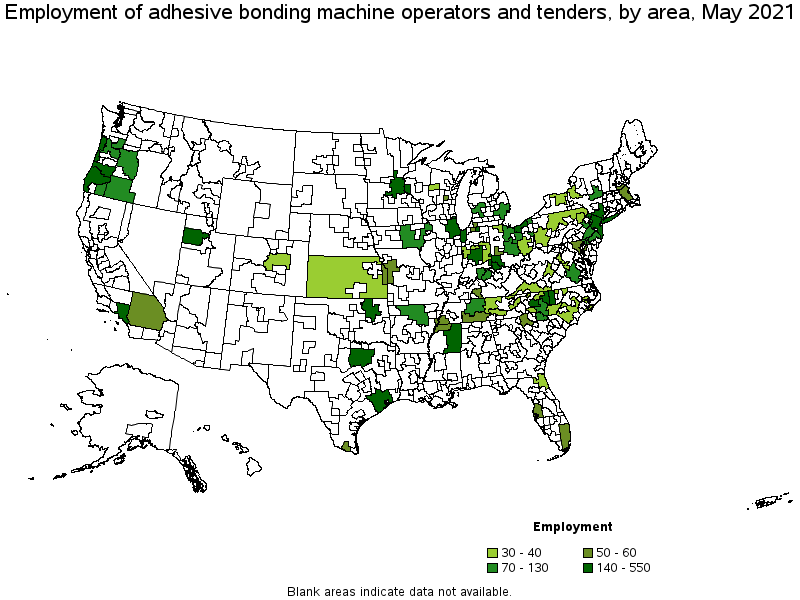
Metropolitan areas with the highest employment level in Adhesive Bonding Machine Operators and Tenders:
| Metropolitan area | Employment (1) | Employment per thousand jobs | Location quotient (9) | Hourly mean wage | Annual mean wage (2) |
|---|---|---|---|---|---|
| New York-Newark-Jersey City, NY-NJ-PA | 390 | 0.05 | 0.51 | $ 19.60 | $ 40,760 |
| Cincinnati, OH-KY-IN | 320 | 0.32 | 3.56 | $ 19.46 | $ 40,480 |
| Dallas-Fort Worth-Arlington, TX | 280 | 0.08 | 0.89 | $ 18.69 | $ 38,880 |
| Hickory-Lenoir-Morganton, NC | 230 | 1.59 | 17.86 | $ 15.38 | $ 31,980 |
| Chicago-Naperville-Elgin, IL-IN-WI | 220 | 0.05 | 0.59 | $ 21.06 | $ 43,810 |
| Greensboro-High Point, NC | 220 | 0.64 | 7.19 | $ 14.45 | $ 30,050 |
| Cleveland-Elyria, OH | 190 | 0.20 | 2.26 | $ 18.16 | $ 37,760 |
| Winston-Salem, NC | 180 | 0.70 | 7.92 | $ 15.98 | $ 33,230 |
| Eugene, OR | 170 | 1.16 | 13.10 | $ 19.34 | $ 40,220 |
| Tulsa, OK | 170 | 0.41 | 4.56 | $ 26.05 | $ 54,190 |
Metropolitan areas with the highest concentration of jobs and location quotients in Adhesive Bonding Machine Operators and Tenders:
| Metropolitan area | Employment (1) | Employment per thousand jobs | Location quotient (9) | Hourly mean wage | Annual mean wage (2) |
|---|---|---|---|---|---|
| Hickory-Lenoir-Morganton, NC | 230 | 1.59 | 17.86 | $ 15.38 | $ 31,980 |
| Eugene, OR | 170 | 1.16 | 13.10 | $ 19.34 | $ 40,220 |
| Medford, OR | 100 | 1.12 | 12.65 | $ 20.63 | $ 42,910 |
| Elkhart-Goshen, IN | 140 | 1.05 | 11.79 | $ 15.48 | $ 32,190 |
| Bowling Green, KY | 60 | 0.79 | 8.92 | $ 19.13 | $ 39,790 |
| Winston-Salem, NC | 180 | 0.70 | 7.92 | $ 15.98 | $ 33,230 |
| Greensboro-High Point, NC | 220 | 0.64 | 7.19 | $ 14.45 | $ 30,050 |
| Wausau, WI | 40 | 0.56 | 6.31 | $ 20.86 | $ 43,380 |
| Oshkosh-Neenah, WI | 50 | 0.53 | 6.00 | $ 21.70 | $ 45,130 |
| South Bend-Mishawaka, IN-MI | 60 | 0.44 | 4.97 | $ 15.16 | $ 31,530 |
Top paying metropolitan areas for Adhesive Bonding Machine Operators and Tenders:
| Metropolitan area | Employment (1) | Employment per thousand jobs | Location quotient (9) | Hourly mean wage | Annual mean wage (2) |
|---|---|---|---|---|---|
| Tulsa, OK | 170 | 0.41 | 4.56 | $ 26.05 | $ 54,190 |
| Dayton, OH | 50 | 0.15 | 1.65 | $ 22.53 | $ 46,860 |
| Boston-Cambridge-Nashua, MA-NH | 60 | 0.02 | 0.28 | $ 22.35 | $ 46,480 |
| Minneapolis-St. Paul-Bloomington, MN-WI | 150 | 0.08 | 0.93 | $ 22.06 | $ 45,890 |
| Oshkosh-Neenah, WI | 50 | 0.53 | 6.00 | $ 21.70 | $ 45,130 |
| Allentown-Bethlehem-Easton, PA-NJ | 70 | 0.20 | 2.25 | $ 21.27 | $ 44,240 |
| Denver-Aurora-Lakewood, CO | 40 | 0.03 | 0.28 | $ 21.15 | $ 44,000 |
| Chicago-Naperville-Elgin, IL-IN-WI | 220 | 0.05 | 0.59 | $ 21.06 | $ 43,810 |
| Nashville-Davidson--Murfreesboro--Franklin, TN | 100 | 0.11 | 1.19 | $ 20.97 | $ 43,610 |
| Wausau, WI | 40 | 0.56 | 6.31 | $ 20.86 | $ 43,380 |
Nonmetropolitan areas with the highest employment in Adhesive Bonding Machine Operators and Tenders:
| Nonmetropolitan area | Employment (1) | Employment per thousand jobs | Location quotient (9) | Hourly mean wage | Annual mean wage (2) |
|---|---|---|---|---|---|
| Northeast Mississippi nonmetropolitan area | 550 | 2.46 | 27.76 | $ 12.71 | $ 26,430 |
| Coast Oregon nonmetropolitan area | 160 | 1.50 | 16.84 | $ 21.21 | $ 44,110 |
| Central Oregon nonmetropolitan area | 130 | 2.10 | 23.64 | $ 20.40 | $ 42,430 |
| North Northeastern Ohio nonmetropolitan area (noncontiguous) | 130 | 0.40 | 4.53 | $ 19.99 | $ 41,580 |
| Southeast Iowa nonmetropolitan area | 70 | 0.34 | 3.88 | $ 22.27 | $ 46,310 |
Nonmetropolitan areas with the highest concentration of jobs and location quotients in Adhesive Bonding Machine Operators and Tenders:
| Nonmetropolitan area | Employment (1) | Employment per thousand jobs | Location quotient (9) | Hourly mean wage | Annual mean wage (2) |
|---|---|---|---|---|---|
| Northeast Mississippi nonmetropolitan area | 550 | 2.46 | 27.76 | $ 12.71 | $ 26,430 |
| Central Oregon nonmetropolitan area | 130 | 2.10 | 23.64 | $ 20.40 | $ 42,430 |
| Coast Oregon nonmetropolitan area | 160 | 1.50 | 16.84 | $ 21.21 | $ 44,110 |
| North Arkansas nonmetropolitan area | 70 | 0.62 | 6.99 | $ 14.62 | $ 30,410 |
| Northwest Virginia nonmetropolitan area | 30 | 0.53 | 5.97 | $ 18.97 | $ 39,460 |
Top paying nonmetropolitan areas for Adhesive Bonding Machine Operators and Tenders:
| Nonmetropolitan area | Employment (1) | Employment per thousand jobs | Location quotient (9) | Hourly mean wage | Annual mean wage (2) |
|---|---|---|---|---|---|
| Southeast Iowa nonmetropolitan area | 70 | 0.34 | 3.88 | $ 22.27 | $ 46,310 |
| Coast Oregon nonmetropolitan area | 160 | 1.50 | 16.84 | $ 21.21 | $ 44,110 |
| Central Oregon nonmetropolitan area | 130 | 2.10 | 23.64 | $ 20.40 | $ 42,430 |
| South Central Tennessee nonmetropolitan area | 50 | 0.46 | 5.23 | $ 20.36 | $ 42,350 |
| Piedmont North Carolina nonmetropolitan area | 30 | 0.14 | 1.54 | $ 20.01 | $ 41,610 |
These estimates are calculated with data collected from employers in all industry sectors, all metropolitan and nonmetropolitan areas, and all states and the District of Columbia. The top employment and wage figures are provided above. The complete list is available in the downloadable XLS files.
The percentile wage estimate is the value of a wage below which a certain percent of workers fall. The median wage is the 50th percentile wage estimate—50 percent of workers earn less than the median and 50 percent of workers earn more than the median. More about percentile wages.
(1) Estimates for detailed occupations do not sum to the totals because the totals include occupations not shown separately. Estimates do not include self-employed workers.
(2) Annual wages have been calculated by multiplying the hourly mean wage by a "year-round, full-time" hours figure of 2,080 hours; for those occupations where there is not an hourly wage published, the annual wage has been directly calculated from the reported survey data.
(3) The relative standard error (RSE) is a measure of the reliability of a survey statistic. The smaller the relative standard error, the more precise the estimate.
(9) The location quotient is the ratio of the area concentration of occupational employment to the national average concentration. A location quotient greater than one indicates the occupation has a higher share of employment than average, and a location quotient less than one indicates the occupation is less prevalent in the area than average.
Other OEWS estimates and related information:
May 2021 National Occupational Employment and Wage Estimates
May 2021 State Occupational Employment and Wage Estimates
May 2021 Metropolitan and Nonmetropolitan Area Occupational Employment and Wage Estimates
May 2021 National Industry-Specific Occupational Employment and Wage Estimates
Last Modified Date: March 31, 2022