
An official website of the United States government
An official website of the United States government
The .gov means it's official.
Federal government websites often end in .gov or .mil. Before sharing sensitive information,
make sure you're on a federal government site.
The site is secure.
The
https:// ensures that you are connecting to the official website and that any
information you provide is encrypted and transmitted securely.
Engrave or etch metal, wood, rubber, or other materials. Includes such workers as etcher-circuit processors, pantograph engravers, and silk screen etchers. Photoengravers are included in �Prepress Technicians and Workers� (51-5111).
Employment estimate and mean wage estimates for Etchers and Engravers:
| Employment (1) | Employment RSE (3) |
Mean hourly wage |
Mean annual wage (2) |
Wage RSE (3) |
|---|---|---|---|---|
| 7,110 | 10.6 % | $ 17.77 | $ 36,970 | 1.7 % |
Percentile wage estimates for Etchers and Engravers:
| Percentile | 10% | 25% | 50% (Median) |
75% | 90% |
|---|---|---|---|---|---|
| Hourly Wage | $ 11.47 | $ 14.16 | $ 17.59 | $ 21.13 | $ 23.74 |
| Annual Wage (2) | $ 23,860 | $ 29,460 | $ 36,590 | $ 43,950 | $ 49,390 |
Industries with the highest published employment and wages for Etchers and Engravers are provided. For a list of all industries with employment in Etchers and Engravers, see the Create Customized Tables function.
Industries with the highest levels of employment in Etchers and Engravers:
| Industry | Employment (1) | Percent of industry employment | Hourly mean wage | Annual mean wage (2) |
|---|---|---|---|---|
| Other Miscellaneous Store Retailers | 2,090 | 0.56 | $ 16.42 | $ 34,150 |
| Other Miscellaneous Manufacturing | 910 | 0.33 | $ 17.80 | $ 37,020 |
| Coating, Engraving, Heat Treating, and Allied Activities | 720 | 0.58 | $ 19.49 | $ 40,540 |
| Electronic Shopping and Mail-Order Houses | 550 | 0.12 | $ 15.17 | $ 31,560 |
| Nonmetallic Mineral Product Manufacturing | 390 | 0.10 | $ 20.25 | $ 42,110 |
Industries with the highest concentration of employment in Etchers and Engravers:
| Industry | Employment (1) | Percent of industry employment | Hourly mean wage | Annual mean wage (2) |
|---|---|---|---|---|
| Coating, Engraving, Heat Treating, and Allied Activities | 720 | 0.58 | $ 19.49 | $ 40,540 |
| Other Miscellaneous Store Retailers | 2,090 | 0.56 | $ 16.42 | $ 34,150 |
| Other Miscellaneous Manufacturing | 910 | 0.33 | $ 17.80 | $ 37,020 |
| Electronic Shopping and Mail-Order Houses | 550 | 0.12 | $ 15.17 | $ 31,560 |
| Nonmetallic Mineral Product Manufacturing | 390 | 0.10 | $ 20.25 | $ 42,110 |
Top paying industries for Etchers and Engravers:
| Industry | Employment (1) | Percent of industry employment | Hourly mean wage | Annual mean wage (2) |
|---|---|---|---|---|
| Semiconductor and Other Electronic Component Manufacturing | 230 | 0.06 | $ 22.72 | $ 47,270 |
| Fabricated Metal Product Manufacturing (3323 and 3324 only) | 100 | 0.02 | $ 21.56 | $ 44,850 |
| Nonmetallic Mineral Product Manufacturing | 390 | 0.10 | $ 20.25 | $ 42,110 |
| Medical Equipment and Supplies Manufacturing | 50 | 0.02 | $ 20.19 | $ 42,000 |
| Specialized Design Services | (8) | (8) | $ 20.19 | $ 41,990 |
States and areas with the highest published employment, location quotients, and wages for Etchers and Engravers are provided. For a list of all areas with employment in Etchers and Engravers, see the Create Customized Tables function.
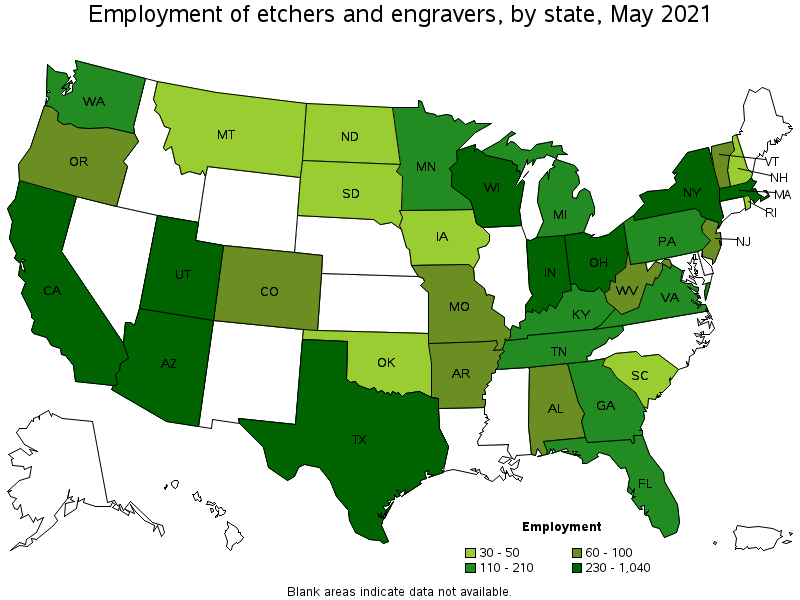
States with the highest employment level in Etchers and Engravers:
| State | Employment (1) | Employment per thousand jobs | Location quotient (9) | Hourly mean wage | Annual mean wage (2) |
|---|---|---|---|---|---|
| Texas | 1,040 | 0.08 | 1.68 | $ 16.17 | $ 33,640 |
| California | 560 | 0.03 | 0.67 | $ 19.00 | $ 39,520 |
| New York | 400 | 0.05 | 0.92 | $ 17.98 | $ 37,400 |
| Indiana | 350 | 0.12 | 2.30 | $ 17.86 | $ 37,140 |
| Massachusetts | 330 | 0.10 | 1.91 | $ 20.71 | $ 43,070 |
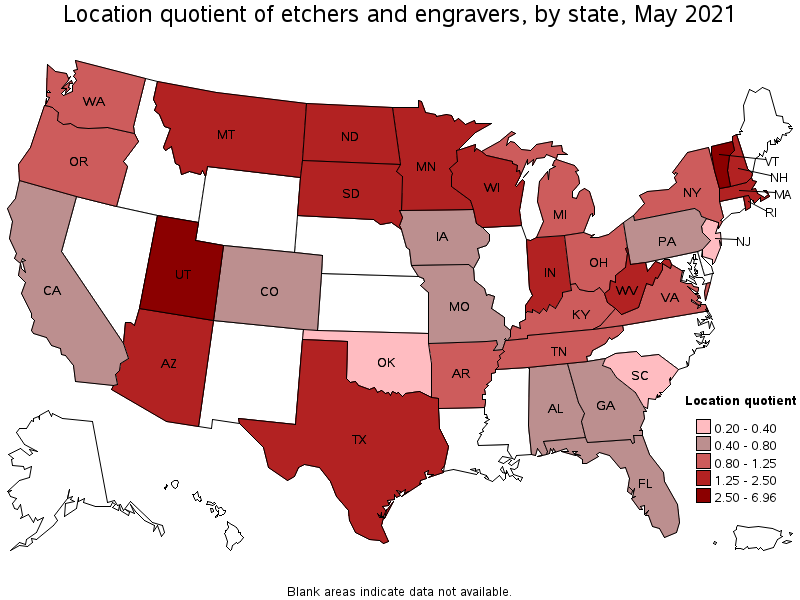
States with the highest concentration of jobs and location quotients in Etchers and Engravers:
| State | Employment (1) | Employment per thousand jobs | Location quotient (9) | Hourly mean wage | Annual mean wage (2) |
|---|---|---|---|---|---|
| Vermont | 100 | 0.35 | 6.96 | $ 21.12 | $ 43,920 |
| Utah | 310 | 0.20 | 4.01 | $ 13.90 | $ 28,920 |
| Indiana | 350 | 0.12 | 2.30 | $ 17.86 | $ 37,140 |
| Montana | 50 | 0.11 | 2.19 | $ 15.21 | $ 31,640 |
| Rhode Island | 50 | 0.10 | 2.07 | $ 18.38 | $ 38,230 |
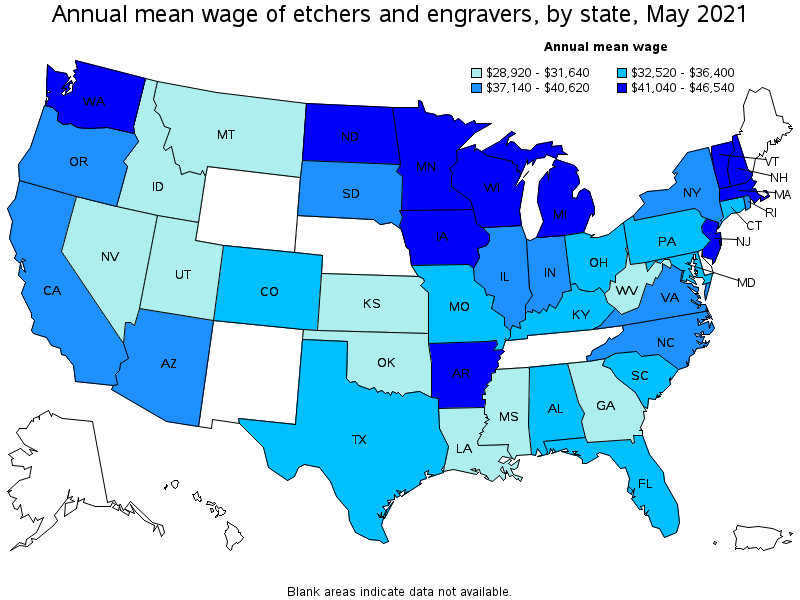
Top paying states for Etchers and Engravers:
| State | Employment (1) | Employment per thousand jobs | Location quotient (9) | Hourly mean wage | Annual mean wage (2) |
|---|---|---|---|---|---|
| North Dakota | 30 | 0.09 | 1.71 | $ 22.37 | $ 46,540 |
| Michigan | 210 | 0.05 | 1.05 | $ 21.60 | $ 44,940 |
| Arkansas | 70 | 0.05 | 1.08 | $ 21.32 | $ 44,340 |
| Washington | 140 | 0.04 | 0.88 | $ 21.22 | $ 44,140 |
| Vermont | 100 | 0.35 | 6.96 | $ 21.12 | $ 43,920 |
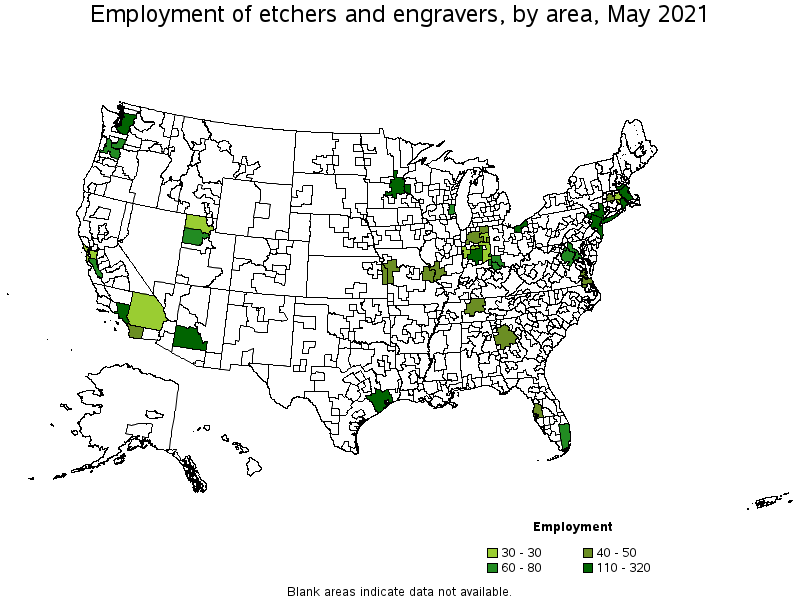
Metropolitan areas with the highest employment level in Etchers and Engravers:
| Metropolitan area | Employment (1) | Employment per thousand jobs | Location quotient (9) | Hourly mean wage | Annual mean wage (2) |
|---|---|---|---|---|---|
| New York-Newark-Jersey City, NY-NJ-PA | 320 | 0.04 | 0.72 | $ 18.00 | $ 37,440 |
| Los Angeles-Long Beach-Anaheim, CA | 260 | 0.05 | 0.90 | $ 18.28 | $ 38,030 |
| Phoenix-Mesa-Scottsdale, AZ | 240 | 0.12 | 2.29 | $ 18.38 | $ 38,220 |
| Houston-The Woodlands-Sugar Land, TX | 240 | 0.08 | 1.62 | $ 15.73 | $ 32,710 |
| Boston-Cambridge-Nashua, MA-NH | 210 | 0.08 | 1.63 | $ 20.34 | $ 42,310 |
| Minneapolis-St. Paul-Bloomington, MN-WI | 130 | 0.07 | 1.44 | $ 20.56 | $ 42,770 |
| Indianapolis-Carmel-Anderson, IN | 120 | 0.12 | 2.41 | $ 17.14 | $ 35,660 |
| Cleveland-Elyria, OH | 110 | 0.12 | 2.30 | $ 16.89 | $ 35,130 |
| Providence-Warwick, RI-MA | 110 | 0.21 | 4.12 | $ 20.33 | $ 42,290 |
| Seattle-Tacoma-Bellevue, WA | 110 | 0.06 | 1.10 | $ 22.43 | $ 46,650 |
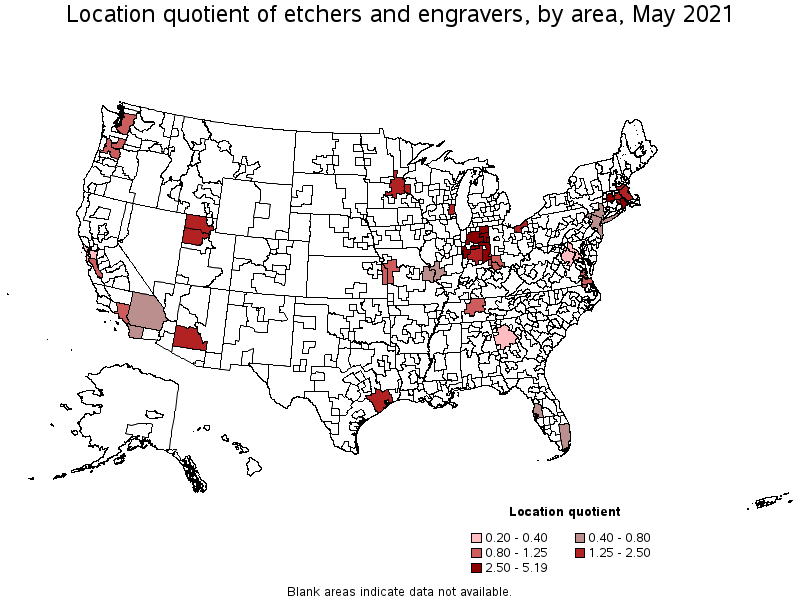
Metropolitan areas with the highest concentration of jobs and location quotients in Etchers and Engravers:
| Metropolitan area | Employment (1) | Employment per thousand jobs | Location quotient (9) | Hourly mean wage | Annual mean wage (2) |
|---|---|---|---|---|---|
| Providence-Warwick, RI-MA | 110 | 0.21 | 4.12 | $ 20.33 | $ 42,290 |
| Fort Wayne, IN | 30 | 0.15 | 2.92 | $ 16.62 | $ 34,560 |
| Springfield, MA-CT | 40 | 0.14 | 2.82 | $ 19.20 | $ 39,940 |
| Ogden-Clearfield, UT | 30 | 0.12 | 2.46 | $ 16.01 | $ 33,300 |
| Indianapolis-Carmel-Anderson, IN | 120 | 0.12 | 2.41 | $ 17.14 | $ 35,660 |
| Cleveland-Elyria, OH | 110 | 0.12 | 2.30 | $ 16.89 | $ 35,130 |
| Phoenix-Mesa-Scottsdale, AZ | 240 | 0.12 | 2.29 | $ 18.38 | $ 38,220 |
| Worcester, MA-CT | 30 | 0.11 | 2.26 | $ 21.13 | $ 43,940 |
| Salt Lake City, UT | 70 | 0.10 | 1.93 | $ 17.86 | $ 37,160 |
| Milwaukee-Waukesha-West Allis, WI | 70 | 0.09 | 1.75 | $ 20.43 | $ 42,500 |
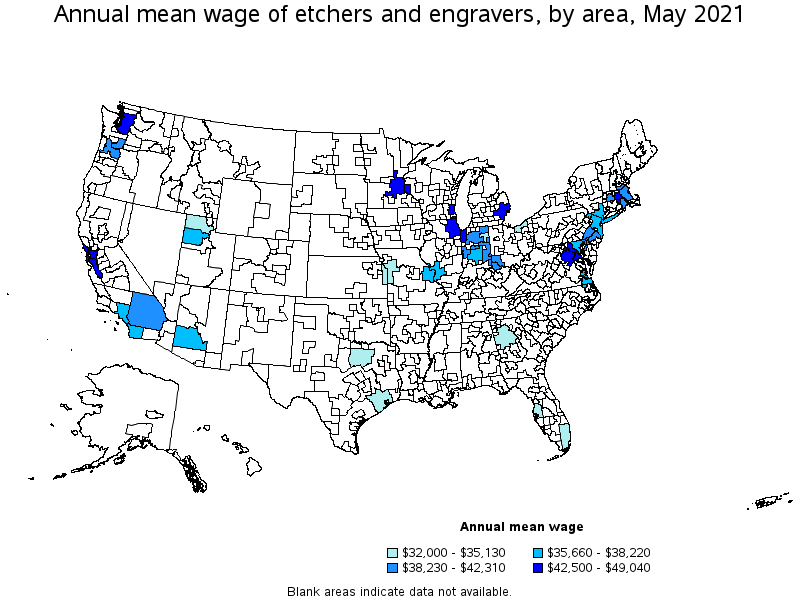
Top paying metropolitan areas for Etchers and Engravers:
| Metropolitan area | Employment (1) | Employment per thousand jobs | Location quotient (9) | Hourly mean wage | Annual mean wage (2) |
|---|---|---|---|---|---|
| San Jose-Sunnyvale-Santa Clara, CA | 60 | 0.05 | 1.02 | $ 23.58 | $ 49,040 |
| Seattle-Tacoma-Bellevue, WA | 110 | 0.06 | 1.10 | $ 22.43 | $ 46,650 |
| San Francisco-Oakland-Hayward, CA | 30 | 0.01 | 0.29 | $ 21.54 | $ 44,790 |
| Detroit-Warren-Dearborn, MI | (8) | (8) | (8) | $ 21.28 | $ 44,260 |
| Worcester, MA-CT | 30 | 0.11 | 2.26 | $ 21.13 | $ 43,940 |
| Washington-Arlington-Alexandria, DC-VA-MD-WV | 60 | 0.02 | 0.38 | $ 20.96 | $ 43,600 |
| Chicago-Naperville-Elgin, IL-IN-WI | (8) | (8) | (8) | $ 20.61 | $ 42,860 |
| Minneapolis-St. Paul-Bloomington, MN-WI | 130 | 0.07 | 1.44 | $ 20.56 | $ 42,770 |
| Milwaukee-Waukesha-West Allis, WI | 70 | 0.09 | 1.75 | $ 20.43 | $ 42,500 |
| Boston-Cambridge-Nashua, MA-NH | 210 | 0.08 | 1.63 | $ 20.34 | $ 42,310 |
Nonmetropolitan areas with the highest employment in Etchers and Engravers:
| Nonmetropolitan area | Employment (1) | Employment per thousand jobs | Location quotient (9) | Hourly mean wage | Annual mean wage (2) |
|---|---|---|---|---|---|
| Northern Indiana nonmetropolitan area | 50 | 0.26 | 5.19 | $ 19.63 | $ 40,830 |
| Central Indiana nonmetropolitan area | 30 | 0.21 | 4.09 | $ 19.96 | $ 41,520 |
Nonmetropolitan areas with the highest concentration of jobs and location quotients in Etchers and Engravers:
| Nonmetropolitan area | Employment (1) | Employment per thousand jobs | Location quotient (9) | Hourly mean wage | Annual mean wage (2) |
|---|---|---|---|---|---|
| Northern Indiana nonmetropolitan area | 50 | 0.26 | 5.19 | $ 19.63 | $ 40,830 |
| Central Indiana nonmetropolitan area | 30 | 0.21 | 4.09 | $ 19.96 | $ 41,520 |
Top paying nonmetropolitan areas for Etchers and Engravers:
| Nonmetropolitan area | Employment (1) | Employment per thousand jobs | Location quotient (9) | Hourly mean wage | Annual mean wage (2) |
|---|---|---|---|---|---|
| Central Indiana nonmetropolitan area | 30 | 0.21 | 4.09 | $ 19.96 | $ 41,520 |
| Northern Indiana nonmetropolitan area | 50 | 0.26 | 5.19 | $ 19.63 | $ 40,830 |
These estimates are calculated with data collected from employers in all industry sectors, all metropolitan and nonmetropolitan areas, and all states and the District of Columbia. The top employment and wage figures are provided above. The complete list is available in the downloadable XLS files.
The percentile wage estimate is the value of a wage below which a certain percent of workers fall. The median wage is the 50th percentile wage estimate—50 percent of workers earn less than the median and 50 percent of workers earn more than the median. More about percentile wages.
(1) Estimates for detailed occupations do not sum to the totals because the totals include occupations not shown separately. Estimates do not include self-employed workers.
(2) Annual wages have been calculated by multiplying the hourly mean wage by a "year-round, full-time" hours figure of 2,080 hours; for those occupations where there is not an hourly wage published, the annual wage has been directly calculated from the reported survey data.
(3) The relative standard error (RSE) is a measure of the reliability of a survey statistic. The smaller the relative standard error, the more precise the estimate.
(8) Estimate not released.
(9) The location quotient is the ratio of the area concentration of occupational employment to the national average concentration. A location quotient greater than one indicates the occupation has a higher share of employment than average, and a location quotient less than one indicates the occupation is less prevalent in the area than average.
Other OEWS estimates and related information:
May 2021 National Occupational Employment and Wage Estimates
May 2021 State Occupational Employment and Wage Estimates
May 2021 Metropolitan and Nonmetropolitan Area Occupational Employment and Wage Estimates
May 2021 National Industry-Specific Occupational Employment and Wage Estimates
Last Modified Date: March 31, 2022